

ismagilov/iStock via Getty Images
Author’s note: This article was released to CEF/ETF Income Laboratory members on June 7th, 2022. Please check latest data before investing.
The Weekly Closed-End Fund Roundup will be put out at the start of each week to summarize recent price movements in closed-end fund [CEF] sectors in the last week, as well as to highlight recently concluded or upcoming corporate actions on CEFs, such as tender offers. Data is taken from the close of Friday, June 3rd, 2022.
Weekly performance roundup
7 out of 23 sectors were positive on price (down from 22 last week) and the average price return was -0.20% (down from +4.47% last week). The lead gainer was Asia Equity (+1.46%) while Preferreds lagged (-2.15%).
Income Lab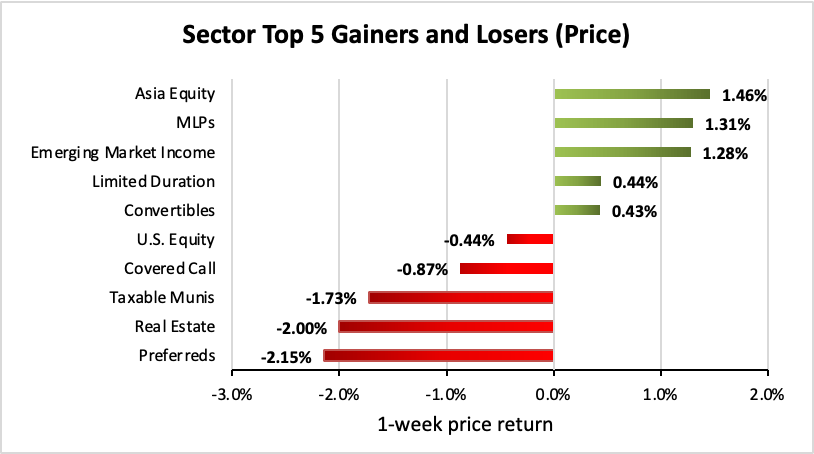
11 out of 23 sectors were positive on NAV (down from 22 last week), while the average NAV return was +0.20% (up from +0.56% last week). The top sector by NAV was MLPs (+1.95%) while the weakest sector by NAV was Taxable Munis (-4.22%).
Income Lab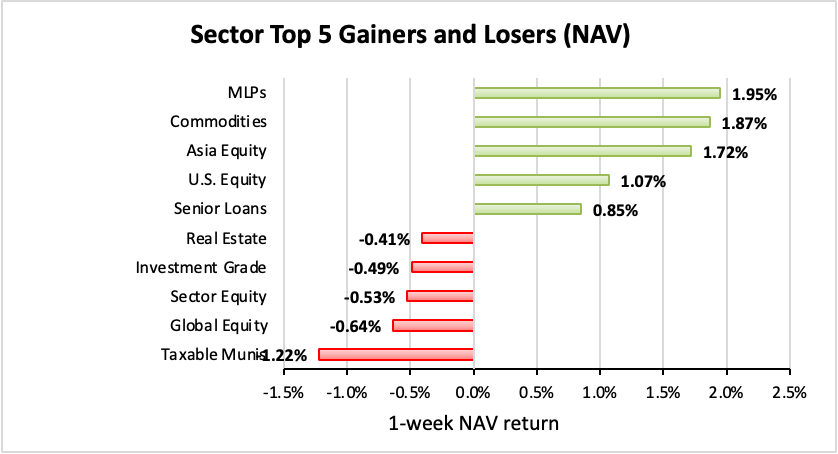
The sector with the highest premium was Taxable Munis (+2.13%), while the sector with the widest discount is MLPs (-16.19%). The average sector discount is -5.5% (down from -5.45% last week).
Income Lab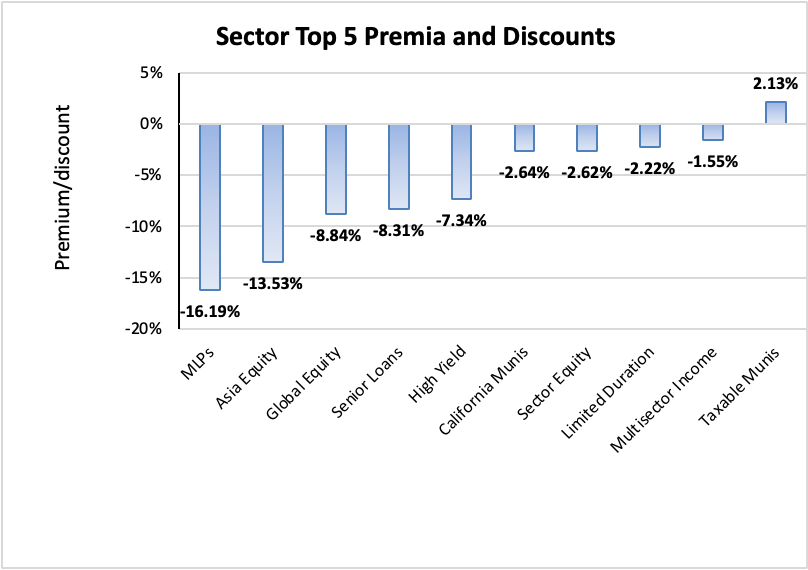
The sector with the highest premium/discount increase was Preferreds (-2.11%), while California Munis (+1.43%) showed the lowest premium/discount decline. The average change in premium/discount was +0.13% (down from +0.74% last week).
Income Lab
The sector with the highest average 1-year z-score is Taxable Munis (+0.65), while the sector with the lowest average 1-year z-score is Senior Loans (-1.65). The average z-score is -0.73 (up from 0.74 last week).
Income Lab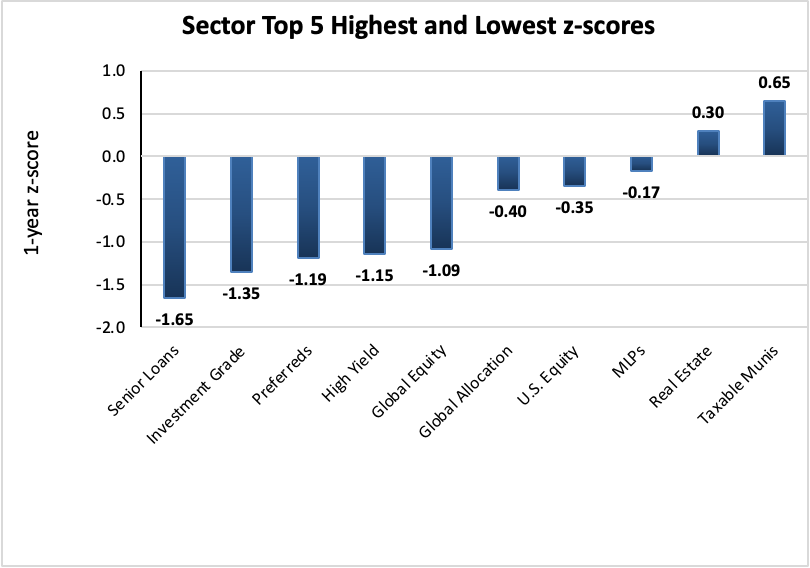
The sectors with the highest yields are Asia Equity (14.87%), Global Equity (10.94%), and Limited Duration (10.45%). Discounts are included for comparison. The average sector yield is +7.99% (down from +8.29% last week).
Income Lab
Individual CEFs that have undergone a significant decrease in premium/discount value over the past week, coupled optionally with an increasing NAV trend, a negative z-score, and/or are trading at a discount, are potential buy candidates.
| Fund | Ticker | P/D decrease | Yield | P/D | z-score | Price change | NAV change |
| Cornerstone Strategic Value | (CLM) | -14.56% | 20.66% | 31.58% | -0.2 | -5.49% | 5.84% |
| Cornerstone Total Return Fund | (CRF) | -10.68% | 20.48% | 32.29% | -0.2 | -3.33% | 5.79% |
| EV Municipal Income 2028 Term Trust | (ETX) | -8.52% | 4.20% | 2.64% | -0.1 | -7.45% | 0.25% |
| Eagle Capital Growth | (GRF) | -5.75% | 10.33% | -8.12% | 0.8 | 3.03% | 4.93% |
| Cohen & Steers Real Estate Opp & Inc Fd | (RLTY) | -5.30% | 7.18% | -7.75% | 0.0 | -3.71% | 1.89% |
| Flah&Crum Total Return Fund | (FLC) | -5.00% | 7.83% | -1.16% | -0.9 | -4.84% | 0.00% |
| BlackRock Long-Term Muni Advantage | (BTA) | -4.45% | 5.66% | 1.94% | 0.2 | -3.43% | 0.80% |
| BlackRock Municipal Income | (BFK) | -4.14% | 4.49% | 0.57% | -0.2 | -3.34% | 0.65% |
| JHancock Preferred Income III | (HPS) | -4.04% | 7.90% | 3.34% | -0.5 | -4.08% | -0.31% |
| Nuveen Pref & Income Securities | (JPS) | -3.56% | 7.56% | -9.92% | -2.0 | -3.46% | 0.36% |
Income Lab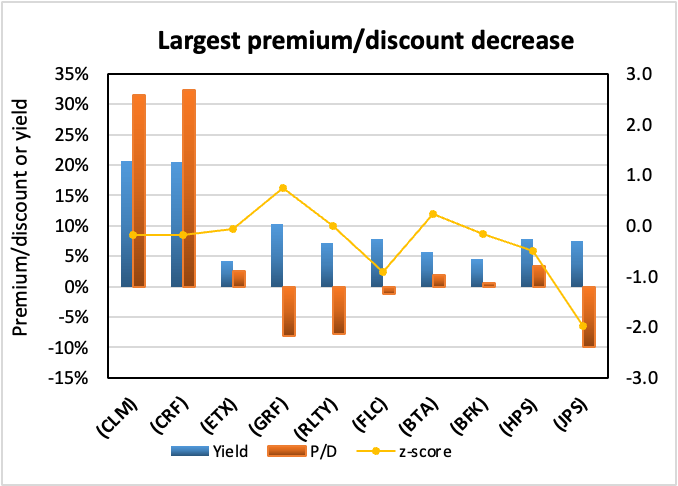
Conversely, individual CEFs that have undergone a significant increase in premium/discount value in the past week, coupled optionally with a decreasing NAV trend, a positive z-score, and/or are trading at a premium, are potential sell candidates.
| Fund | Ticker | P/D increase | Yield | P/D | z-score | Price change | NAV change |
| OFS Credit Company Inc | (OCCI) | 9.42% | 19.21% | -8.60% | -1.0 | 8.53% | 0.00% |
| Virtus Stone Harbor Emg Mkts Total Inc | (EDI) | 6.17% | 13.29% | 5.33% | -0.1 | 5.51% | -0.66% |
| Virtus Stone Harbor Emerging Markets Inc | (EDF) | 6.17% | 12.54% | 13.21% | 0.4 | 4.94% | -0.78% |
| The Central Europe & Russia Fund | (CEE) | 6.11% | 8.59% | 53.31% | 2.2 | 5.90% | 1.69% |
| Gabelli Multimedia | (GGT) | 5.20% | 10.85% | 35.85% | 2.4 | 1.76% | -2.13% |
| Oxford Lane Capital Corp | (OXLC) | 5.03% | 13.33% | 6.83% | -0.9 | 0.90% | 0.00% |
| BlackRock Innovation & Growth Tr | (BIGZ) | 3.89% | 9.46% | -14.29% | -1.1 | 1.37% | 2.88% |
| PIMCO Corporate & Income Opportunity Fd | (PTY) | 3.76% | 9.52% | 20.73% | -0.4 | 3.46% | 0.24% |
| ASA Gold and Precious Metals Limited | (ASA) | 3.49% | 0.11% | -8.87% | 2.9 | -0.05% | -1.79% |
| RiverNorth Opp Muni Income Fund Inc | (RMI) | 3.30% | 6.92% | -4.35% | 0.0 | 4.16% | 0.96% |
Income Lab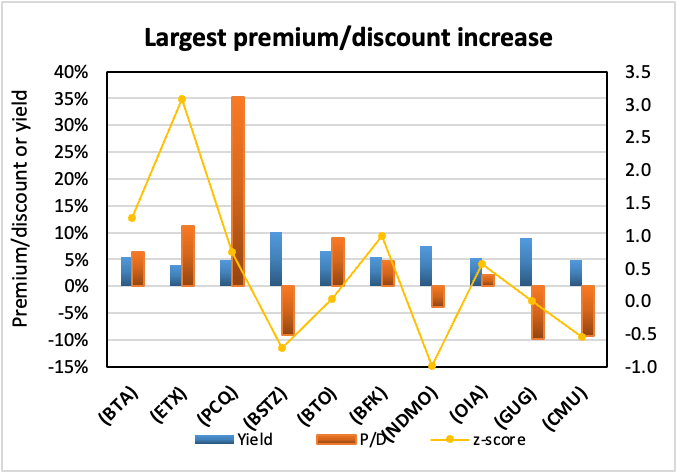
Recent corporate actions
These are from the past month. Any new news in the past week has a bolded date:
June 6, 2022 | Nuveen Municipal Closed-End Funds Announce Completion of Reorganization.
May 24, 2022 | NEUBERGER BERMAN HIGH YIELD STRATEGIES FUND ANNOUNCES FINAL RESULTS OF RIGHTS OFFERING.
May 13, 2022 | Western Asset High Income Fund II Inc. Announces Final Results of Transferable Rights Offering.
Upcoming corporate actions
These are from the past month. Any new news in the past week has a bolded date:
May 23, 2022 | Cornerstone Strategic Value Fund, Inc. Announces the Resumption of its Rights Offering and Change in June 2022 Distribution Record Date.
May 23, 2022 | Cornerstone Total Return Fund, Inc. Announces the Resumption of Its Rights Offering and Change in June 2022 Distribution Record Date.
May 16, 2022 | Cornerstone Strategic Value Fund, Inc. Announces the Suspension of its Rights Offering.
May 16, 2022 | Cornerstone Total Return Fund, Inc. Announces the Suspension of its Rights Offering.
May 2, 2022 | Gabelli Global Utility & Income Trust Announces Rights Offering for Common Shares Record Date and Summary of Terms.
Recent activist or other CEF news
These are from the past month. Any new news in the past week has a bolded date:
————————————
Distribution changes this month
These are sorted in ascending order of distribution change percentage. Funds with distribution changes this month are included. Any distribution declarations made this week are in bold. I’ve also added monthly/quarterly information as well as yield, coverage (after the boost/cut), discount and 1-year z-score information. I’ve separated the funds into two sub-categories, cutters and boosters.
Cutters
Income Lab
Boosters
Income Lab
Be the first to comment