

Luis Alvarez/DigitalVision via Getty Images
Author’s note: This article was released to CEF/ETF Income Laboratory members on June 13, 2022. Please check latest data before investing.
The Weekly Closed-End Fund Roundup will be put out at the start of each week to summarize recent price movements in closed-end fund [CEF] sectors in the last week, as well as to highlight recently concluded or upcoming corporate actions on CEFs, such as tender offers. Data is taken from the close of Friday, June 10th, 2022.
Weekly performance roundup
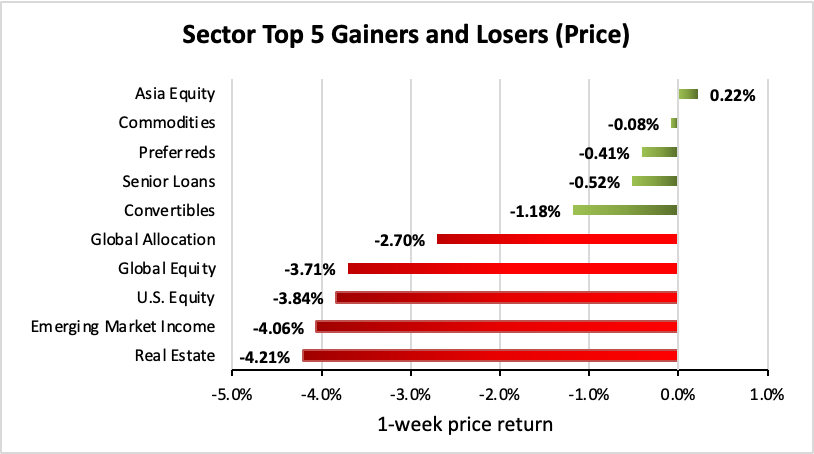
1 out of 23 sectors were positive on price (down from 7 last week) and the average price return was -2.13% (down from -0.20% last week). The lead gainer was Asia Equity (+0.22%) while Real Estate lagged (-4.21%).
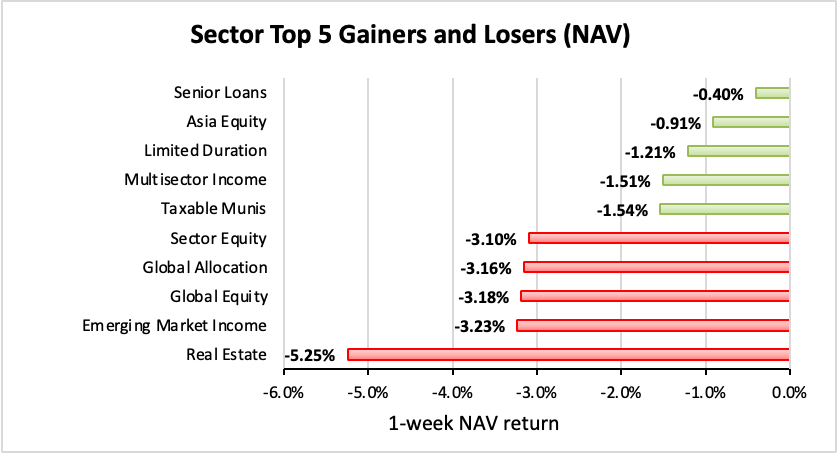
0 out of 23 sectors were positive on NAV (down from 11 last week), while the average NAV return was -2.32% (down from +0.20% last week). The top sector by NAV was Senior Loans (-0.40%) while the weakest sector by NAV was Real Estate (-5.25%).
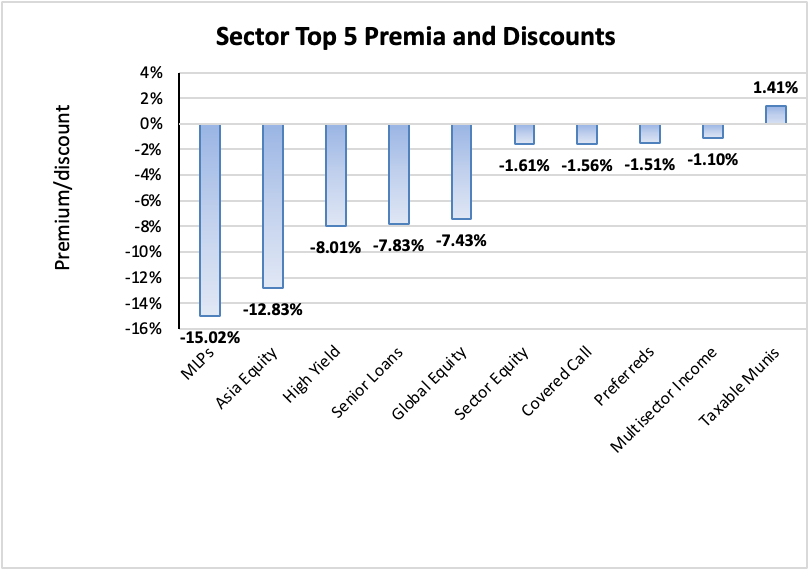
The sector with the highest premium was Taxable Munis (+1.41%), while the sector with the widest discount is MLPs (-15.02%). The average sector discount is -4.94% (up from -5.5% last week).
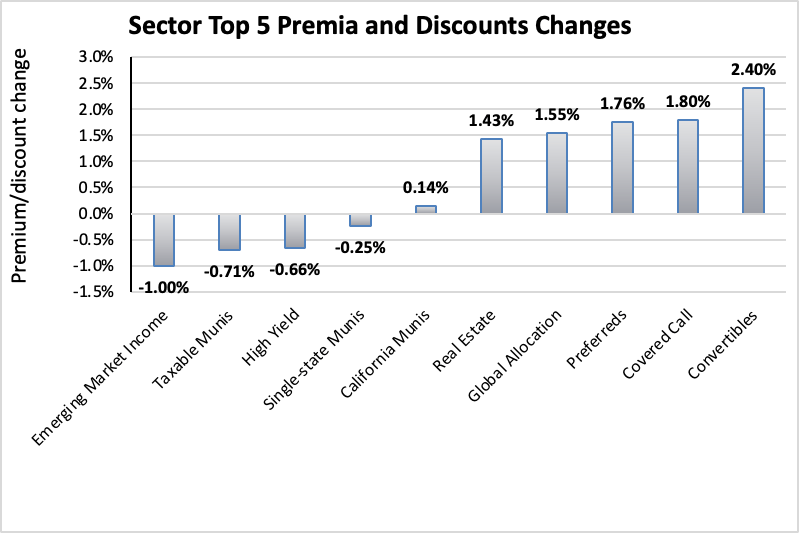
The sector with the highest premium/discount increase was Convertibles (+2.40%), while Emerging Market Income (-1.00%) showed the lowest premium/discount decline. The average change in premium/discount was +0.67% (up from +0.13% last week).
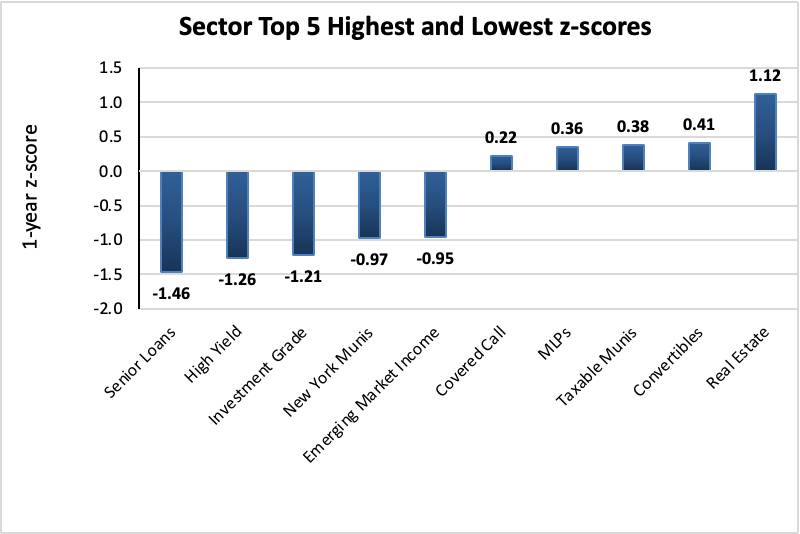
The sector with the highest average 1-year z-score is Real Estate (+1.12), while the sector with the lowest average 1-year z-score is Senior Loans (-1.46). The average z-score is -0.38 (up from -0.73 last week).
The sectors with the highest yields are Asia Equity (14.31%), Global Equity (11.38%), and Limited Duration (10.58%). Discounts are included for comparison. The average sector yield is +8.13% (up from +7.99% last week).

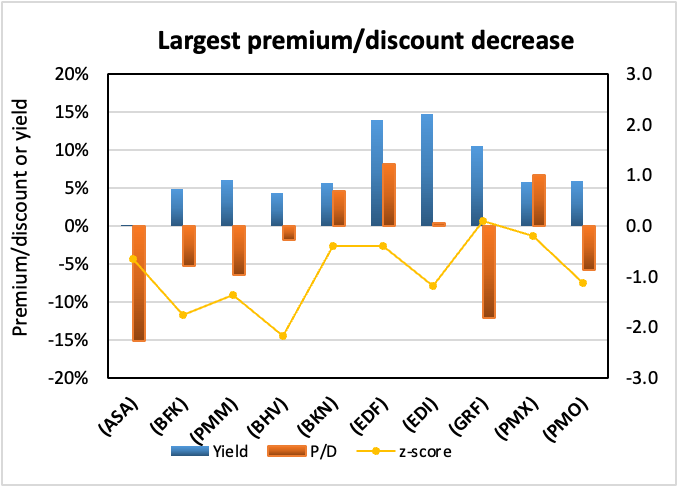
Individual CEFs that have undergone a significant decrease in premium/discount value over the past week, coupled optionally with an increasing NAV trend, a negative z-score, and/or are trading at a discount, are potential buy candidates.
| Fund | Ticker | P/D decrease | Yield | P/D | z-score | Price change | NAV change |
| ASA Gold and Precious Metals Limited | (ASA) | -6.31% | 0.11% | -15.20% | -0.7 | -1.28% | 1.53% |
| BlackRock Municipal Income | (BFK) | -5.80% | 4.90% | -5.24% | -1.8 | -8.37% | -2.75% |
| Putnam Managed Muni Income | (PMM) | -5.39% | 5.96% | -6.53% | -1.4 | -7.60% | -2.27% |
| BlackRock VA Municipal Bond | (BHV) | -5.35% | 4.28% | -1.85% | -2.2 | -7.87% | -2.84% |
| BlackRock Invest Qual Muni | (BKN) | -5.29% | 5.69% | 4.52% | -0.4 | -7.00% | -2.28% |
| Virtus Stone Harbor Emerging Markets Inc | (EDF) | -5.07% | 13.87% | 8.13% | -0.4 | -9.58% | -5.33% |
| Virtus Stone Harbor Emg Mkts Total Inc | (EDI) | -4.97% | 14.74% | 0.35% | -1.2 | -9.81% | -5.33% |
| Eagle Capital Growth | (GRF) | -4.00% | 10.53% | -12.13% | 0.1 | -1.92% | -0.78% |
| PIMCO Municipal Income III | (PMX) | -3.90% | 5.78% | 6.70% | -0.2 | -7.46% | -4.07% |
| Putnam Muni Opportunities | (PMO) | -3.66% | 5.83% | -5.78% | -1.1 | -5.78% | -2.11% |
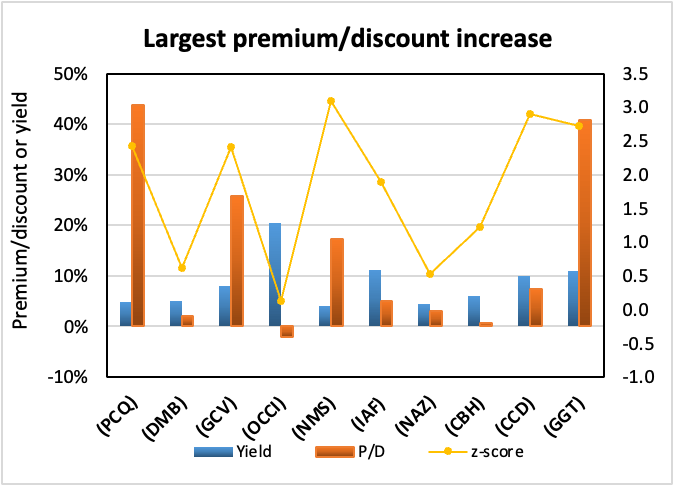
Conversely, individual CEFs that have undergone a significant increase in premium/discount value in the past week, coupled optionally with a decreasing NAV trend, a positive z-score, and/or are trading at a premium, are potential sell candidates.
| Fund | Ticker | P/D increase | Yield | P/D | z-score | Price change | NAV change |
| PIMCO CA Municipal Income | (PCQ) | 8.63% | 4.85% | 43.79% | 2.4 | 2.88% | -3.28% |
| BNY Mellon Muni Bond Infrastructure Fund | (DMB) | 7.85% | 4.96% | 2.15% | 0.6 | 6.12% | -2.03% |
| Gabelli Conv Inc Secs | (GCV) | 6.60% | 7.95% | 25.83% | 2.4 | 1.51% | -3.81% |
| OFS Credit Company Inc | (OCCI) | 6.44% | 20.41% | -2.17% | 0.1 | -5.85% | 0.00% |
| Nuveen MN Quality Muni Inc | (NMS) | 6.00% | 4.00% | 17.27% | 3.1 | 3.60% | -1.68% |
| Aberdeen Australia Equity Fund Inc | (IAF) | 5.86% | 11.24% | 5.12% | 1.9 | -1.66% | -7.13% |
| Nuveen AZ Quality Muni Inc | (NAZ) | 5.55% | 4.44% | 3.13% | 0.5 | 4.16% | -1.43% |
| AllianzGI Convert & Inc 2024 Target Term | (CBH) | 5.18% | 5.97% | 0.76% | 1.2 | 4.17% | -1.18% |
| Calamos Dynamic Convertible and Income | (CCD) | 5.15% | 10.02% | 7.45% | 2.9 | -0.13% | -4.90% |
| Gabelli Multimedia | (GGT) | 5.06% | 11.07% | 40.90% | 2.7 | -1.97% | -3.35% |
Recent corporate actions
These are from the past month. Any new news in the past week has a bolded date:
June 6, 2022 | Nuveen Municipal Closed-End Funds Announce Completion of Reorganization.
Ticker
Fund Name
Exchange Ratio
NEV
Nuveen Enhanced Municipal Value Fund
0.93046184
May 24, 2022 | NEUBERGER BERMAN HIGH YIELD STRATEGIES FUND ANNOUNCES FINAL RESULTS OF RIGHTS OFFERING.
May 13, 2022 | Western Asset High Income Fund II Inc. Announces Final Results of Transferable Rights Offering.
Upcoming corporate actions
These are from the past month. Any new news in the past week has a bolded date:
May 23, 2022 | Cornerstone Strategic Value Fund, Inc. Announces the Resumption of its Rights Offering and Change in June 2022 Distribution Record Date.
May 23, 2022 | Cornerstone Total Return Fund, Inc. Announces the Resumption of Its Rights Offering and Change in June 2022 Distribution Record Date.
May 16, 2022 | Cornerstone Strategic Value Fund, Inc. Announces the Suspension of its Rights Offering.
May 16, 2022 | Cornerstone Total Return Fund, Inc. Announces the Suspension of its Rights Offering.
May 2, 2022 | Gabelli Global Utility & Income Trust Announces Rights Offering for Common Shares Record Date and Summary of Terms.
Recent activist or other CEF news
These are from the past month. Any new news in the past week has a bolded date:
————————————
Distribution changes announced this month
These are sorted in ascending order of distribution change percentage. Funds with distribution changes announced this month are included. Any distribution declarations made this week are in bold. I’ve also added monthly/quarterly information as well as yield, coverage (after the boost/cut), discount and 1-year z-score information. I’ve separated the funds into two sub-categories, cutters and boosters.
Cutters

Boosters

————————————
Commentary
1. Volatility bring CEF rotation opportunities
With volatility on the rise again, is a good time to look for CEF rotation opportunities! Remember, while no one can time the markets consistently, we can stack the odds in our favor by rotating from a more expensive CEF to a less expensive CEF within the same sector. This way, we stand to gain “free shares” of our favorite CEFs, no matter whether the market moves up, down or sideways (see this link for more information on how this strategy works).
One way to quickly scan for overvalued/undervalued opportunities are the weekly premium/discount gainers and losers that we compile in each week’s CEF Weekly Roundup.
For example, we can see that PIMCO CA Municipal Income (PCQ) gained +8.63% in premium last week, and has now reached a premium of +43.79% which is accompanied by a 1-year z-score of +2.4, indicating relative overvaluation. This premium is also among the highest levels reached since inception of the fund in 2001.
CEFConnect
Instead, investors could consider the similar PIMCO CA Municipal Income III (PZC) instead which trades at a much more modest +3.27% premium and a 1-year z-score of -0.56.
YCharts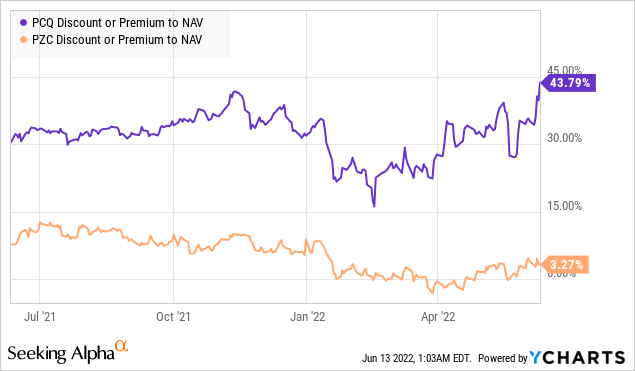
Although both funds have had similar NAV returns over the past several months, PCQ’s price return has outpaced PZC’s significantly due to the former’s expanding premium.
YCharts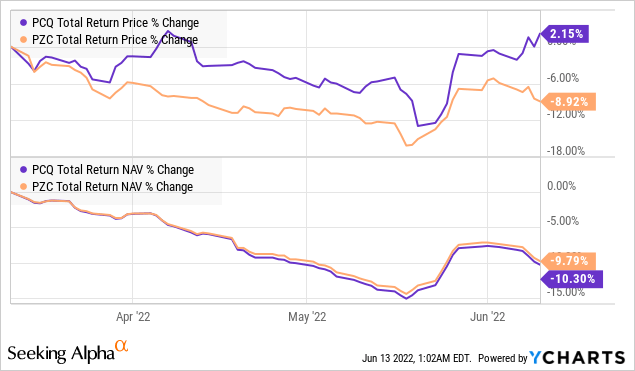
PZC also yields a higher amount (5.35%) than PCQ (4.85%), so investors in PCQ should consider switching to PZC, if taxes are not a consideration.
Another example of an overvalued CEF is Gabelli Convertible & Income Securities (GCV) which gained +6.60% in premium last week, and now sits at a +25.83% premium with a 1-year z-score of +2.4. This premium is also at among its highest levels reaching back over two decades since inception.
CEFConnect
One attractively-valued swap candidate would be Ellsworth Growth and Income Fund (ECF), a holding in our Tactical Income-100 portfolio. Despite slight differences in leverage and composition, the two convertibles-focused funds have had very similar NAV trajectories over the past year. However, GCV’s price performance has greatly exceeded ECF’s due to its expanding premium.
YCharts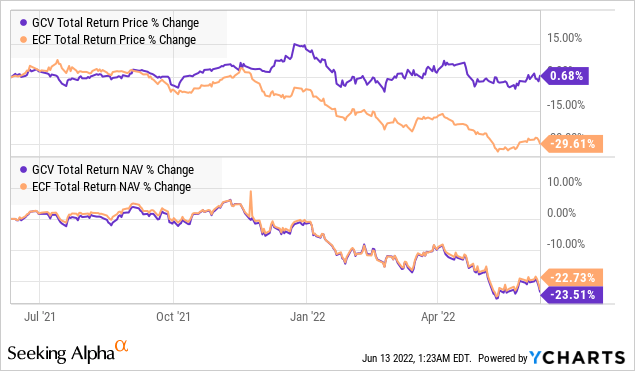
We can clearly see the premium/discount divergence in the chart below.
YCharts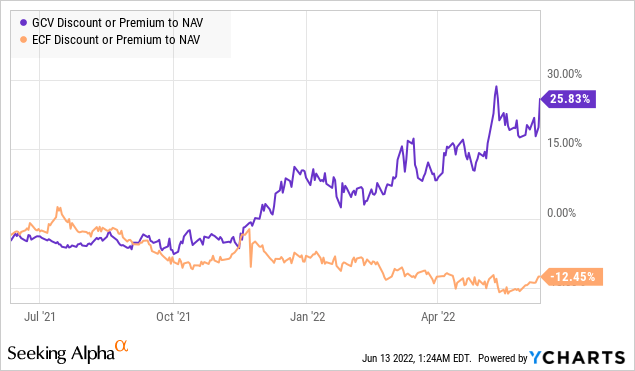
Hence, investors in GCV could consider switching to ECF to take advantage of the valuation differential.
Another way of scanning for overvalued/undervalued CEFs is when I provide members of a screen of the entire CEF universe. This feature appears to be popular members so I can provide periodically, especially after a market sell-off or at request at any time. The latest screen for all CEFs (data from June 10, 2022) is here: Income Lab: CEFs 6/10/2022. Here we can see for example that the Nuveen Real Estate Income Fund (JRS) with its +1.92% premium and +4.1 z-score or the Neuberger Real Estate Securities Income (NRO) with its +4.96% premium and +3.4 z-score could be replaced with a fund like Cohen & Steers REIT and Preferred Income Fund (RNP) at a -5.88% discount and a -1.1 z-score, which is also a holding in our Income Generator portfolio.
YCharts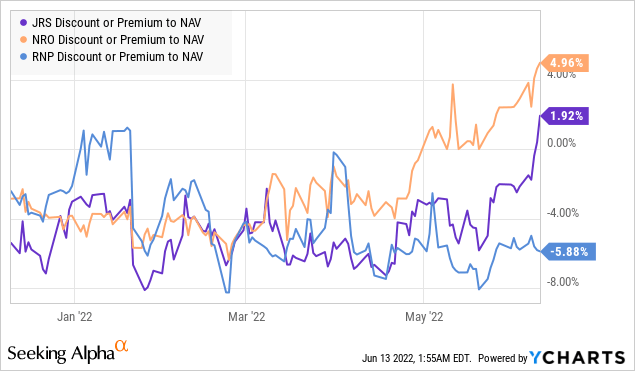
In fact, RNP has had the best NAV performance over the last 6 months (due to its heavier preferred weighting) however its price performance has been the weakest as the other two funds’ premiums expanded.
YCharts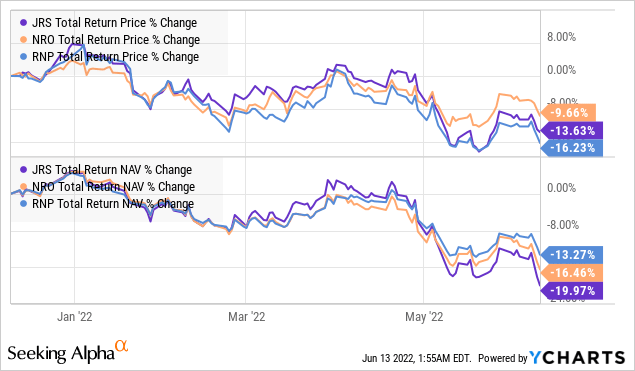
Now, just to be clear, CEF rotation is a very powerful strategy but it’s not guaranteed to work every time and across every time frame. After all, an expensive fund can always get more expensive, while the cheaper fund can get cheaper. Some funds can remain at irrationally high levels of premium for extended periods of time (such as the Gabelli Utility Trust (GUT)!). However, CEF rotation does work a lot more often than not, and so it remains a powerful way to generate alpha for one’s portfolio. Of course, we are constantly monitoring our portfolio positions for swap opportunities as well!
Be the first to comment