

Lemon_tm
Author’s note: This article was released to CEF/ETF Income Laboratory members on October 5, 2022. Please check latest data before investing.
The Weekly Closed-End Fund Roundup will be put out at the start of each week to summarize recent price movements in closed-end fund [CEF] sectors in the last week, as well as to highlight recently concluded or upcoming corporate actions on CEFs, such as tender offers. Data is taken from the close of Friday, September 30th, 2022.
Weekly performance roundup
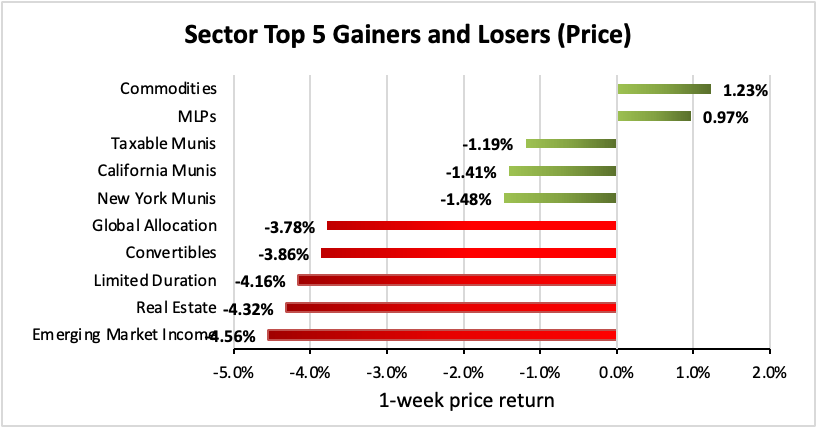
2 out of 23 sectors were positive on price (up from 0 last week) and the average price return was -2.27% (up from -5.77% last week). The lead gainer was Commodities (+1.23%) while Emerging Market Income lagged (-4.56%).
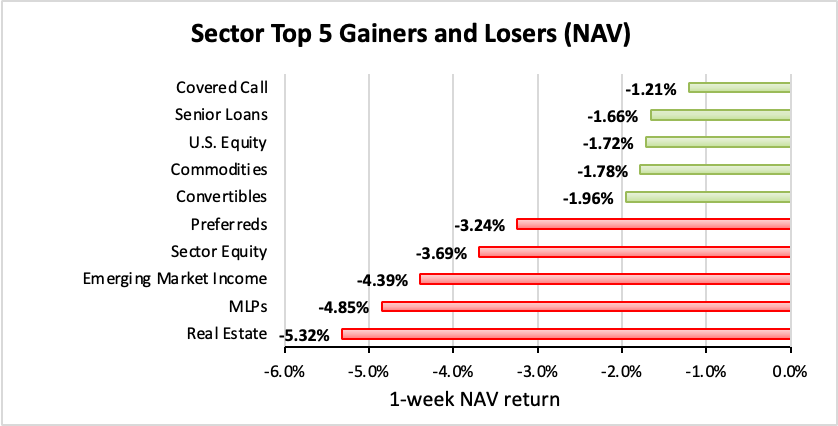
0 out of 23 sectors were positive on NAV (down from 1 last week), while the average NAV return was -2.63% (up from -3.41% last week). The top sector by NAV was Covered Call (-1.21%) while the weakest sector by NAV was Real Estate (-5.32%).
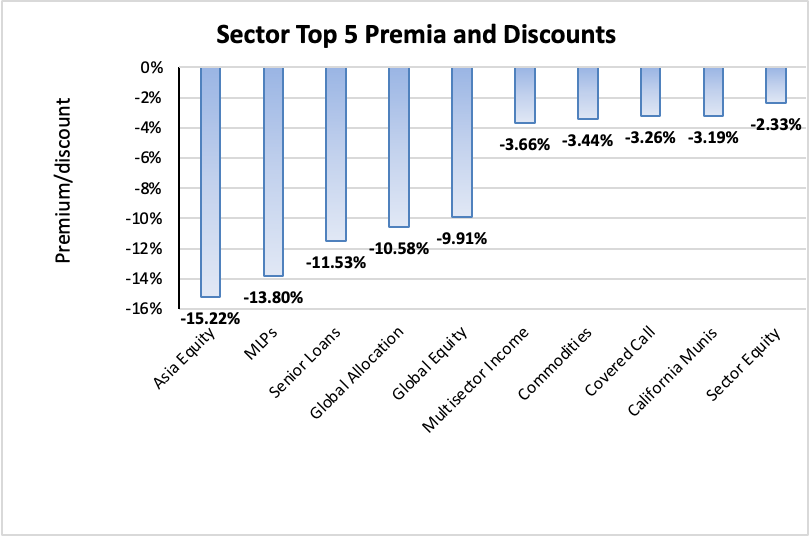
The sector with the highest premium was Sector Equity (-2.33%), while the sector with the widest discount is Asia Equity (-15.22%). The average sector discount is -7.45% (down from -7.14% last week).
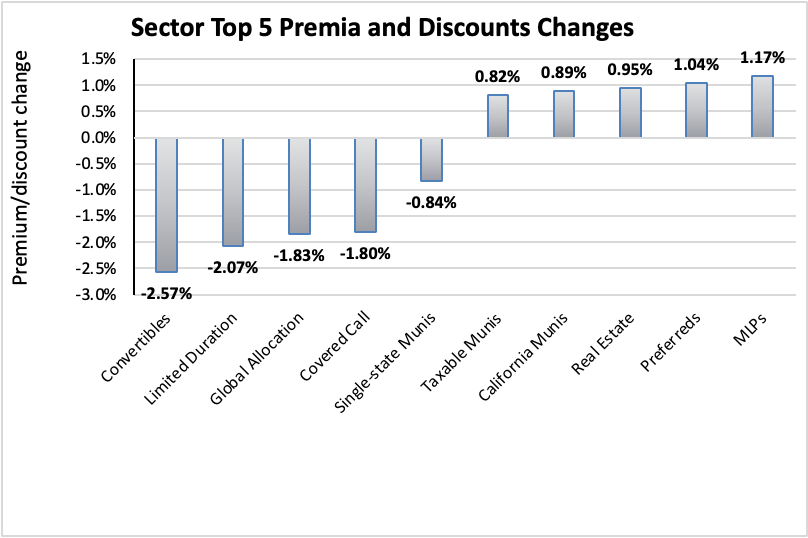
The sector with the highest premium/discount increase was MLPs (+1.17%), while Convertibles (-2.57%) showed the lowest premium/discount decline. The average change in premium/discount was -0.29% (up from -1.85% last week).
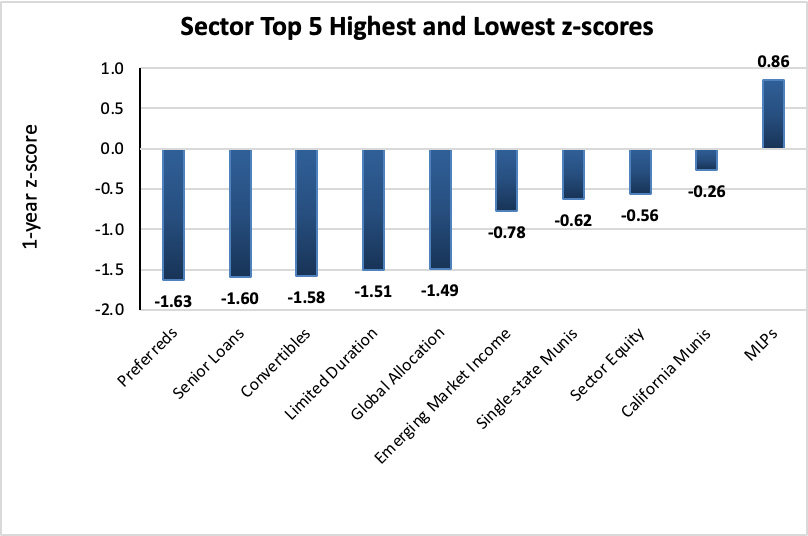
The sector with the highest average 1-year z-score is MLPs (+0.86), while the sector with the lowest average 1-year z-score is Preferreds (-1.63). The average z-score is -1.03 (down from -0.95 last week).
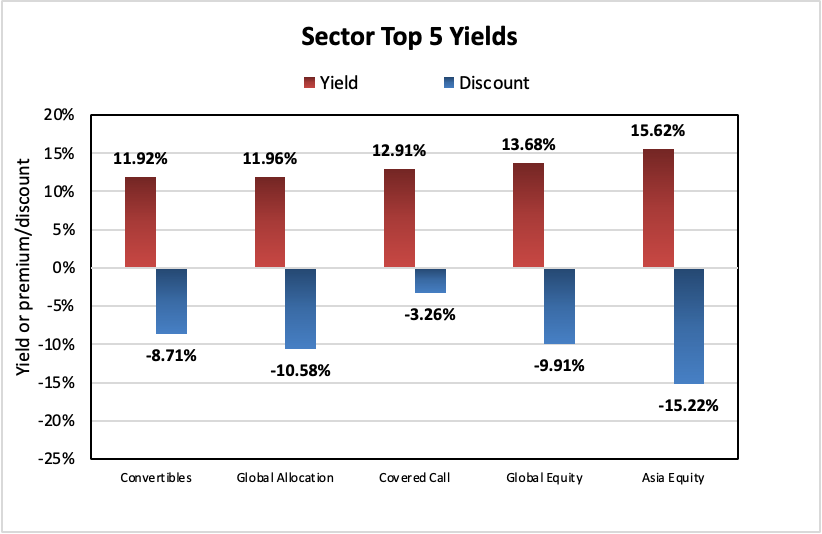
The sectors with the highest yields are Asia Equity (15.62%), Global Equity (13.68%), and Covered Call (12.91%). Discounts are included for comparison. The average sector yield is +9.52% (up from +9.27% last week).
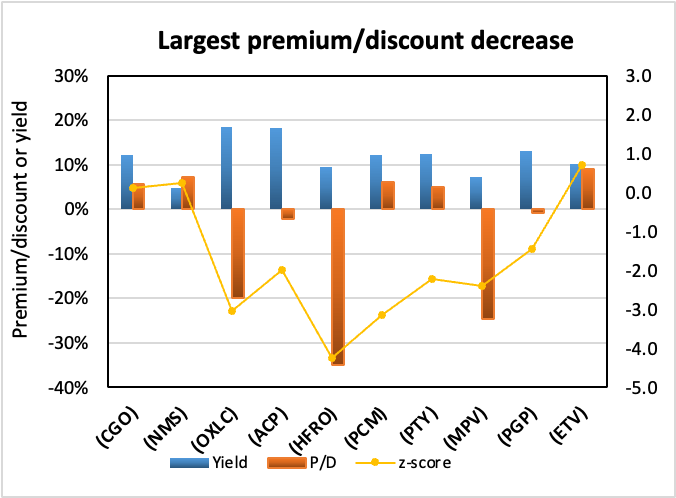
Individual CEFs that have undergone a significant decrease in premium/discount value over the past week, coupled optionally with an increasing NAV trend, a negative z-score, and/or are trading at a discount, are potential buy candidates.
| Fund | Ticker | P/D decrease | Yield | P/D | z-score | Price change | NAV change |
| Calamos Global Total Return | (CGO) | -11.52% | 12.24% | 5.72% | 0.1 | -10.99% | -1.28% |
| Nuveen MN Quality Muni Inc | (NMS) | -9.07% | 4.70% | 7.31% | 0.3 | -10.07% | -2.46% |
| Oxford Lane Capital Corp | (OXLC) | -7.42% | 18.52% | -19.87% | -3.1 | -5.08% | 0.00% |
| abrdn Income Credit Strategies Fund | (ACP) | -7.39% | 18.26% | -2.23% | -2.0 | -10.25% | -3.45% |
| Highland Income Fund | (HFRO) | -7.32% | 9.54% | -34.88% | -4.3 | -11.43% | -1.46% |
| PCM Fund | (PCM) | -7.16% | 12.11% | 6.02% | -3.2 | -7.58% | -2.22% |
| PIMCO Corporate & Income Opportunity Fd | (PTY) | -6.45% | 12.40% | 4.93% | -2.2 | -7.41% | -2.66% |
| Barings Participation Investors | (MPV) | -6.07% | 7.17% | -24.65% | -2.4 | -4.29% | 0.00% |
| PIMCO Global StocksPLUS & Income | (PGP) | -6.05% | 12.98% | -0.78% | -1.4 | -7.67% | -5.72% |
| Eaton Vance Tax-Managed Buy-Write Opp | (ETV) | -5.85% | 10.24% | 8.98% | 0.7 | -6.28% | -1.24% |
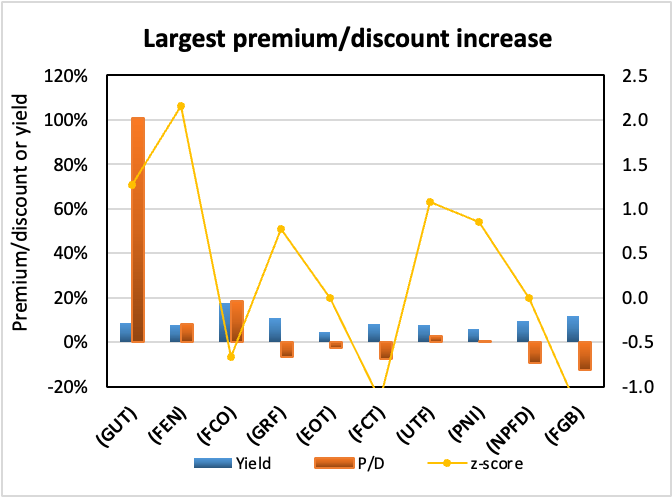
Conversely, individual CEFs that have undergone a significant increase in premium/discount value in the past week, coupled optionally with a decreasing NAV trend, a positive z-score, and/or are trading at a premium, are potential sell candidates.
| Fund | Ticker | P/D increase | Yield | P/D | z-score | Price change | NAV change |
| Gabelli Utility Trust | (GUT) | 17.49% | 8.61% | 100.86% | 1.3 | 3.57% | -5.45% |
| First Trust Energy Income And Growth | (FEN) | 10.46% | 7.79% | 7.99% | 2.2 | 8.83% | -5.56% |
| abrdn Global Income Fund, Inc. | (FCO) | 7.31% | 17.87% | 18.39% | -0.7 | 1.95% | -4.34% |
| Eagle Capital Growth | (GRF) | 7.25% | 11.02% | -6.68% | 0.8 | -4.56% | -2.78% |
| Eaton Vance National Municipal Opprs Tr | (EOT) | 5.39% | 4.44% | -2.65% | 0.0 | 3.75% | -1.98% |
| First Trust Senior FR Inc II | (FCT) | 5.12% | 8.34% | -7.66% | -1.2 | 4.60% | -1.19% |
| Cohen & Steers Infrastructure | (UTF) | 4.97% | 7.88% | 2.92% | 1.1 | 0.55% | -7.95% |
| PIMCO NY Municipal Income II | (PNI) | 4.93% | 6.02% | 0.76% | 0.9 | 1.79% | -3.18% |
| Nuveen Variable Rate Pref & Inc Fund | (NPFD) | 4.89% | 9.64% | -9.37% | 0.0 | 1.87% | -3.61% |
| First Trust Spec Finance & Fincl Opp | (FGB) | 4.58% | 11.70% | -12.42% | -1.3 | -2.08% | -7.20% |
Recent corporate actions
These are from the past month. Any new news in the past week has a bolded date:
September 27, 2022 | RiverNorth/DoubleLine Strategic Opportunity Fund, Inc. Announces Final Results of Rights Offering.
September 26, 2022 | RiverNorth/DoubleLine Strategic Opportunity Fund, Inc. Announces Preliminary Results of Rights Offering.
September 19, 2022 | Virtus Total Return Fund Inc. Completes Rights Offering.
Upcoming corporate actions
These are from the past month. Any new news in the past week has a bolded date:
October 4, 2022 | RiverNorth Opportunities Fund, Inc. Announces Transferable Rights Offering.
October 3, 2022 | Tortoise Announces Tender Offers for its Closed-End Funds.
September 20, 2022 | First Trust/abrdn Emerging Opportunity Fund Announces Approval of Liquidation.
September 8, 2022 | BlackRock Corporate High Yield Fund, Inc. Announces Terms of Rights Offering.
August 11, 2022 | Abrdn’s U.S. Closed-End Funds Announce Special Shareholder Meetings Relating to Proposed Acquisition of Assets of Four Delaware Management Company-Advised Closed-End Funds.
Recent activist or other CEF news
These are from the past month. Any new news in the past week has a bolded date:
October 3, 2022 | Virtus Convertible & Income Fund II Postpones Monthly Distribution on Common Shares.
————————————
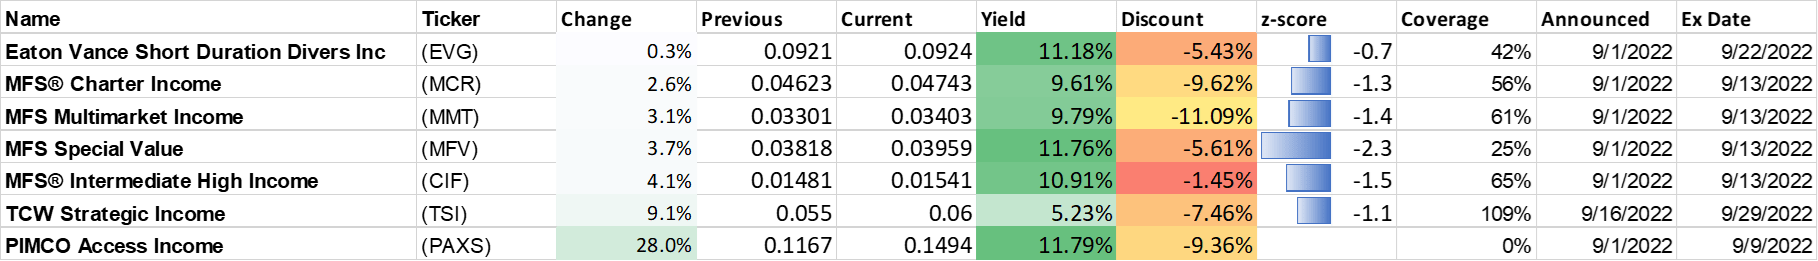
Distribution changes announced this month
These are sorted in ascending order of distribution change percentage. Funds with distribution changes announced this month are included. Any distribution declarations made this week are in bold. I’ve also added monthly/quarterly information as well as yield, coverage (after the boost/cut), discount and 1-year z-score information. I’ve separated the funds into two sub-categories, cutters and boosters.
Cutters

Boosters
Commentary
1. Tortoise tender offers
The tender offers for the Tortoise midstream/infrastructure funds (TYG) (NTG) (TTP) (NDP) (TPZ) have been announced. These are tender offers that have been proactively instituted by management as part of a discount management program, rather than something that the managers were strong-armed into as a reaction to activist pressure.
The reason that tender offers are beneficial to investors is because they allow cashing out of a CEF close to NAV. With all of these midstream/infrastructure funds trading at deep discounts, this represents an instant profit on part of one’s holdings. Moreover, since the shares are being repurchased at a slight discount to NAV, there is a small accretive effect to the NAV/share as well.
On the flip side, the reason that CEF managers typically don’t willingly conduct tender offers is because they reduce AUM and hence fee income. Thus, the fact that Tortoise is conducting these offers voluntarily is a sign of management alignment with shareholders, in my opinion.
We own TYG in our Tactical Income-100 portfolio, and intend to fully tender our shares. The tender offers are for 5% of outstanding shares at 98% of NAV. If more than 5% of shareholders tender their shares, the proportion of shares accepted will be pro-rated. This means that if one elects to tender all of their shares, a minimum of 5% of shares will be accepted, but possibly more depending on how many other shareholders tender. For example, if 50% of shareholders tender, then 10% of an investor’s shares will be accepted for repurchase.
The offers will expire on November 1, 2022. Our recommendation for anyone holding any of the Tortoise funds is to tender all of your shares. Remember to inform your broker of your decision to tender (preferably a few days in advance of the expiry date as some brokers may have earlier internal deadlines), as the default action is to not tender.
Moreover, in the unlikely event that TYG or the other CEFs trade higher than a -2% discount (i.e., narrower than a -2% discount or at a premium), then one should not tender as you would get a better price by selling on the open market.
Nick previously discussed the TYG tender offer more conclusively here: TYG: Tender Offer Triggered Worth Playing For Shareholders (Portfolio Holding) (public link).
Note to public readers: commentary on NCZ distribution postponement and RIV rights offering were posted in separate articles.
Strategy Statement
Our goal at the CEF/ETF Income Laboratory is to provide consistent income with enhanced total returns. We achieve this by:
- (1) Identifying the most profitable CEF and ETF opportunities.
- (2) Avoiding mismanaged or overpriced funds that can sink your portfolio.
- (3) Employing our unique CEF rotation strategy to “double compound“ your income.
It’s the combination of these factors that has allowed our Income Generator portfolio to massively outperform our fund-of-CEFs benchmark ETF (YYY) whilst providing growing income, too (approx. 10% CAGR).
Income Lab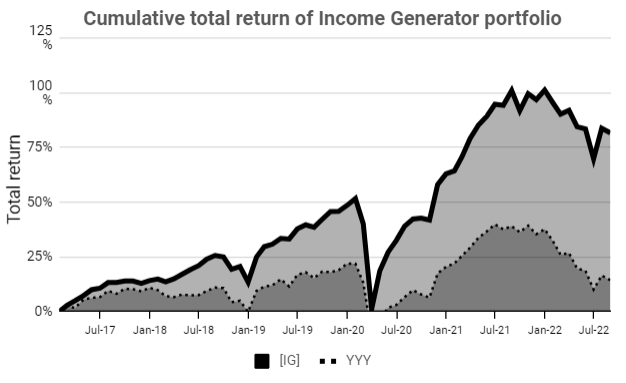
Remember, it’s really easy to put together a high-yielding CEF portfolio, but to do so profitably is another matter!
Be the first to comment