

DieterMeyrl/E+ via Getty Images
Introduction
The Weekly Breakout Forecast continues my doctoral research analysis on MDA breakout selections over more than 7 years. This subset of the different portfolios I regularly analyze has now exceeded 250 weeks of public selections as part of this ongoing live forward-testing research. The frequency of 10%+ returns in a week is averaging over 4x the broad market averages over the past 5+ years.
In 2017, the sample size began with 12 stocks, then 8 stocks in 2018, and at members’ request since 2020, I now generate only 4 selections each week. In addition 2 Dow 30 picks are provided, as well as a new active ETF portfolio that competes against a signal ETF model. Monthly Growth & Dividend MDA breakout stocks continue to beat the market each year as well. I offer 11 top models of short and long term value and momentum portfolios that have beaten the S&P 500 since my trading studies were made public:
The cumulative average weekly breakout returns for 2022 is up to +80.9% not using the gauge signal. Officially, for trading signals, we have had only 2 weeks of a positive signals in 2022 with the worst 5 month start to the stock market since 1973. We are in unusual markets ahead of QT in June: “A good review of bear market bounces $SPY #SPX 2022 / 2008 overlay as #QT begins. Watch for strong confirmation of negative channel breakouts. Not all bounces are a bottom.”
In a quick study of the MDA breakout selections YTD, there are 64 picks in 23 weeks (69.5%) beating the S&P 500. 51 picks (55.4%) are beating the S&P 500 by over 10% and as high as +93.4% (RES), +125.6% (TDW), +46.6% (MNRL), +57.7% (ESTE), +45.4% (TMST), +37.5% (EGY) and +45.2% (CIVI) significantly beating the major indices YTD.
VMbreakouts.com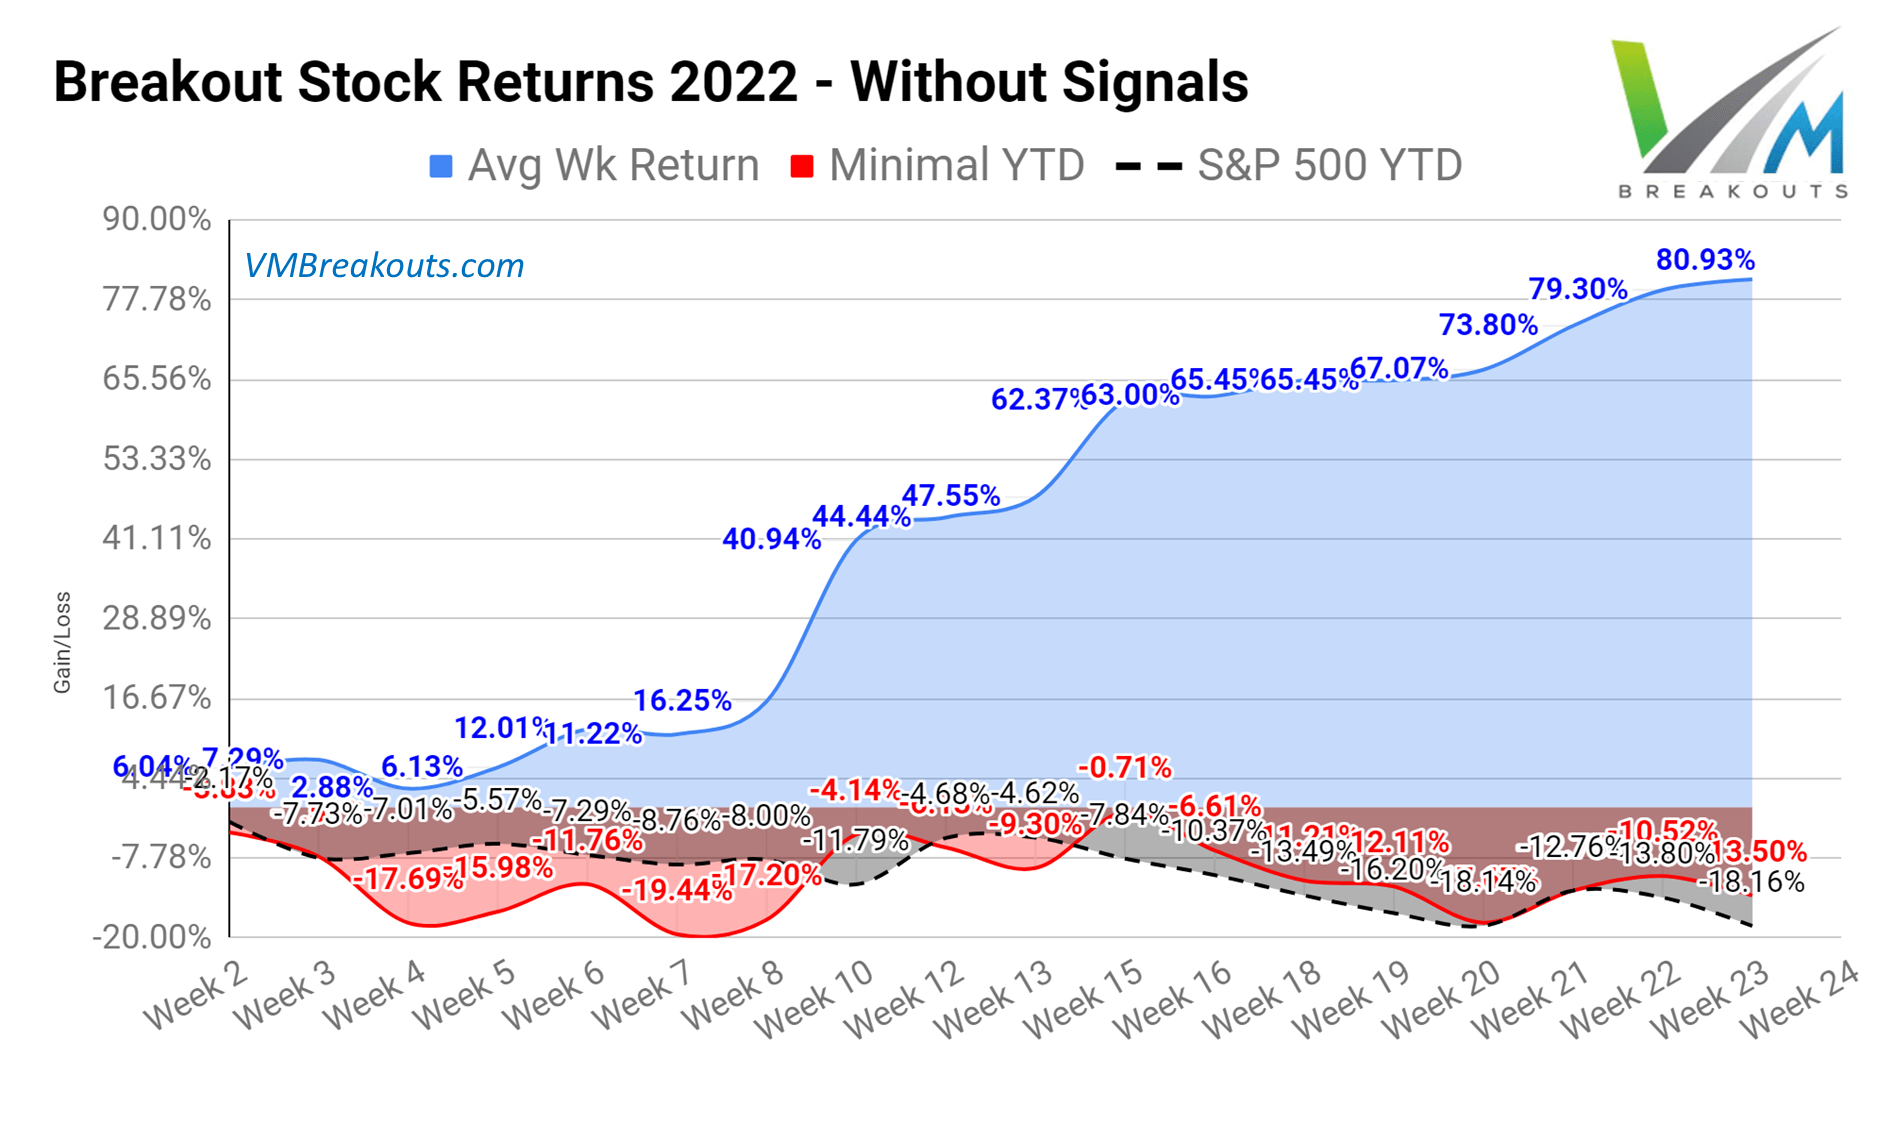
Additional background, measurements, and high frequency breakout records on the Weekly MDA Breakout model is here: Value And Momentum MDA Breakouts +70.5% In 52 Weeks: Final 2021 Year End Report Card.
Returns from 21 Weeks of Positive Momentum Gauge signals in 2021
Last year there were only 21 positive trading weeks to achieve +70.5% returns. For 2022 the market has been even worse with only two official positive weekly signal on the Momentum Gauges® so far despite strong returns in many negative market weeks.
VMbreakouts.com
Momentum Gauge® trading signal: Negative conditions ahead of Week 24
Weekly return measurements into the 2nd quarter of 2022.
VMbreakouts.com
Red weekly color indicates negative Market Momentum Gauge signals. MDA breakout selections outperform when the market signal is positive and daily negative values are below 40 level.
Historical Performance Measurements
Historical MDA Breakout minimal buy/hold returns are at +70.5% YTD when trading only in the positive weeks consistent with the positive Momentum Gauges® signals. Remarkably, the frequency streak of 10% gainers within a 4- or 5-day trading week continues at highly statistically significant levels above 80% not counting frequent multiple 10%+ gainers in a single week.
Longer term many of these selections join the V&M Multibagger list now at 104 weekly picks with over 100%+ gains, 46 picks over 200%+, 20 picks over 500%+ and 12 picks with over 1000%+ gains since January 2019 such as:
- Intrepid Potash (IPI) +1,578.8%
- Houghton Mifflin Harcourt Company (HMHC) +1,413.8%
- Enphase Energy (ENPH) +1,318.6%
- Northern Oil and Gas (NOG) +1,286.5%
- Celsius Holdings (CELH) +1,208.7%
- Trillium Therapeutics (TRIL) +1008.7%
More than 200 stocks have gained over 10% in a 5-day trading week since this MDA testing began in 2017. A frequency comparison chart is at the end of this article. Readers are cautioned that these are highly volatile stocks that may not be appropriate for achieving your long term investment goals: How to Achieve Optimal Asset Allocation
2022 Breakout Portfolio Returns
The Momentum Gauge® conditions continue with highly negative warning signals with only two full weeks of positive conditions back in Week 12 and 22 of 2022 with returns of +1.19% following the signals and avoiding the worst 5 month market start since 1973.
The Breakout Picks are high volatility selections for high short-term gains, but with no selections below $2/share, under 100k average daily volume, or less than $100 million market cap. Prior returns are documented here:
2022 marks the worst 100 day start to the stock market since 1939 and the Momentum Gauge® MDA buy signals have turned positive ahead of next week.
VMbreakouts.com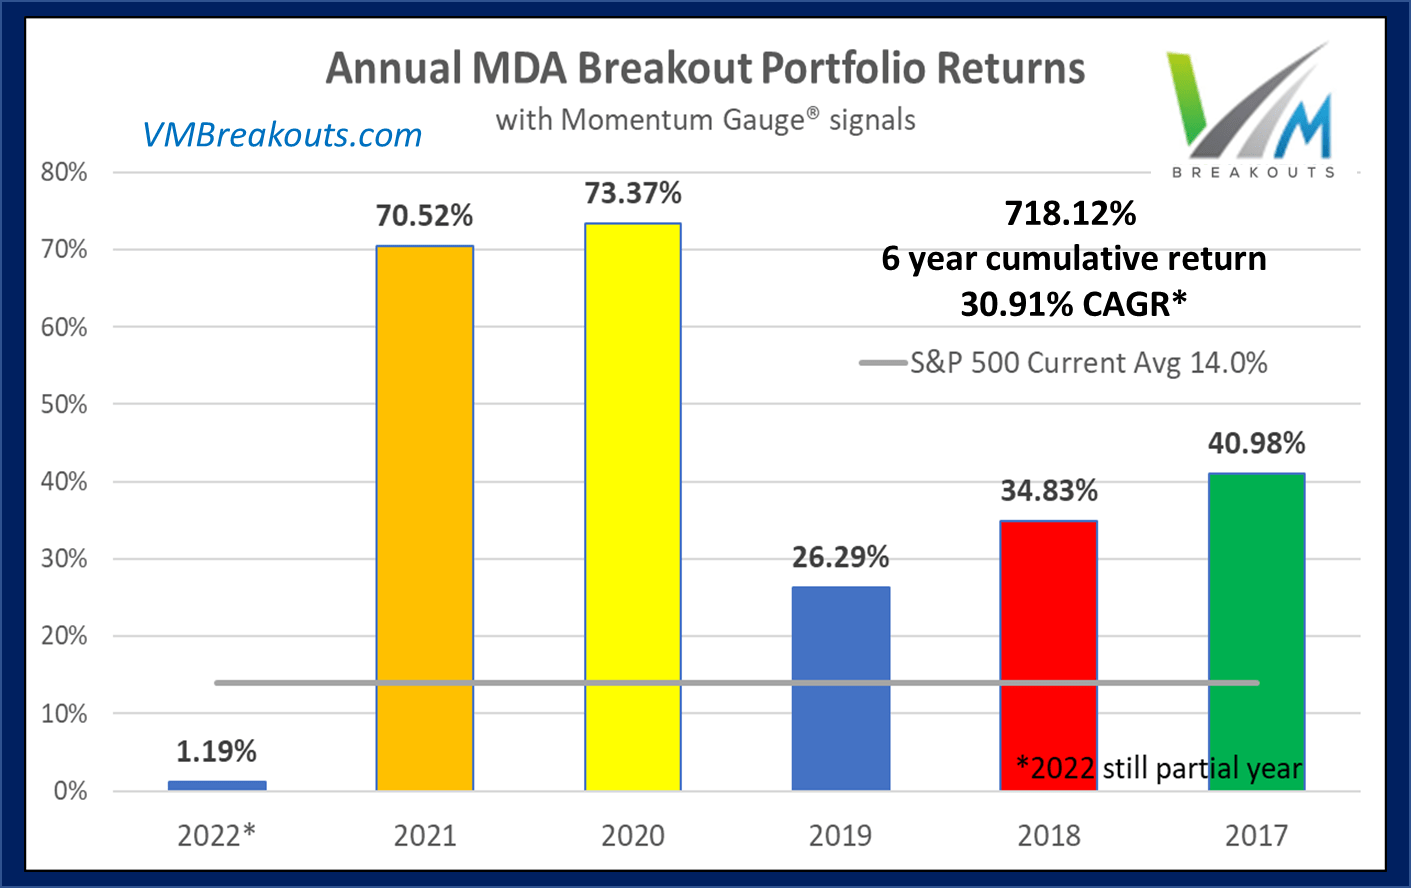
Market Momentum Conditions
Why not avoid all the major market downturns? It is best to follow the signals as the Federal Reserve’s Quantitative Tightening program is scheduled to begin in June: How Markets May React To Fed’s QT Program.
The Market Momentum Gauges® based on 7,500+ stocks turned negative this week at Negative 82 and Positive 37. So far in 2022 the positive conditions have lasted only 2.77 days on average. Negative conditions have lasted 11.14 days on average.
The S&P 500 gauges turned negative this week at Negative 35 and Positive 12. The S&P 500 has been the most resilient of the major indices but continues down -18.16% YTD in the worst 100 days start to the year since 1939 and the worst 5 month start since 1973.
app.VMbreakouts.com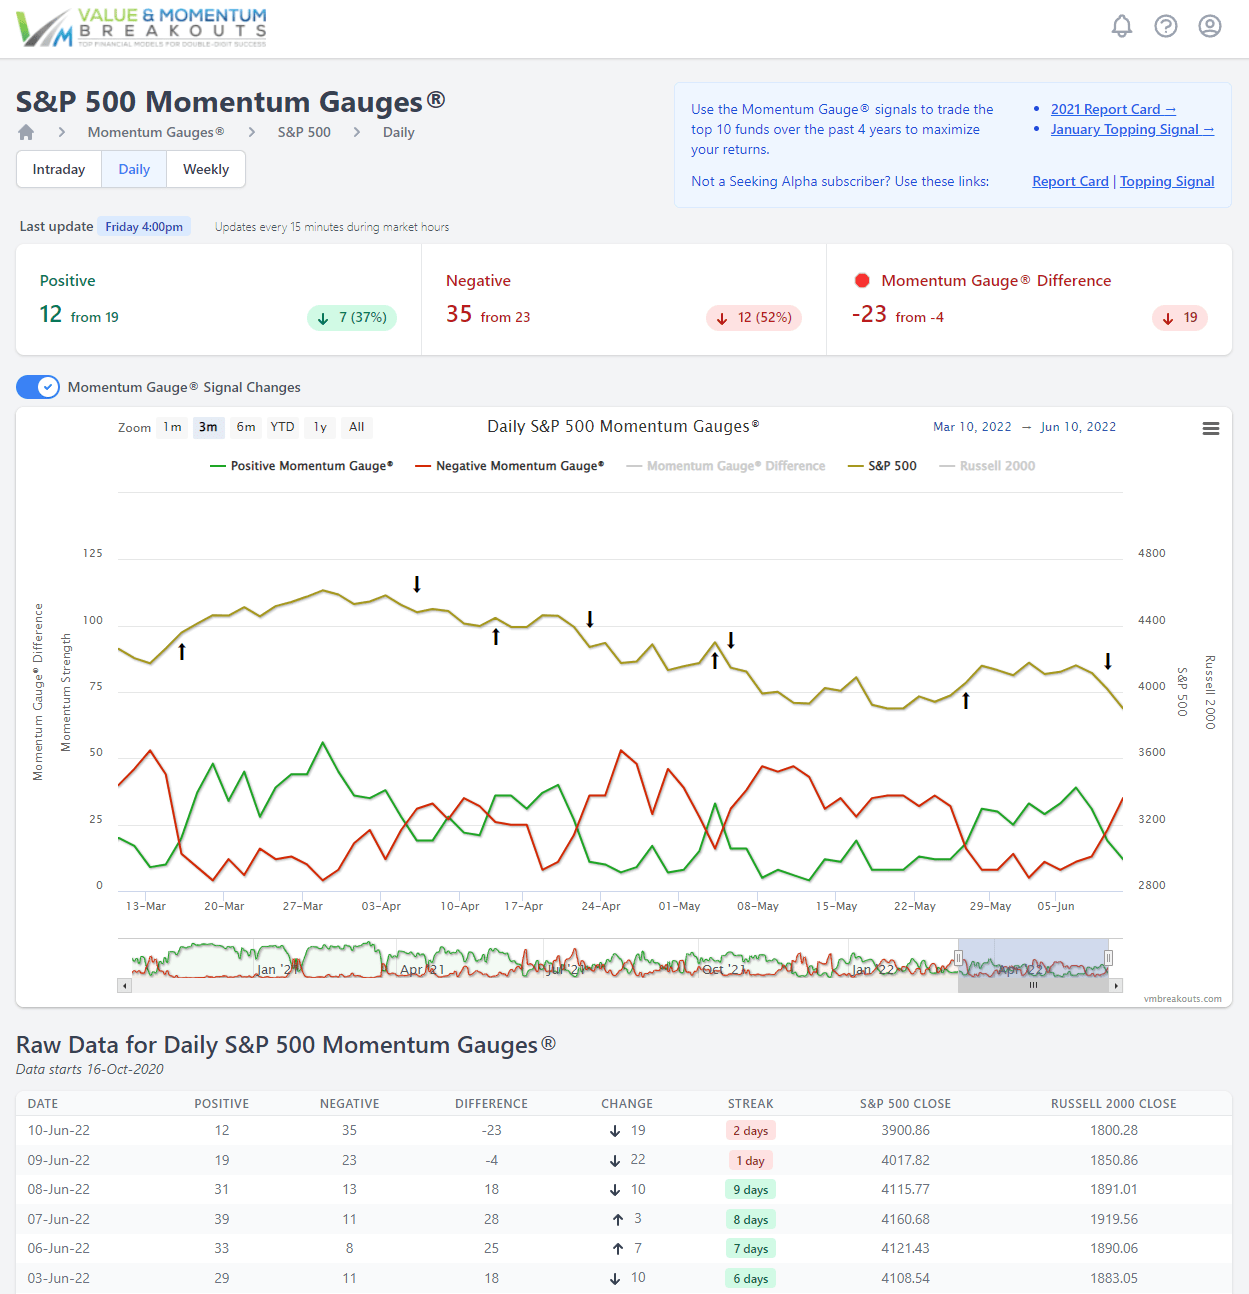
The Weekly Momentum Gauges® are poised to turn negative next week after another 2 consecutive weeks positive. All the prior positive weekly signals since November have not lasted more than 2 weeks. There have only been 5 weeks positive in the past 30 weeks since November avoiding record market declines. The 2-year weekly chart below includes the 2020 Covid Correction.
app.VMbreakouts.com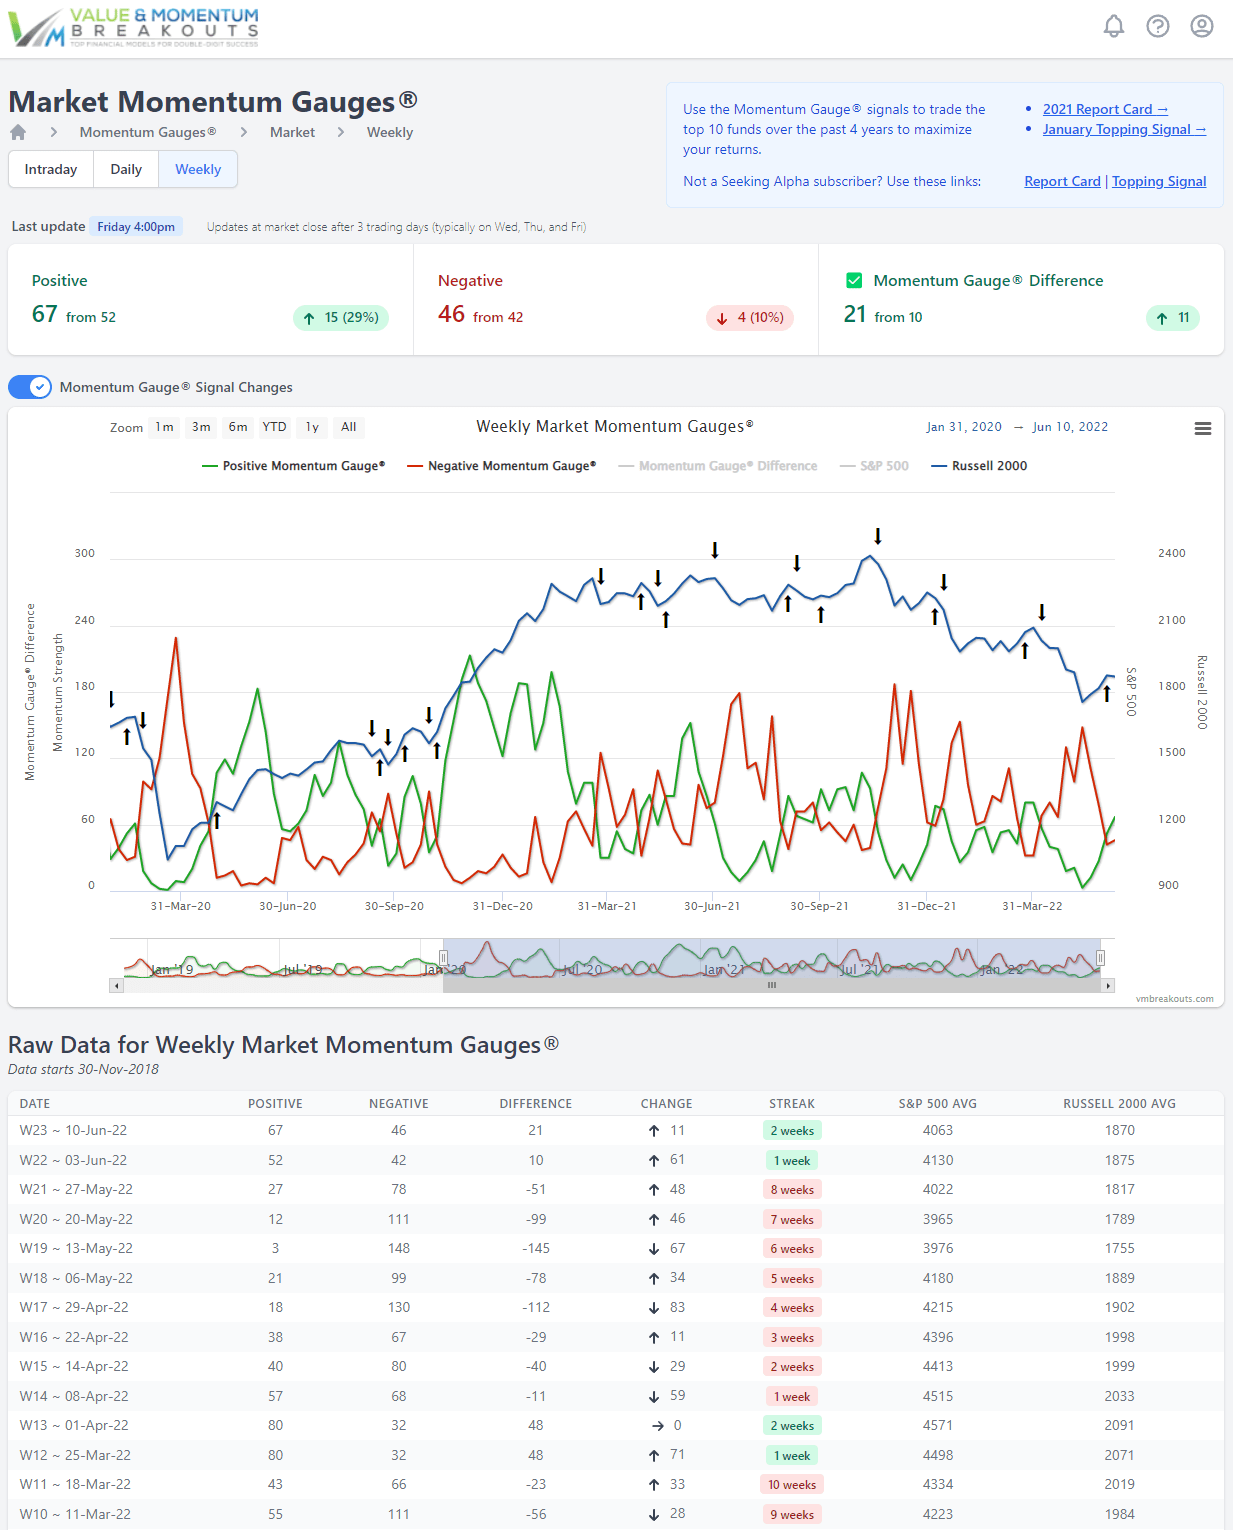
Two conditional signals that are very important to watch:
- Avoid/Minimize trading when the Negative score is higher than the Positive momentum score.
- Avoid/Minimize trading when the Negative score is above 40 on the gauge.
VMbreakouts.com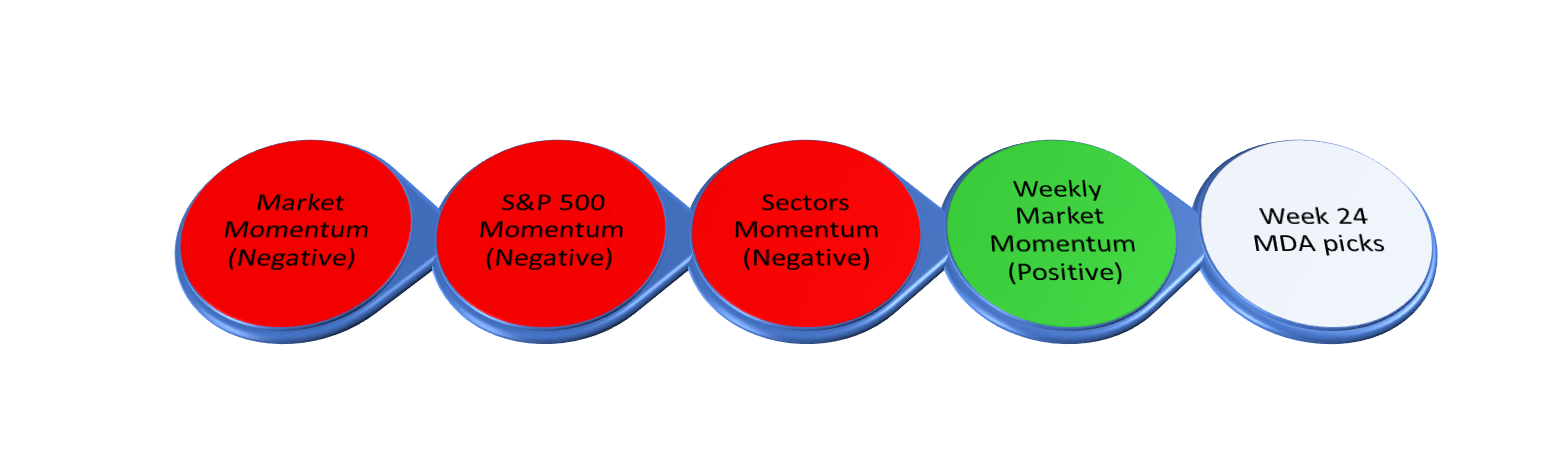
All the daily signals have turned negative through the last week and the Weekly Market Gauge is poised to turn negative next week on declining momentum conditions.
The Week 24 – 2022 Breakout Stocks for next week are:
The picks for next week consist of 1 Energy, 1 Consumer Defensive, 1 Industrials and 1 Healthcare sector stocks. These stocks are released to members in advance every Friday morning near the open. Prior selections may be doing well, but for research purposes I deliberately do not duplicate selections from the prior week. These selections are based on MDA characteristics from my research, including strong money flows, positive sentiment, and strong fundamentals — but readers are cautioned to follow the Momentum Gauges® for the best results.
RLX Technology (RLX) – Consumer Defensive / Tobacco
FinViz.com
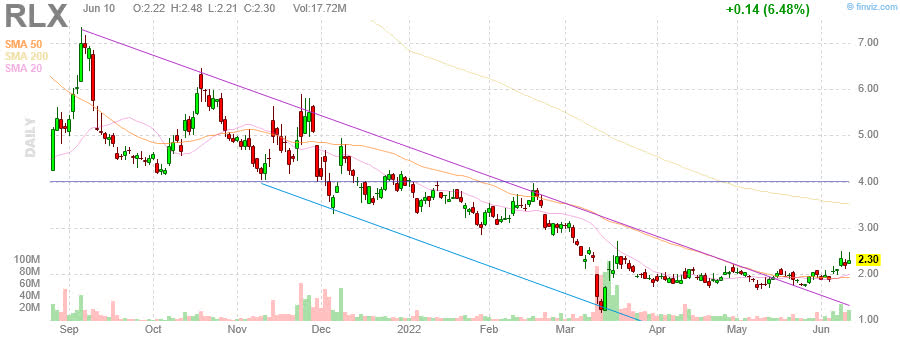
Price Target: $3.00/share (See my FAQ #20 on price targets)
RLX Technology Inc., together with its subsidiaries, researchers, develops, manufactures, distributes, and sells e-vapor products in the People’s Republic of China. It serves RELX branded partner stores and other retail outlets through distributors.
StockRover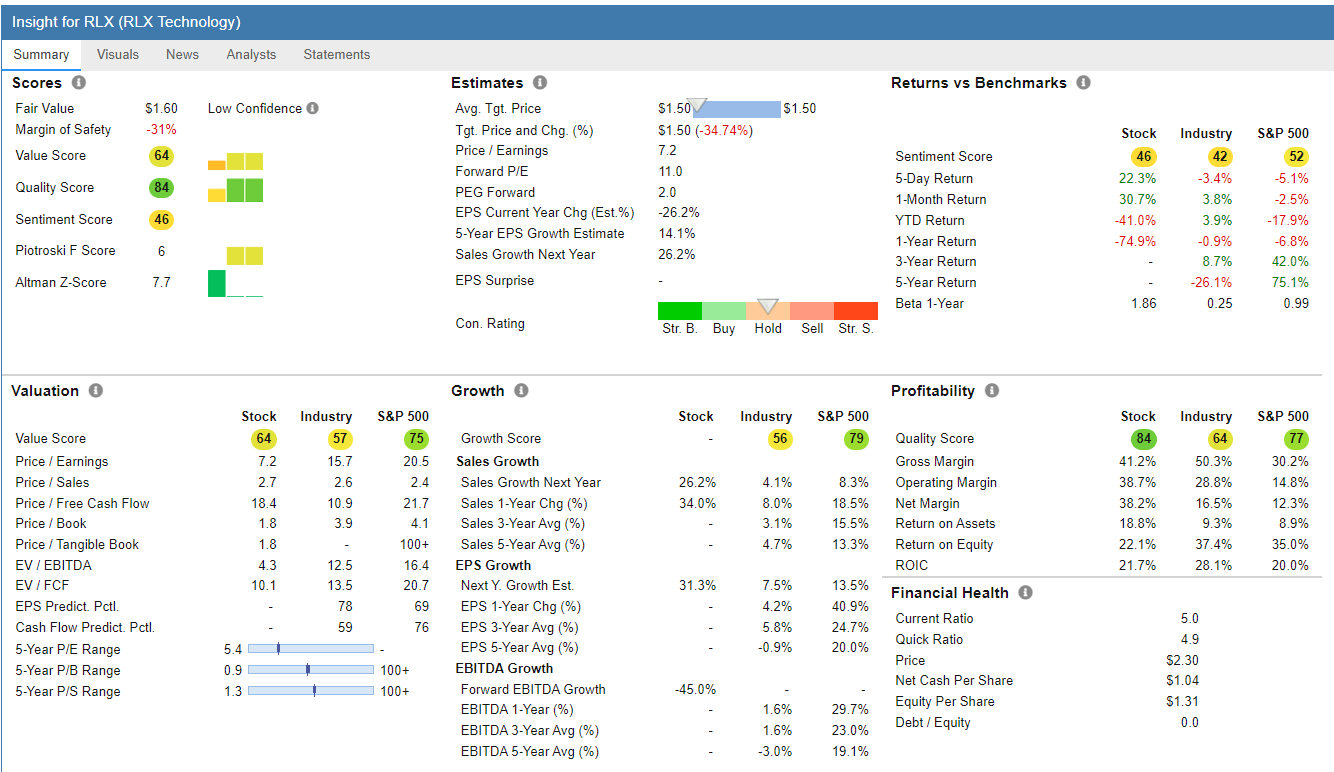
Zynex (ZYXI) – Healthcare / Medical Devices
FinViz.com
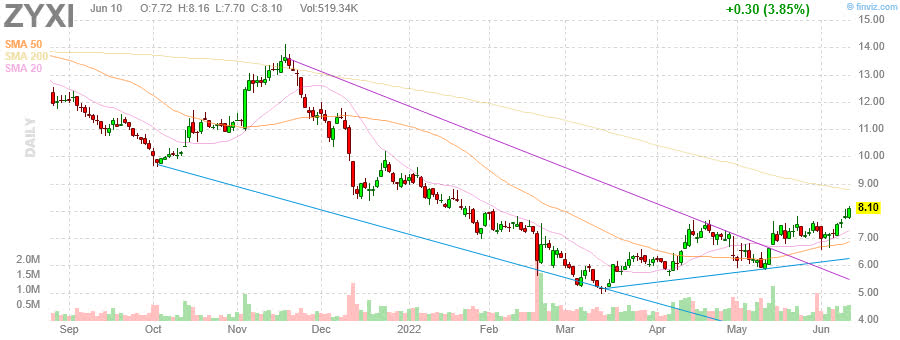
Price Target: $10.00/share (See my FAQ #20 on price targets)
Zynex, Inc., through its subsidiaries, designs, manufactures, and markets medical devices to treat chronic and acute pain; and activate and exercise muscles for rehabilitative purposes with electrical stimulation. The company offers NexWave, a dual channel, multi-modality interferential current, transcutaneous electrical nerve stimulation, and neuromuscular electrical stimulation (NMES) device that is marketed to physicians and therapists by field sales representatives; NeuroMove, an electromyography triggered electrical stimulation device; InWave, an electrical stimulation product for the treatment of female urinary incontinence; and E-Wave, an NMES device.
StockRover.com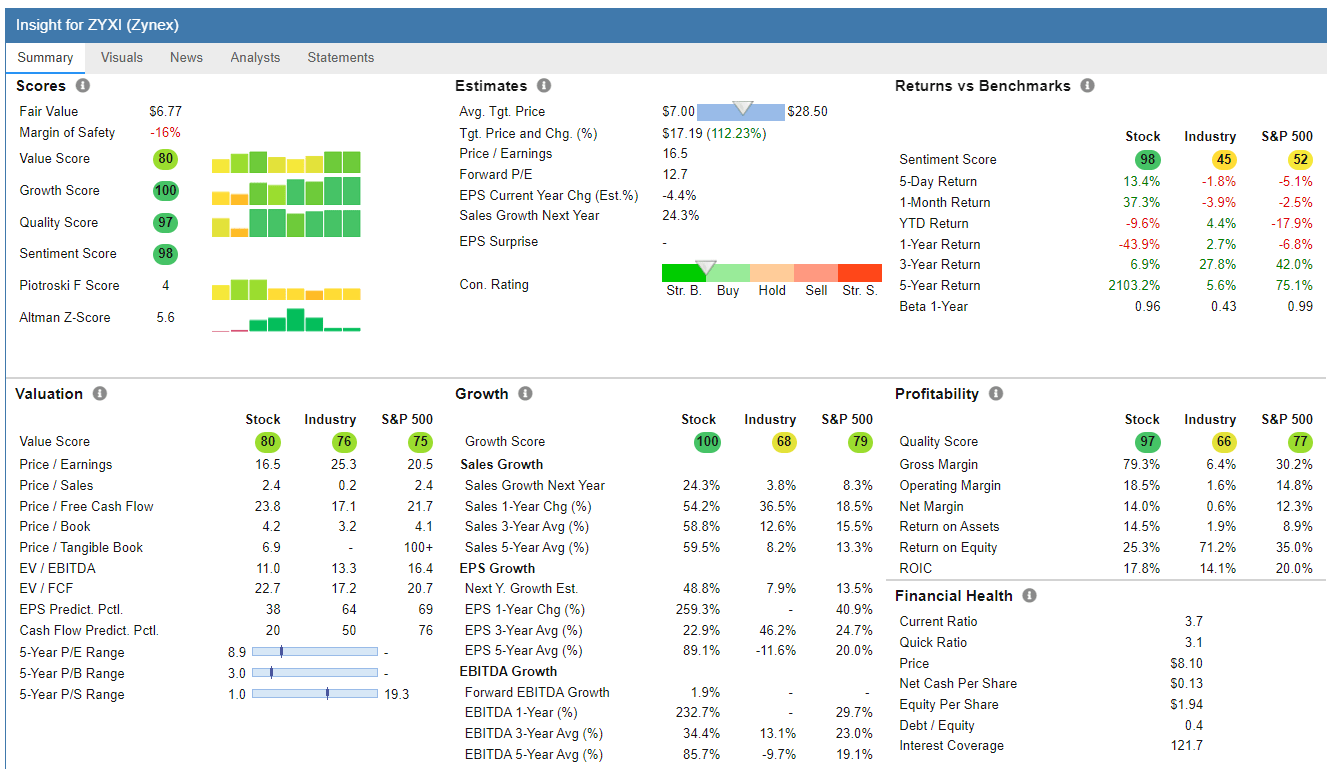
Top Dow 30 Stocks to Watch for Week 24
First, be sure to follow the Momentum Gauges® when applying the same MDA breakout model parameters to only 30 stocks on the Dow Index. No Dow stocks were positive at selection on Friday as market conditions deteriorate with the Dow down another -4.58% this week. Second, these selections are made without regard to market cap or the below-average volatility typical of mega-cap stocks that may produce good results relative to other Dow 30 stocks.
The most recent picks of weekly Dow selections in pairs for the last 5 weeks:
| Symbol | Company | Current % return from selection Week |
| CVX | Chevron Corp. | -1.24% |
| (IBM) | Intl Busines Machines | -4.01% |
| (V) | Visa | -5.12% |
| (AXP) | American Express | -7.67% |
| (AMGN) | Amgen Inc. | -3.03% |
| (VZ) | Verizon | -5.12% |
| (MCD) | McDonald’s Corp | +0.83% |
| (MRK) | Merck & Co. | -2.97% |
| (CVX) | Chevron Corp. | +5.08% |
| MRK | Merck & Co. | -0.89% |
If you are looking for a much broader selection of mega-cap breakout stocks beyond just 30 Dow stocks with more detailed analysis and strong returns I would recommend the Growth & Dividend MDA Breakout picks.
These selections are significantly outperforming major Hedge Funds and all the hedge fund averages since inception. Consider the actively managed ARK Innovation fund down -57.60% YTD and more hedge funds liquidating in 2022.
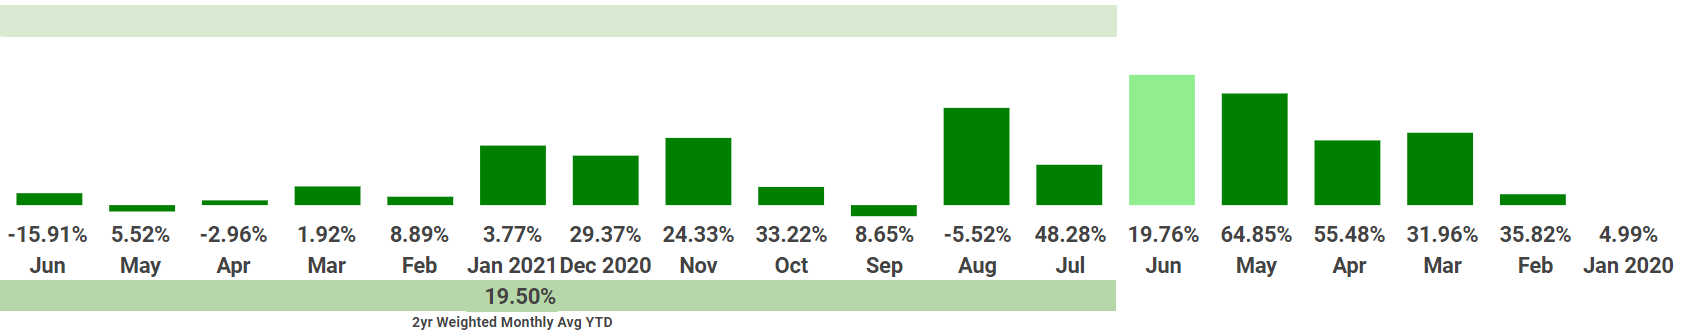
These picks are released monthly for long term total return with strong returns that are leading the S&P 500 by +14.71% through 2022. As members know all the portfolio returns are substantially improved by following the Momentum Gauges® signal. All of the 1 and 2-year returns of monthly portfolios are beating the major market indices YTD are shown below — without including additional returns from large dividends over +2% for each stock:
VMbreakouts.com VMbreakouts.com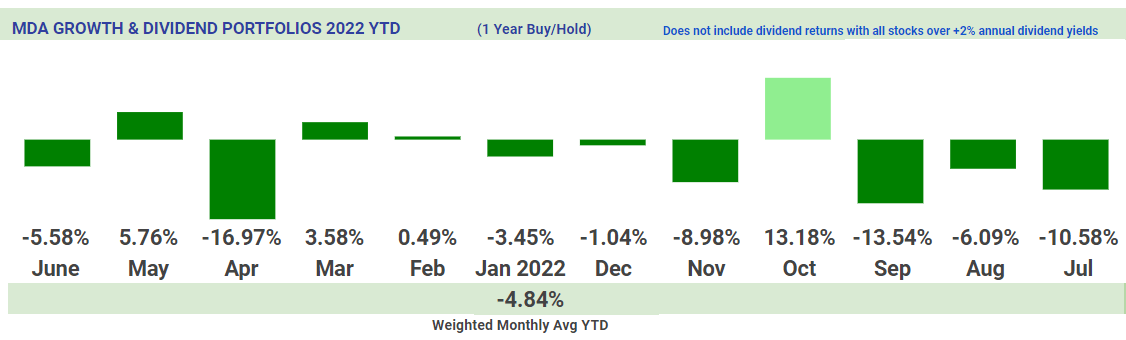
The Dow pick for next week is:
Verizon (VZ)
Verizon is a prior pick up +3.63% from selection in May. All the indicators remain positive with price above the positive channel with strong net inflows since May. Broader market conditions ahead of the Fed’s QT may continue to drive outflows but Verizon is one of the stronger Dow stocks with one of the highest dividend yields at 5.04% as investors look for safety.
FinViz.com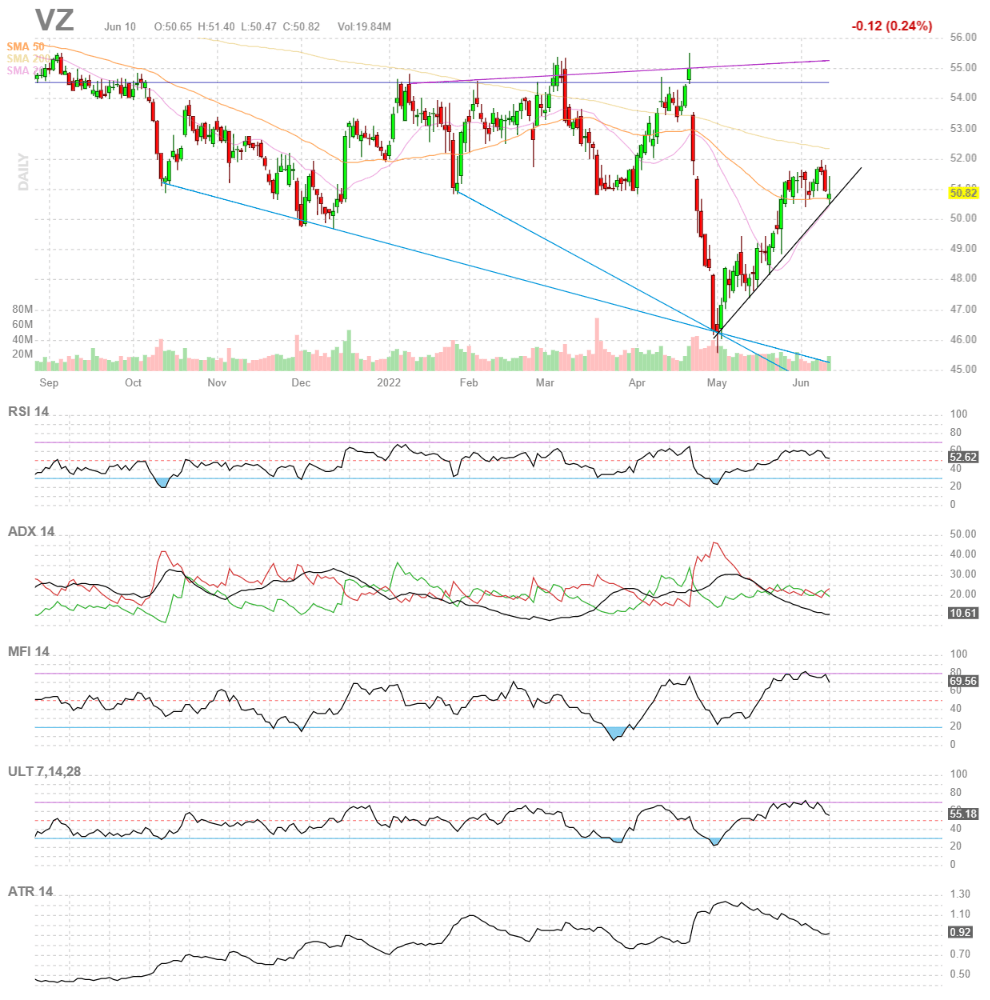
Background on Momentum Breakout Stocks
As I have documented before from my research over the years, these MDA breakout picks were designed as high frequency gainers.
These documented high frequency gains in less than a week continue into 2020 at rates more than four times higher than the average stock market returns against comparable stocks with a minimum $2/share and $100 million market cap. The enhanced gains from further MDA research in 2020 are both larger and more frequent than in previous years in every category. ~ The 2020 MDA Breakout Report Card
The frequency percentages remain very similar to returns documented here on Seeking Alpha since 2017 and at rates that greatly exceed the gains of market returns by 2x and as much as 5x in the case of 5% gains.
VMbreakouts.com
The 2021 and 2020 breakout percentages with 4 stocks selected each week.
VMbreakouts.com
MDA selections are restricted to stocks above $2/share, $100M market cap, and greater than 100k avg daily volume. Penny stocks well below these minimum levels have been shown to benefit greatly from the model but introduce much more risk and may be distorted by inflows from readers selecting the same micro-cap stocks.
Conclusion
These stocks continue the live forward-testing of the breakout selection algorithms from my doctoral research with continuous enhancements over prior years. These Weekly Breakout picks consist of the shortest duration picks of seven quantitative models I publish from top financial research that also include one-year buy/hold value stocks. Remember to follow the Momentum Gauges® in your investing decisions for the best results.
All the V&M portfolio models are beating the market indices in the worst 100 day start to the US stock market since 1939 and the worst 5 month start since 1973. The new active ETF portfolio is up +24.96% YTD beating the S&P 500 by over +43.1% YTD. The value portfolios of Piotroski-Graham picks are up +3.66%. The Top ETF returns in the last Momentum Gauge® signal were as high +33% and the positive signal has just changed back to bear funds.
VMbreakouts.com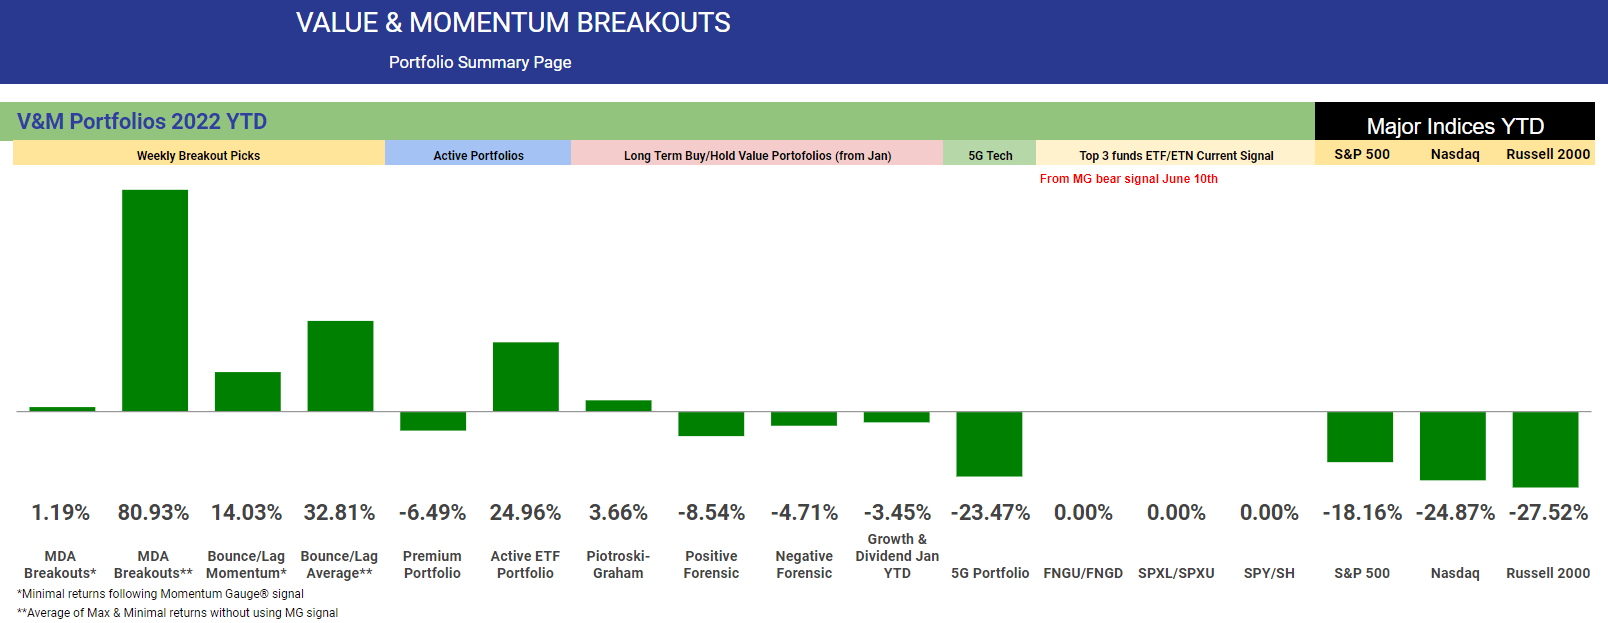
The final 2021 returns for the different portfolio models from January of last year are shown below.
VMbreakouts.com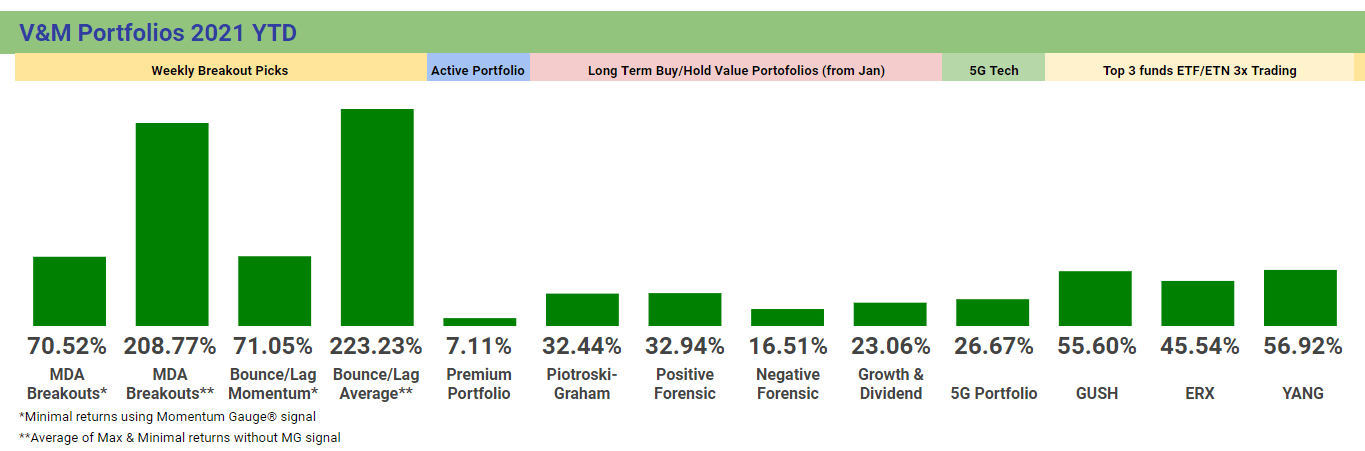
All the very best to you, stay safe and healthy and have a great week of trading!
JD Henning, PhD, MBA, CFE, CAMS
Be the first to comment