

gk-6mt
I know Boeing (NYSE:BA) shares have experienced a nice pop in late 2022, and Wall Street optimism is flying higher on the company’s future. Passenger airline traffic numbers have beaten on the upside this year, and Boeing manufacturing issues have eased a bit. Hopes are growing 737 Max development problems are being fixed, and total sales will zigzag in the right direction following the COVID-19 pandemic-related decimation in new plane demand.
The bad news is another round of plane order cancellations and evaporation in demand for Boeing products could be on the immediate horizon. Coming at exactly the wrong time for this corporation, a negative tangible book value and extremely overleveraged balance sheet, with no free cash flow or operating income, at a time of rising labor wages and interest expense could spell real trouble for underlying business worth soon.
Why should you be worried about recession? #1, because the Treasury yield-curve inversion of late 2022 has a nearly perfect track record forecasting recession within 12 months. #2, because Boeing has a history of truly rotten investor performance during recession. #3, because Boeing is in its worst financial shape in decades, meaning any unexpected downturn in orders could dramatically damage the stock quote.
My view is the approaching recession data should not be ignored. In the end, a major step lower in Boeing’s fortunes next year should be sold and avoided in December 2022 by forward looking investors. My concern is a recession could easily cause operating losses for several more years, and encourage investors to sell shares back to a recession valuation level.
Rising Odds of 2023 Recession
I have written a number of articles since August, discussing past instances of Treasury yield-curve inversions creating future pain for the economy. Today’s inversion could be a reason for bullishness on long bonds here, while projecting a lower Dow Jones Industrial Average in early 2023 and S&P 500 Index over time here.
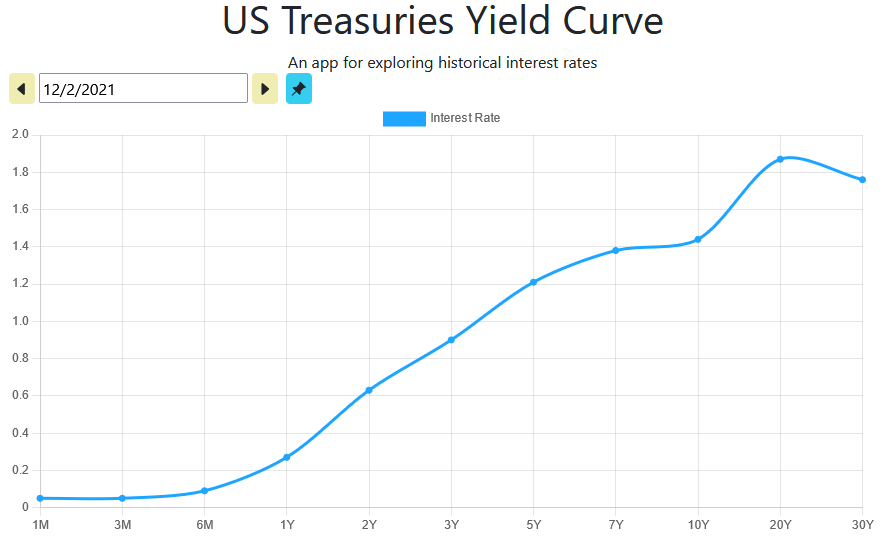
Occasionally, real GDP output declines immediately. At other times, high short-term interest rates grind the expansion into submission over 6-12 months. However, based on my experience in trading recessions since the 1990 episode, today’s yield-curve inversion is suggesting odds of a U.S. recession over the next 12 months are nearing 100%. Below are charts of the yield curve from 1-month to 30-years for the current setup and December 2021. Last year’s upsloping yield curve (from left to right, short to long duration) is typical of the early to middle stages of an economic cycle, where it’s easier for banks to earn a profit by borrowing money from savers at far lower cost than the long-term loan rates received through new loan originations or investments in the financial system.
ustreasuryyieldcurve.com – December 2nd, 2022 Treasury Curve ustreasuryyieldcurve.com – December 2nd, 2021 Treasury Curve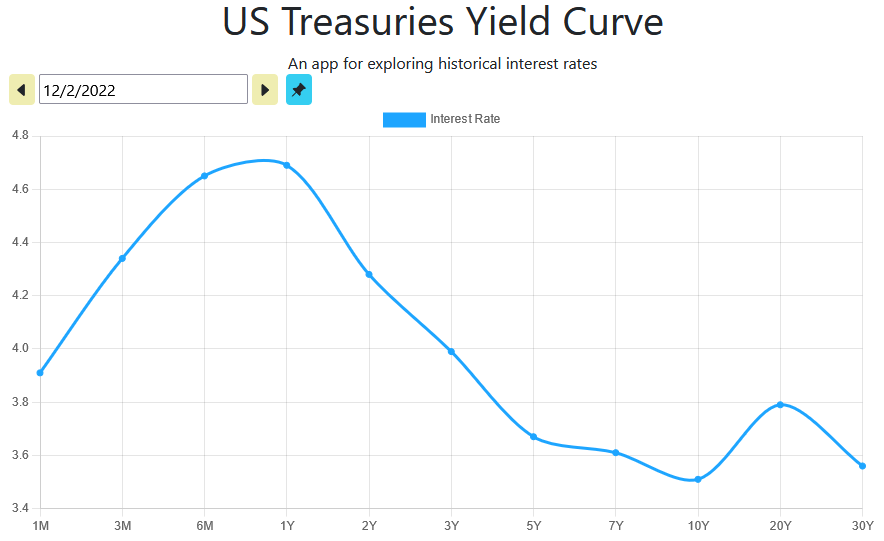
Many on Wall Street like to review the spread between 1-year and 2-year yields vs. 10-year and 20-year ones. The classic definition says an “official” inversion appears when 3-months are higher than 30-years, which just occurred in November. Categorically, the 1% spread difference between 1-year rates and the 30-year T-bond is wickedly bad news for the economy, at a distance I have never before experienced over 36 years of trading.
In late 2022, debate over still strong employment trends (honestly unemployment numbers are a notorious “lagging” indicator in the recessions I have experienced since 1990) and Q3 GDP growth numbers coming in positive at +2.9% (largely offsetting slightly negative Q1 and Q2 results) means a recession has yet to appear technically.
Nevertheless, credit tightness is now the norm, as it is becoming less profitable for banks to make new loans at current spreads. For example, if it costs banks 4% to 5% to find capital from savers, while new loans are made at 6.5% mortgage rates or the 7% prime rate for businesses, little room for error exists if default rates and administration costs continue to rise in a slowing economy. In the end, credit standards (creditworthiness from borrowers) are raised to prevent loan losses in the future, and originators may decide not to make riskier-loans, even ones approved last year. This is how the inverted yield curve works by itself (with help from Federal Reserve policy decisions) to directly slow economic expansion in future quarters.
Boeing Recession Performance Historically Stinks
So, if a recession is coming, do you want to own a deep cyclical, capital-spending dependent Boeing? The answer is no, all other variables being equal, as business travel and vacation spending are usually areas first cut to save money. Commercial airlines may choose to not sign contracts for new planes. They may delay existing orders, and if travel demand dives lower, airlines may cancel previously booked production orders altogether. On top of this bleak civilian order outlook, government military spending on planes can come under pressure in future years as a way to control rising fiscal deficits during economic contractions.
Let’s look at Boeing’s trading history during the previous four recessions over the last 32 years. You can review on the charts below large peak-to-trough BA total return losses (including dividends) of -75% in 2020, -70% during the 2007-09 Great Recession, -65% during the original Tech Wreck after the year 2000, and -50% between July 1990 (before the Persian Gulf War erupted with Iraq) and December 1992. The normal pattern is Boeing falls hard during the slide in GDP, and “underperforms” for several years thereafter. My diagnosis if you are bullish on Boeing right now is you need to get your facts checked pronto.
2020 COVID-19 Pandemic
YCharts – Boeing vs. S&P 500 Total Returns, Recession Shaded, June 2019 to December 2020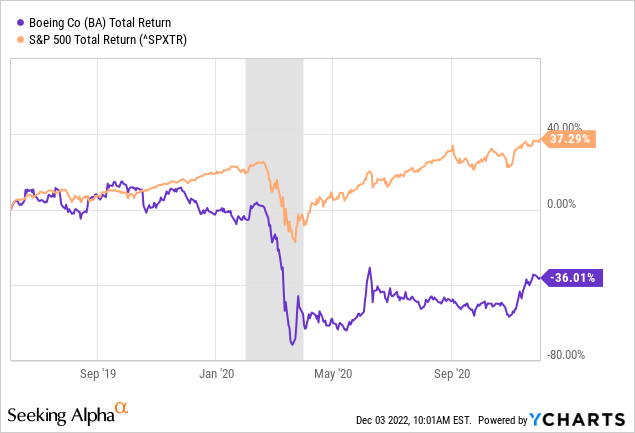
2007 to 2009 Great Recession
YCharts – Boeing vs. S&P 500 Total Returns, Recession Shaded, July 2007 to December 2009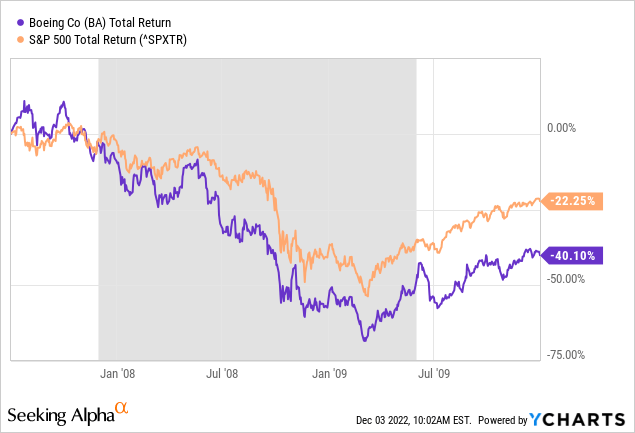
2001 to 2002 Dotcom Tech Bust
YCharts – Boeing vs. S&P 500 Total Returns, Recession Shaded, October 2000 to March 2003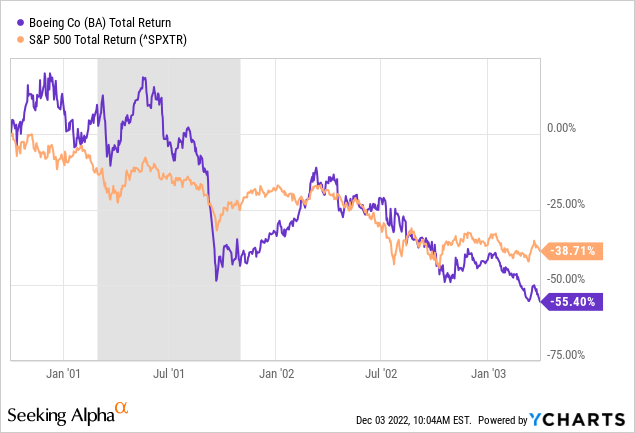
1990 Persian Gulf War
YCharts – Boeing vs. S&P 500 Total Returns, Recession Shaded, March 1990 to March 1993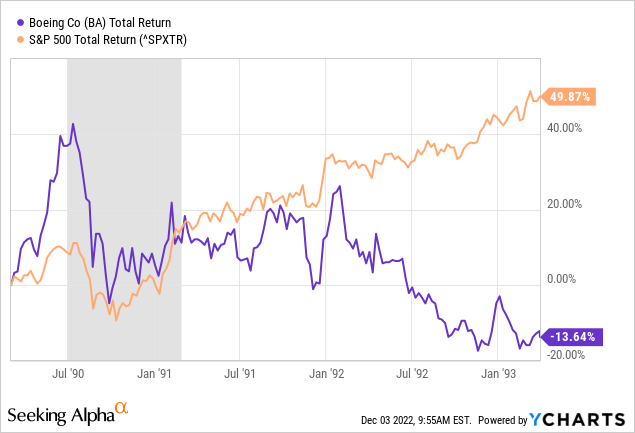
Weak Financials = Huge Risk
But perhaps the scariest news of all for Boeing stakeholders is company financials are the least healthy in decades. The company is barely holding on as it is, with no free cash flow (on a trailing 12-month basis), massive existing debt service, and a sizable “negative” tangible book value. A major recession in 2023 would be horrific news for the company’s future, and that may be what we get!
Going all the way back to 1987, tangible book value (real physical assets like cash, inventory, plant & equipment, minus total liabilities) has nosedived deep into negative territory, especially measured from 2015 (-$28 billion currently or -$47 per share). In other words, if airlines and governments stopped purchasing all new planes, and assuming Boeing went into bankruptcy, the shares have NO underlying net asset value to back up your investment.
YCharts – Boeing Tangible Book Value (Quarterly), Since 1987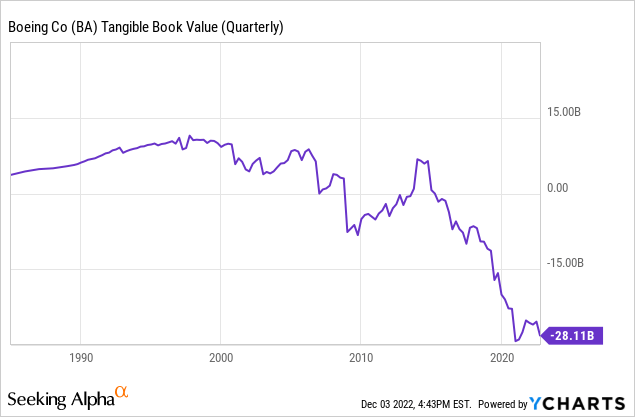
The pandemic order cancellation excuse has severely weakened Boeing’s financials, as management decided to go deep into debt in 2020 to keep its doors open and supplier/worker payments up to date. Below is a graph of truly excessive debt for a zero sales-growth business in 2021-22. Since 1990, the company has never been more leveraged than today or more susceptible to a wipeout in company worth during a recession. Net financial debt (subtracting cash) has increased from a few billion in 2019 to $43 billion at the end of September. To boot, total liabilities as a ratio of assets (including intangibles of $10 billion) have steadily doubled from 0.55 in 1998 to 1.12 today.
YCharts – Boeing Leverage Ratios, Since 1990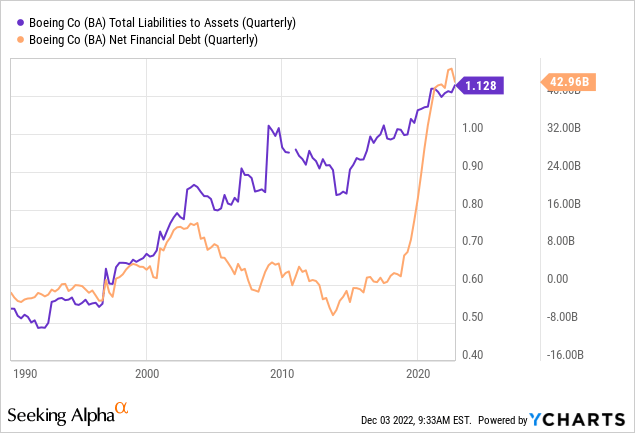
Interest expense on this debt mountain is quite elevated now, and could rise dramatically over time if interest rates do not come back down in 2023-24, at the same time as new borrowing may be required to pay its bills during a recession. Remarkably, interest expense as a percentage of sales has jumped from 0.25% to 4.2% since 2019.
YCharts – Boeing, Revenue vs. Interest Expense Data, Since 2009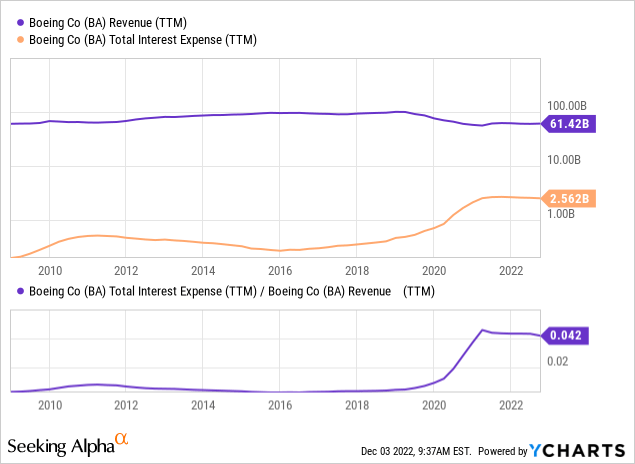
Lastly, operating losses and negative free cash flow generation remain problems for shareholders, even before another downturn takes place in the U.S. economy.
YCharts – Boeing, Trailing 12-Month Free Cash Flow, Since 1992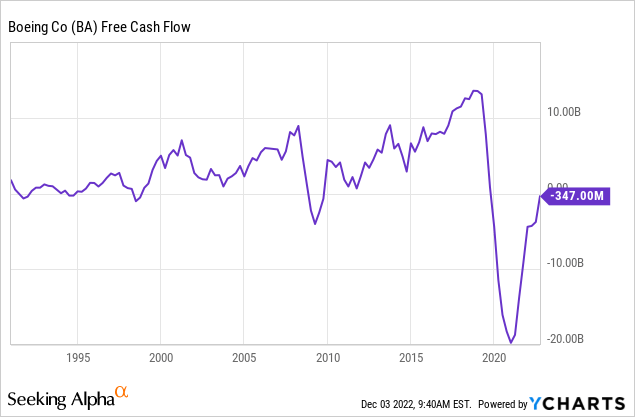
Needless to say, further increases in the share quote appear unwarranted if a recession becomes reality soon. Enterprise value ratios (using equity capitalization + debt – cash) are already flashing the stock valuation is excessive, unless a big jump higher in earnings and sales is in the offing. EV to EBITDA and revenue multiples are now much higher than average readings over the last several decades, especially since 2015 pictured below. Note: EBITDA has been negative since 2020.
YCharts – Boeing, EV to Trailing 12-Month EBITDA and Revenues, Since 2015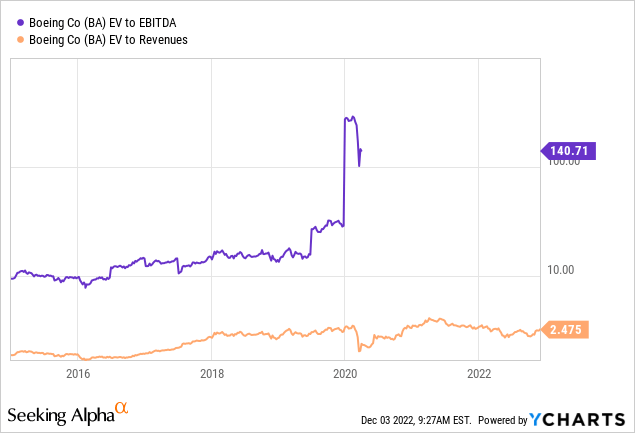
Really, the only way to value Boeing today is on sales (Price or EV to Revenues), which is near a modern-record high in December 2022. Earnings, free cash flow, and book value are all negative. Philosophically speaking is a business worth owning if it lacks these three value-creating characteristics?
YCharts – Boeing, Price to Trailing 12-Month Sales, Since 1987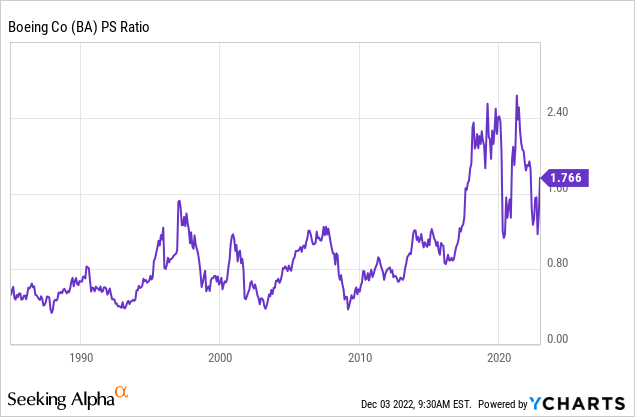
To summarize, Boeing shares are not cheap, unless business sales pick up markedly next year. Of course, that’s the present Wall Street forecast for 2023-24… decent growth. If Boeing is able to hit the analyst consensus marks below, it will be the first time in modern history the company has been able expand nicely during a likely recession.
Seeking Alpha – Boeing, Analyst Estimates for 2022-24, December 2nd, 2022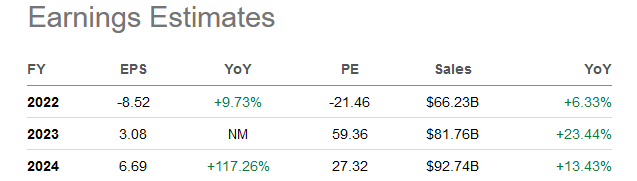
Final Thoughts
In my mind, an investment in Boeing requires too much faith and hope, ignoring truth and consequences. If a recession does not appear (which is an incredible long shot according to the inverted Treasury yield curve) or Boeing’s orders and production expand strongly during one (which has never happened in modern times), sure the stock quote could theoretically climb a little. Additional upside of 20% or 30% is not impossible in 2023, using best-case scenarios.
On the other hand, if we get a severe recession with airlines cancelling orders, the horrible financial mess on its balance sheet could quickly lead to operating difficulties requiring massive new equity issuance (direct dilution to existing ownership interests) or greatly expanded debt issuance (or a combination) to raise cash and pay its bills. Neither outcome will support the share price.
The technical trading picture is not much help for the bullish argument either. On the 18-month chart below of daily price and volume changes, it’s hard to argue the Q4 2022 upswing is anything of real consequence from a momentum perspective. The company is basically tracking the S&P 500 during calendar 2022 and is down a “relative” -24% to this blue-chip index since May 2021, with Negative Volume Index and On Balance Volume patterns not very supportive of future price gains.
StockCharts.com – Boeing, 18 Months of Daily Price and Volume Changes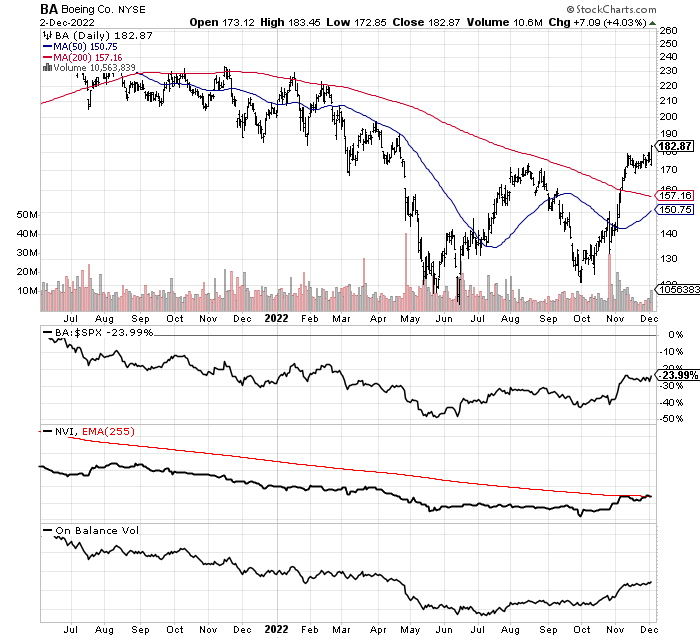
I wrote a bearish article on the company in April 2021 here, when price was at $244 vs. $183 today. If anything, I am more bearish now, keeping my Sell rating for the next 12-month investor outlook. Assuming a recession hits next year, with company earnings, cash flow, and sales stagnating or worse, Boeing’s fair valuation could be under $100 share, using 10-year averages on trailing sales. Remember, with no earnings or free cash flow, and a massively negative tangible book value, what fundamental metric is left to value the company?
One final consideration: the absence of traditional earnings and cash flow, in combination with record company debt argues Boeing is an excellent short-sale candidate. You don’t have to worry as much about an outlier takeover bid for the company, because of its large size and rotten financials. BA doesn’t pay a dividend for extra brokerage holding cost on borrowed positions. And sadly, there is no guarantee a Fed-induced U.S. economic tailspin can easily be recovered, as record American debts on declining GDP could morph into a unique obstacle we have not faced since the 1930s Depression Era.
Thanks for reading. Please consider this article a first step in your due diligence process. Consulting with a registered and experienced investment advisor is recommended before making any trade.
Be the first to comment