


PhonlamaiPhoto
DISCLAIMER: This note is intended for US recipients only and, in particular, is not directed at, nor intended to be relied upon by any UK recipients. Any information or analysis in this note is not an offer to sell or the solicitation of an offer to buy any securities. Nothing in this note is intended to be investment advice and nor should it be relied upon to make investment decisions. Cestrian Capital Research, Inc., its employees, agents or affiliates, including the author of this note, or related persons, may have a position in any stocks, security, or financial instrument referenced in this note. Any opinions, analyses, or probabilities expressed in this note are those of the author as of the note’s date of publication and are subject to change without notice. Companies referenced in this note or their employees or affiliates may be customers of Cestrian Capital Research, Inc. Cestrian Capital Research, Inc. values both its independence and transparency and does not believe that this presents a material potential conflict of interest or impacts the content of its research or publications.
Not As Scary As You Think
At investor bootcamp you are taught the following things:
- Semiconductors are a highly cyclical industry, be careful
- Semiconductor fabrication is a highly capital-intensive activity, be careful
- Semiconductor fabrication stocks are very scary, be careful
There is plenty of truth in these adages, as a glance at the longer history of the sector will attest.
So when Warren Buffett bought a sizeable chunk of TSMC (NYSE:TSM) stock, anyone who had attended the above bootcamp could be forgiven for thinking, huh?
Well, if you take a look at the fundamentals that TSM has delivered in recent years, you can see why the company fits the Berkshire model. Let’s jump right to those numbers. Here are the last three years.
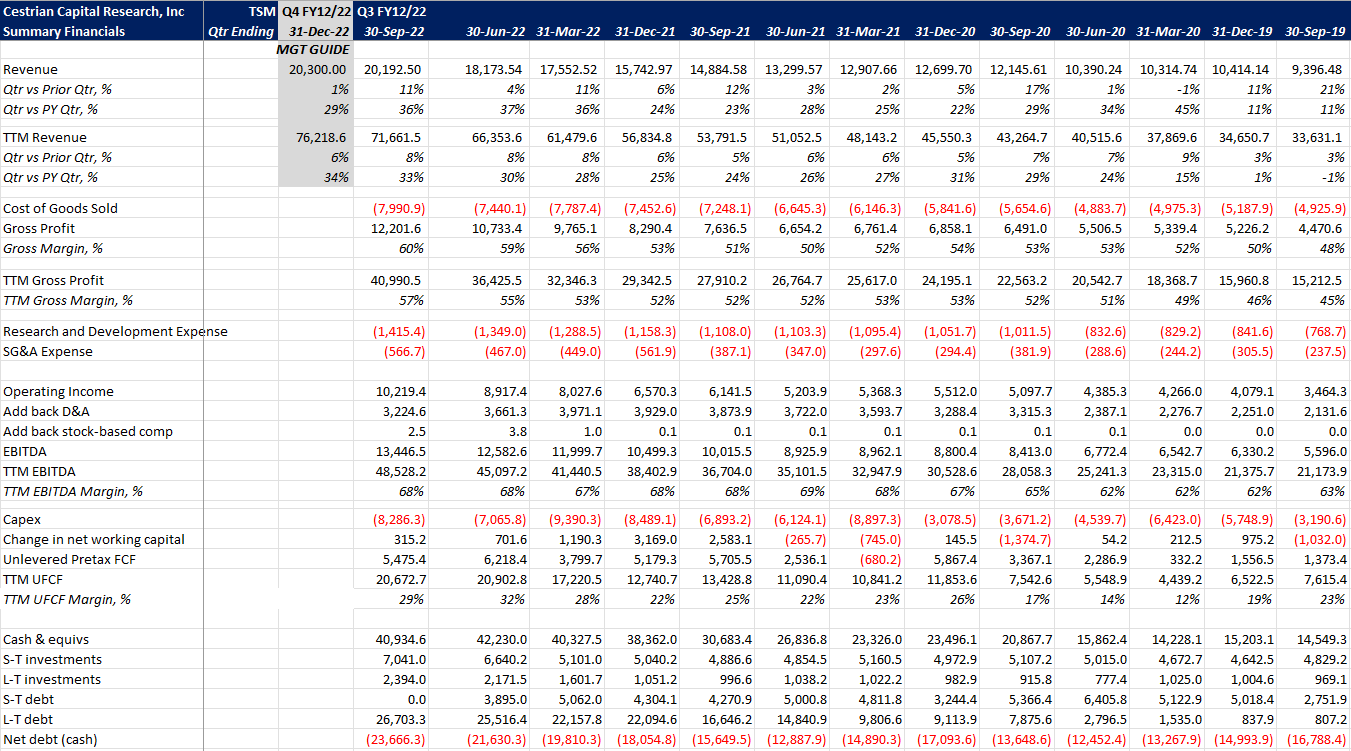
TSM Fundamentals (YCharts.com, Cestrian Analysis)
A few highlights:
- Recession risk notwithstanding, revenue growth continues apace; in the most recently reported quarter (Q3 of FY12/22), TTM revenue growth stood at +33% vs the prior year; at the midpoint of the management guidance for Q4, revenue growth in FY12/22 will be similar.
- Gross margin is very high at present – 57% on a TTM basis and indeed 60% in the current quarter. This means that TSMC is either able to charge high prices to its customers, or its materials costs are low, or both. This may not be sustainable – the average gross margin over the last five years was around 50% on a TTM basis.
- Despite record high R&D expenses – $5.2bn in the last twelve months, which indicates high confidence from TSMC management – EBITDA and margins are high at 68% on a TTM basis.
- And despite record capex – $33bn (!) in the last twelve months, another big vote for future strength – unlevered pre-tax free cashflow margins are also high at 29% on a TTM basis.
So here we have a company with sustained high rates of revenue growth which is positioning for still more growth – hence the big R&D and the big capex spend – yet is able to click in high cash flow margins nonetheless.
Sound like a Berkshire business now? Starting to, right?
Let’s look at the fundamentals through a Berkshire lens.
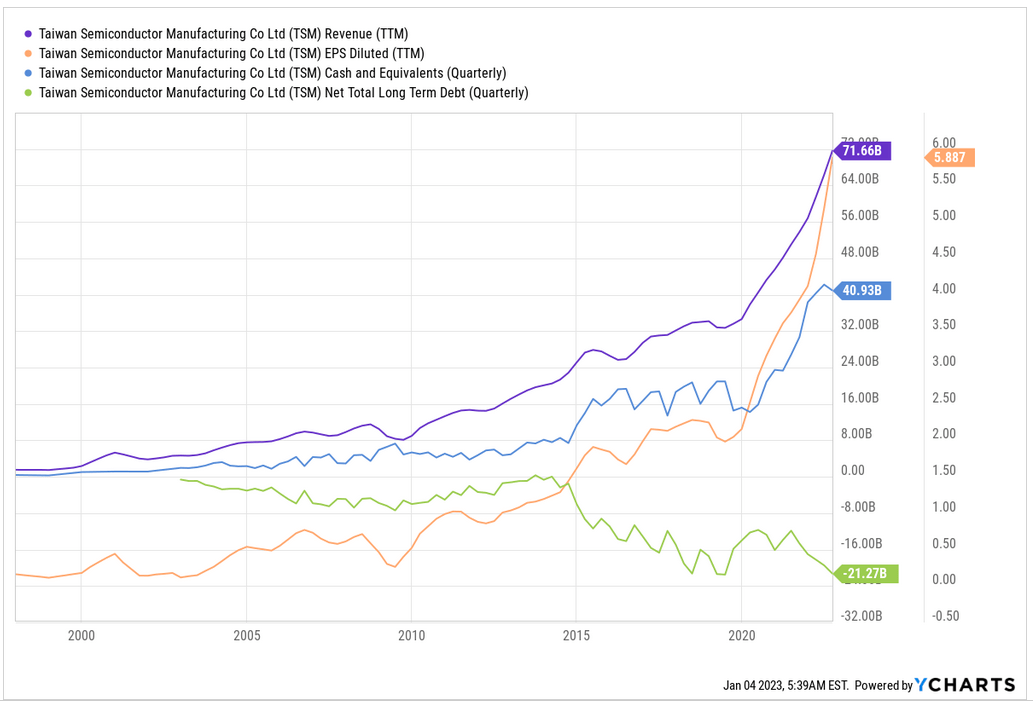
TSM Fundamentals Chart (YCharts.com)
- Purple line – TTM revenue
- Blue line – TTM diluted EPS
- Orange line – cash and equivalents at the end of each quarter
- Green line – net total long term debt at the end of each quarter
In fact, it looks exactly like a Buffett business. Which is why despite the bootcamp lesson, Berkshire took the plunge.
Now, big money – and none bigger than Buffett in this regard at least – has a core job to do, and it isn’t drawing stock charts. It is to spend time in the corridors of power, to pick up whatever nuances they can about the future direction of travel of the economy, public policy and so forth. Legally, of course.
And the direction of travel in semiconductor is westward. In other words, we can expect to see continued meaningful re-shoring of semiconductor design and fabrication in the US and its allies, meaning less work done/less value generated in China, more in the US and Taiwan. TSMC is core to this policy as their recent Arizona commitment evidences; thus far China has yet to stage a meaningful response.
So we have strong fundamentals; a policy tailwind from DC; how about valuation and technicals?
The market today is asking you to pay 17.6x unlevered pre-tax FCF for TSM stock. For that rate of revenue growth at those cash flow margins, that’s not so bad.
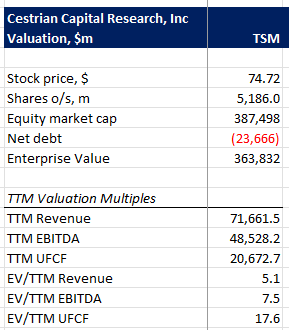
TSM Valuation (YCharts.com, Cestrian Analysis)
And on the chart? Here’s how we see it. (You can open a full page version of this chart, here).
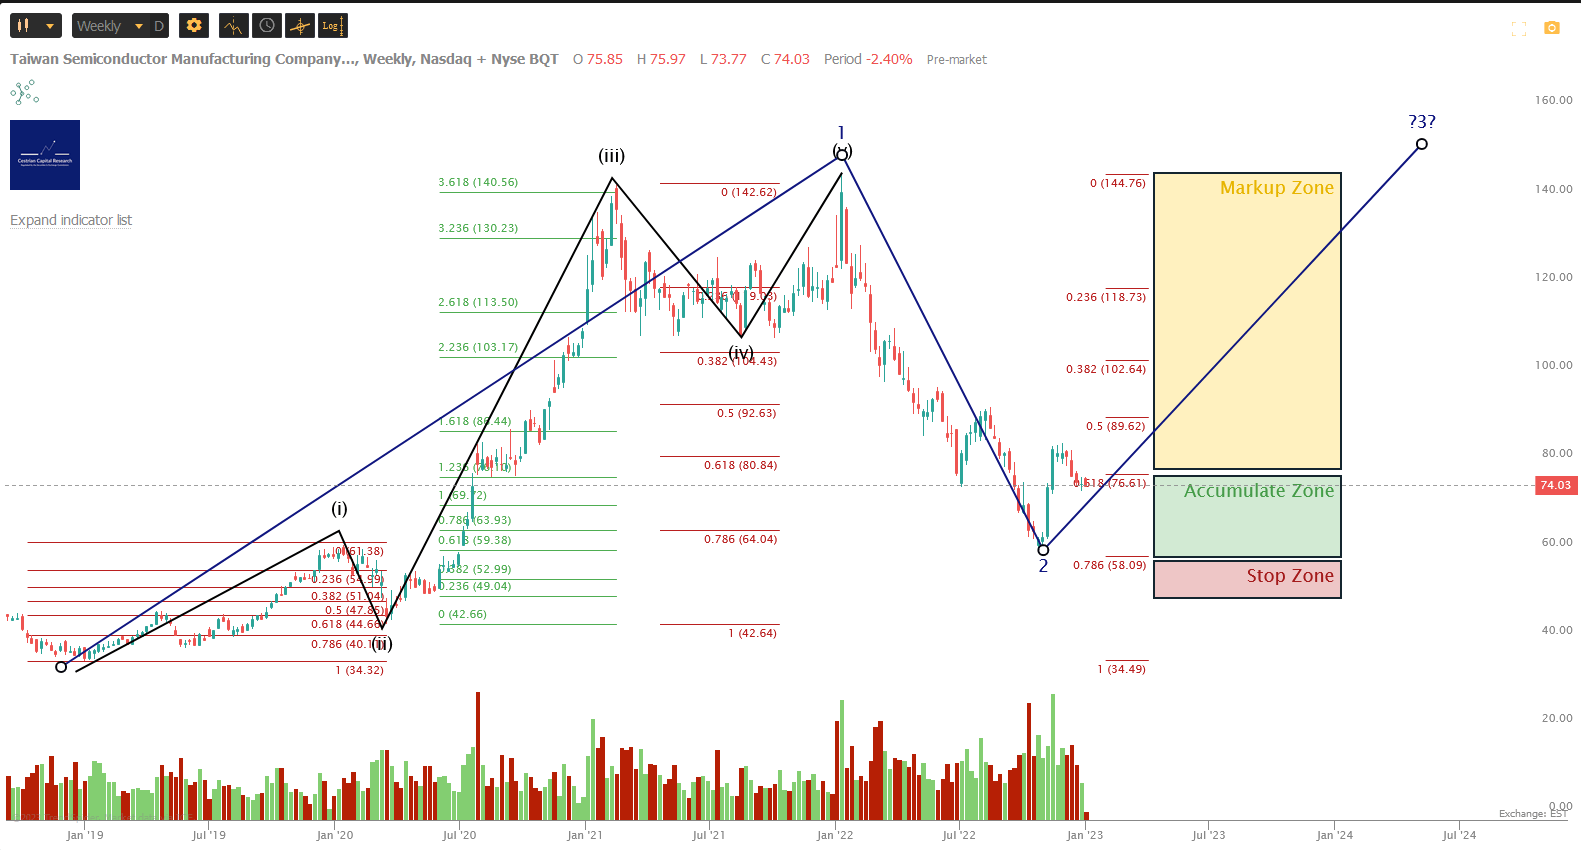
TSM Chart (TrendSpider, Cestrian Analysis)
Using our preferred Elliott Wave / Fibonacci extension-retracement toolkit, this chart is a picture-perfect example of the ebbs and flows of stock prices.
Breaking Down The Larger Degree Wave 1 (December 2018 to January 2022)
- Wave i up: +$27/share between Dec-18 and early January-20 (note the earlier-than-market Covid correction, a signal as it turned out).
- Wave ii down: -$19/share from Jan-20 to the March-20 Covid lows – troughing a little below the 61.8% Fibonacci retracement. Note that’s less of a correction than the S&P, or the Dow, or the Nasdaq, or the Russell 2000 from the pre-Covid highs; another signal about the potential resilience of this name.
- Wave iii up:+$100/share between March-20 and February-21, which is a 3.618 Fibonacci extension of the prior Wave i
- Wave iv down: -$35/share between Feb-21 and the final re-test of that level in October 2021 – this wave terminated a little above the 38.2% retrace of the Wave iii up, a shallow Wave 4 down.
- Wave v up: +$35/share between Oct-21 and Jan-22, making a new high just above that prior Wave iii.
That’s textbook.
And so is the larger degree Wave 2 (Jan-22 to Oct-22), which corrected to within $1 (<2%!) of the textbook 78.6% retracement characteristic of a deep wave two.
(Oh, and it would appear that Berkshire has taken to using Elliott Wave analysis, since their announced buy was right around that 78.6% retracement level!).
The stock has since commenced what we believe will be a larger-degree Wave 3 up. It has put in a smaller-degree Wave i within that larger Wave 3, and a corrective smaller-degree Wave ii down, too.
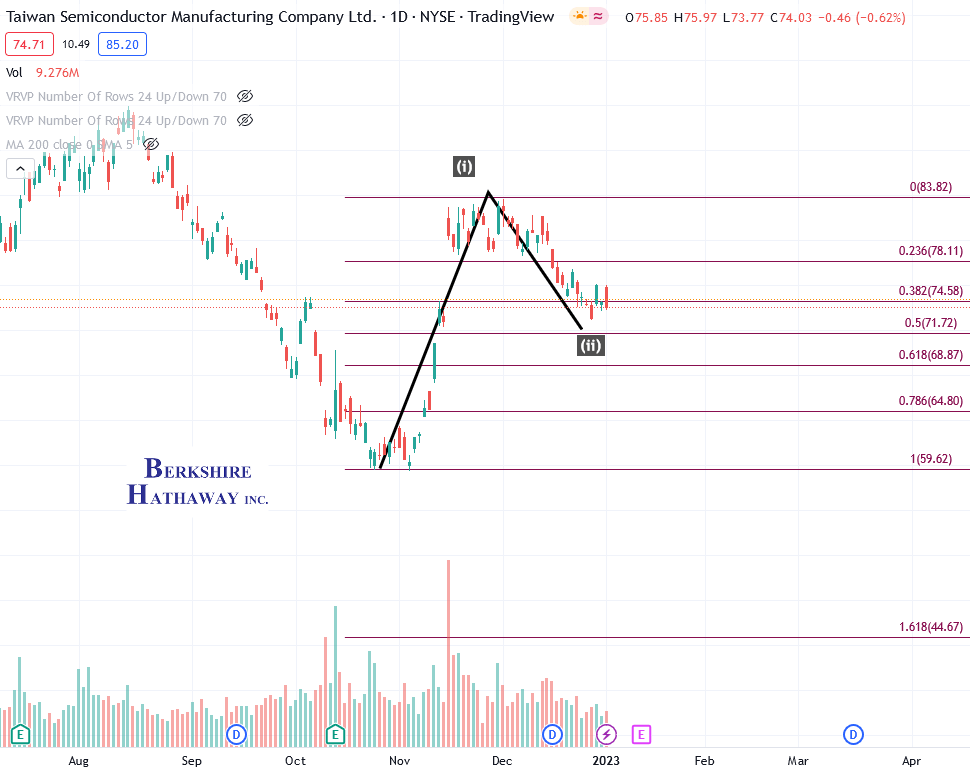
TSM Chart II (TradingView, Cestrian Analysis)
For sure the stock could fall back further – even as far as $65/share without breaking the pattern of a larger-degree move up. But historically the stock has been resilient in downturns and you now have the Buffett factor behind the name too. So in staff personal accounts – having opened a new position after the Buffett acquisition – we’re adding to TSM today. We think the larger-degree move from here is, up.
If you look back at that larger-degree chart above, the same pattern recognition method that has suited the stock to a tee historically suggests that a new all-time high is possible in this name. That’s not something that anyone in the current gloomy environment is likely to consider a sensible target. But if you’re patient, if you can wait out whatever short-term impact there is to the real economy in the coming months, if you can wait for the strengthening of the US/Taiwan semiconductor axis vs. the Chinese semiconductor axis to play out? Then we think TSM can be a very successful long-term investment.
We rate the name at Accumulate as a result. We believe buying between the Berkshire floor (call it $58/share) and the 0.618 retrace of the larger degree Wave 2 down (call it $77/share) is sensible for a long-term hold. If the stock drops below the Berkshire floor, something bad has happened and so placing a protective stop in that area is likely prudent. If the stock moves up as we expect in the next year or two, we’ll revisit profit taking opportunities. As always using a trailing stop may be a good idea if the stock does put clear blue water between itself and the current entry price.
Cestrian Capital Research, Inc – 4 January 2023.
Be the first to comment