

liorpt/iStock Editorial via Getty Images
While Intel (NASDAQ:INTC) is the market leader in the CPU market, we see it continuing to face tough competition from AMD (AMD) in the notebook and desktop CPU market as well as data center and lose share to AMD given its advantage across all 3 platforms with competitive positioning based on product performance. Also, we see Arm could disrupt the CPU market and capture a significant portion of the CPU market.
We also believe Intel’s strengths beyond CPU is its broad portfolio of products outside of CPUs, including GPUs, FPGAs and ASICs and believe Intel stands to benefit from AV, IoT, and 5G markets as well as its expansion into foundries but remains disadvantaged in terms of scale to TSMC (TSM) and Samsung (OTC:SSNLF).
Intel had recently reorganized its business segments with 3 new segments. Based on its latest quarterly report in Q1 2022, it provided the new reportable segment breakdown. In this analysis, we looked into its new and reclassified business segments following its business reorganization.
Intel, Khaveen Investments 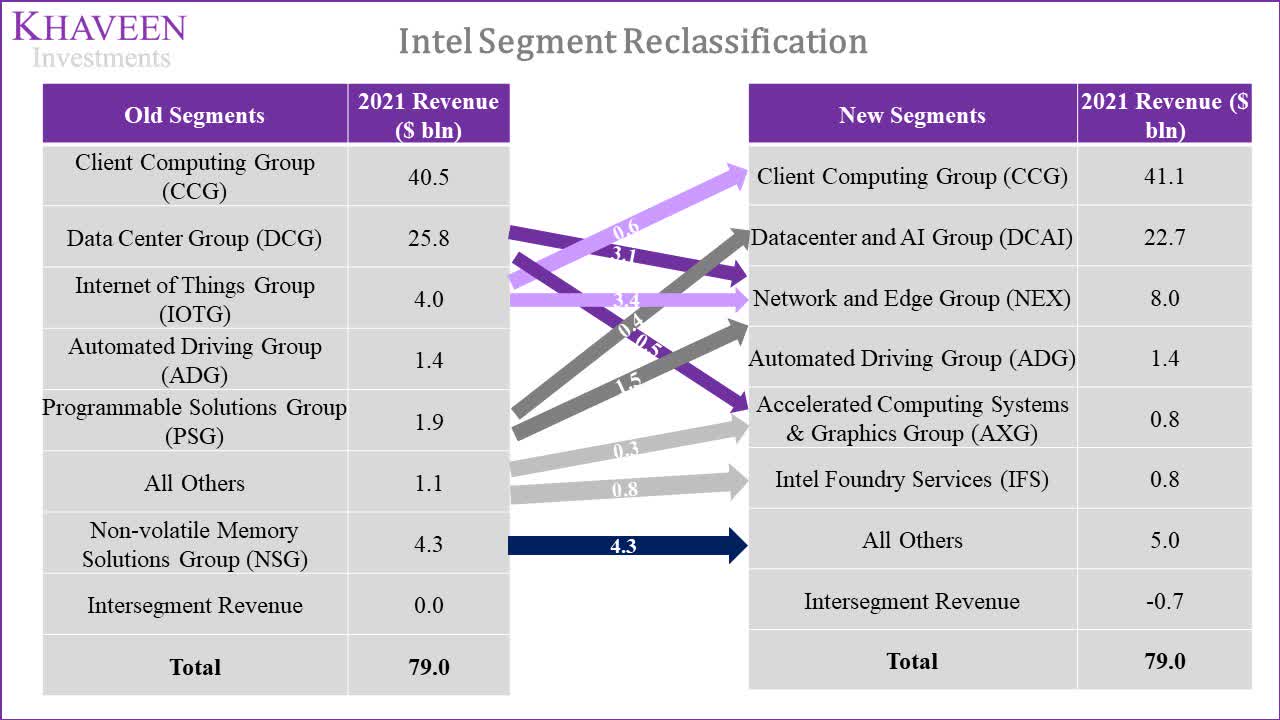
From the chart, the company’s CCG segment had been retained but had higher revenue by $0.6 bln which we believe could be from its Intel Core CPUs previously accounted for under its IOTG segment. Moreover, its DCG segment had been renamed DCAI which excludes its adjacent business products ($3.1 bln) such as Ethernet adapters and Silicon Photonics now under the NEX segment. Besides that, the DCAI segment also includes products from PSG such as FPGAs and ASICs. Furthermore, the new NEX segment also includes its products from IOTG ($3.4 bln) such as Xeon D processors and software toolkits including OpenVINO. Whereas its new segments such as AXG include its new discrete GPU business and HPC products from DCG which we estimate at $0.5 bln). Additionally, its new IFS segment ($0.8 bln) which is its foundry business was previously accounted for under other revenue. Finally, its divested NAND business is now accounted for under its Other revenue.
We examined its 3 new segments (NEX, AXG, IFS) and analyzed the different products sold within those segments, and determined their product competitiveness in comparison to products of respective competitors of each of those segments. More specifically, we analyzed the performance and pricing of the GPU market to determine whether it has an advantage against AMD and Nvidia (NVDA).
We then determined the sales prospects of each of these segments by incorporating market growth outlooks, shipment growth, competition, and capacity constraints. This also allowed us to project the market share for its foundry segment. We finally derived the market opportunities of each of these 3 new segments to determine how much additional revenue Intel could reach by the year 2025.
Networking & Edge Business Reorganization
According to Intel, the segment provides a portfolio of hardware and software platforms that allows customers access to intelligent edge platforms and enables digital transformation from edge to cloud. Also, the company reorganized its DCG segment into the new DCAI which includes its server CPUs and FPGAs but without its adjacent business with networking products such as Ethernet and silicon photonics.
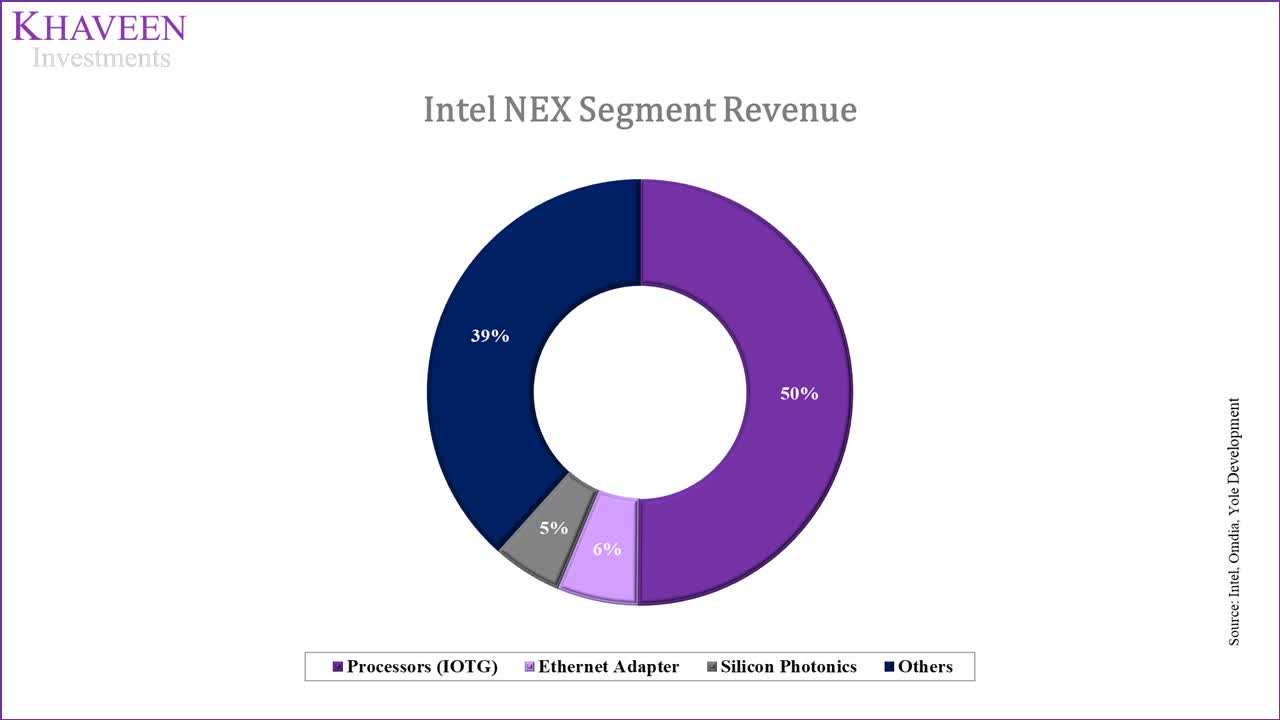
Based on the company’s NEX segment revenue, we broke down its segment revenue according to its major product groups in both logic and DAO markets including processors based on the previous revenue breakdown of its IOTG segment as well as ethernet adapters and silicon photonics-based on its market share and estimated market sizes for each product.
Intel, Omdia, Yole Development, Khaveen Investments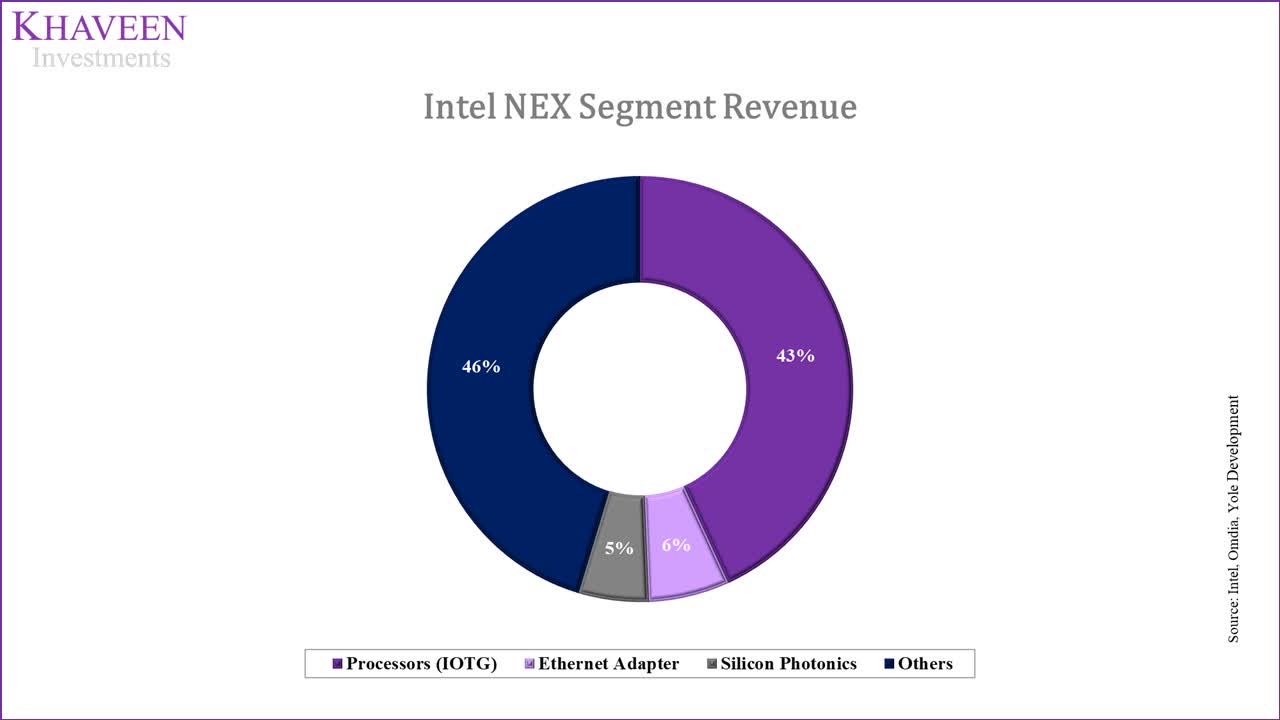
Based on the chart, the largest revenue contributor is from its processors which were included under its IOTG segment. For example, this includes its recently-launched Intel Xeon D processors for network deployments to 70 customers such as Cisco, Juniper Networks and Rakuten Symphony as well as FlexRAN software and OpenVINO toolkit for AI workloads as highlighted from its earnings briefing.
Furthermore, according to Omdia, Intel was the second largest company in the Ethernet adapter market with a share of 19.3% in 2020 trailing behind Nvidia through its Mellanox acquisition as the market leader with a 24.6% market share. Based on Intel, its Ethernet 800 series is its first SyncE capable Ethernet Adapter designed for edge computing and 5G. Though, according to Cambrian-AI Research, Nvidia’s BlueField 2X product has an advantage over Intel supporting 200Gb Ethernet compared to up to 50Gb for Intel.
Moreover, for Silicon Photonics, Intel dominated the market with a 53% market share according to Yole Development. Intel’s product development of silicon photonics transceivers includes products ranging from 200 Gb/s to 800 Gb/s.
Compared to Broadcom (AVGO) and Marvell (MRVL) which we previously analyzed, the company’s new segment is similar as it includes its networking products with customers spanning across communications equipment providers and data centers.
To project its segment growth, we forecasted each of its product revenue based on the market forecast CAGR for embedded processors, ethernet adapters and silicon photonics as well as a 5-year average growth rate of its previous adjacencies growth rate.
|
NEX Segment Revenue ($ mln) |
2021 |
2022F |
2023F |
2024F |
2025F |
2026F |
|
Processors (‘IOTG’) |
3,442 |
3,724 |
4,030 |
4,360 |
4,718 |
5,104 |
|
Growth % |
8.2% |
8.2% |
8.2% |
8.2% |
8.2% |
|
|
Ethernet Adapter |
495.2 |
661 |
883 |
1,178 |
1,573 |
2,100 |
|
Growth % |
33.5% |
33.5% |
33.5% |
33.5% |
33.5% |
|
|
Silicon Photonics |
422.3 |
531 |
668 |
841 |
1,058 |
1,330 |
|
Growth % |
11.8% |
25.8% |
25.8% |
25.8% |
25.8% |
25.8% |
|
Others |
3,617 |
4,317 |
5,153 |
6,150 |
7,341 |
8,762 |
|
Growth % |
19.4% |
19.4% |
19.4% |
19.4% |
19.4% |
|
|
Total |
7,976 |
9,233 |
10,733 |
12,529 |
14,689 |
17,297 |
|
Growth % |
11.8% |
15.8% |
16.2% |
16.7% |
17.2% |
17.8% |
Source: Intel, Omdia, Yole, Khaveen Investments
Overall, following its business reorganization and reclassification of its IOTG segment in 2021, we have broken down the company’s new NEX segment to provide a clearer overview of the segment. This includes products such as Xeon processors, ethernet adapters and silicon photonics. In total, we estimated these products to account for 55% of segment revenue. Based on our analysis, we believe the reclassification provides a better reflection of its business segment as it groups its key networking products, which is similar to Broadcom’s Networking segment, for a common customer base of communications equipment providers such as Cisco (CSCO) and Juniper (JNPR) for 5G and edge computing applications. Furthermore, we forecasted its segment growth to be driven by its high growth markets including ethernet adapters (33.5% CAGR) and silicon photonics (25.8% CAGR) resulting in a total revenue growth forecast of 15.8% in 2022 which is also superior to our total forecast for the company’s revenue at 0.6%. Based on our total revenue forecast, we see this segment becoming one of its key segments with a total market opportunity of $14.7 bln by 2025.
Expansion Into Discrete GPU Market
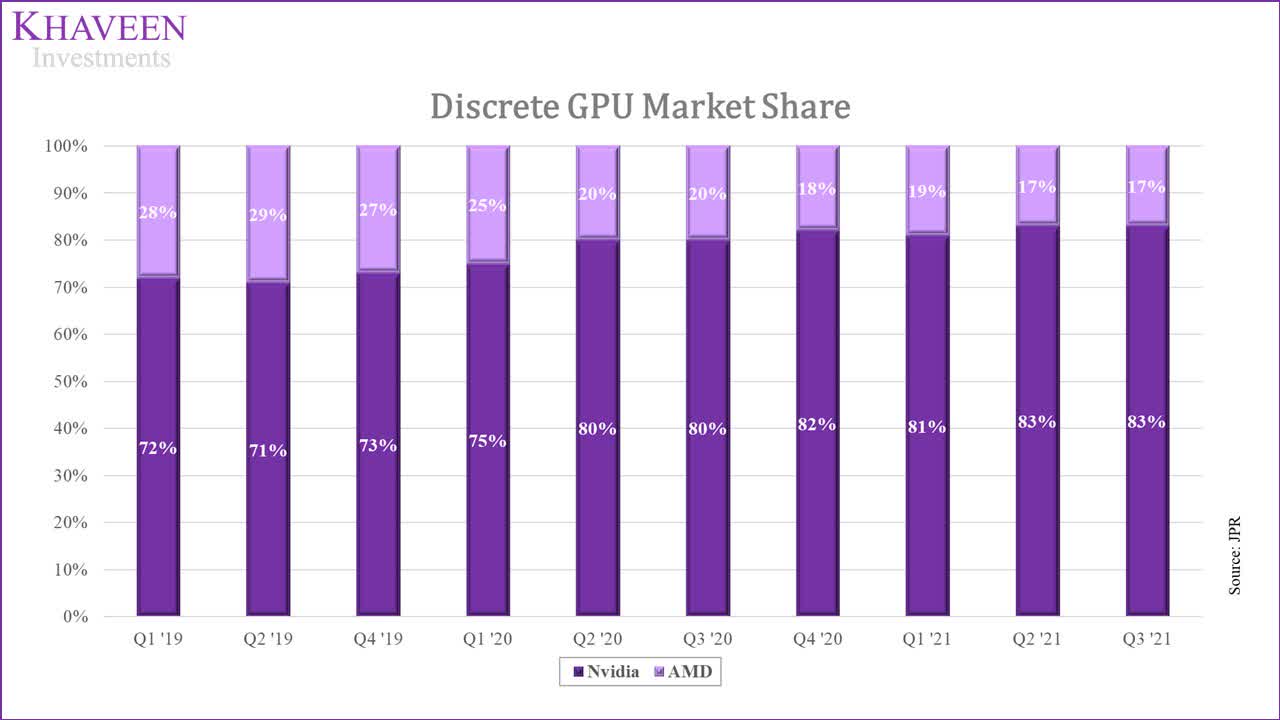
Furthermore, under the company’s AXG segment, Intel had introduced its new discrete GPUs such as its Arc A series GPUs for notebooks based on its Q1 2022 earnings briefing. Intel is already the leader in integrated GPUs which are built into its processors based on JPR’s GPU market share. However, the introduction of its new discrete GPUs which are separate from the processor with dedicated memory will allow it to compete with Nvidia and AMD which had dominated the discrete GPU market.
Additionally, management expects the segment revenue to reach $1 bln for the full year with the launch of its products as well as stated that it was on track to ship 4 mln discrete GPUs this year including desktops and notebooks. According to Visual Computing Group, the company’s notebook GPUs are expected to be available on PCs in early summer this year. The company’s management also explained its strength by leveraging its installed base of CPUs.
Our Accelerated Computing Systems and Graphics Group builds on our installed base of CPUs, IP and software and leverages a thriving open ecosystem to disrupt a large and growing market. – Pat Gelsinger, CEO
Based on JPR, the discrete GPU market is dominated by Nvidia which had strengthened its market share over the past 3 years to 83% in 2021 while AMD trails behind and lost share to Nvidia. While Intel’s GPUs are yet to hit the market, Geekbench had provided a benchmark score for its Arc A770. Comparing its score against competitors such as Nvidia and AMD based on the average score of 2 compared products that were available on Geekbench, we determined whether Intel has an advantage over its competitors in terms of performance.
|
Company |
Average Score |
Average Price |
|
AMD |
92,774 |
$404 |
|
Nvidia |
91,117 |
$464 |
|
Intel |
85,585 |
$500 |
Source: Tom’s Hardware, Geekbench, GPU Rumors, Khaveen Investments
Based on the table, Intel is below AMD and Nvidia but not by much with a difference of only 8.4% for AMD and 6.5% (Nvidia). This is due to the higher scores for Nvidia’s GeForce RTX2070 and 3060 which are both higher than AMD’s Arc770 and AMD’s Radeon RX6700XT also has a higher score than Intel. Also, in terms of pricing, the Arc 770 is rumored to be priced at around $500 according to GPU Rumors while its competitors’ have an average price of above $400 with Nvidia having the higher pricing than AMD despite its lower average score. Overall, we believe that while Intel does not have a performance advantage over competitors, its entry into the discrete GPU business has been impressive with only a slight disadvantage to AMD and Nvidia based on the low difference in its average benchmark score.
To project its revenue growth, we based our 2022 forecast on management guidance assuming it reaches its target of $1 bln in revenue. We calculated its ASP of $250 based on its shipment target of 4 mln GPUs this year and projected it to increase by a CAGR of 4.5% based on the GPU market forecast by JPR. Furthermore, we factored in an ASP growth assumption based on the estimated historical AIB ASP CAGR of 10.7% in the past 13 years from data by JPR but tapered down by 2% as a conservative estimate to calculate its revenue growth.
|
AXG Revenue Projection |
2021 |
2022F |
2023F |
2024F |
2025F |
2026F |
|
Shipments (‘mln’) (‘a’) |
4 |
4.18 |
4.37 |
4.56 |
4.77 |
|
|
Growth % |
4.50% |
4.50% |
4.50% |
4.50% |
||
|
ASP ($) (‘b’) |
250 |
276.8 |
300.8 |
321.0 |
336.1 |
|
|
Growth % |
10.7% |
8.7% |
6.7% |
4.7% |
||
|
Revenue ($ mln) (‘c’) |
774 |
1,000 |
1,157 |
1,314 |
1,465 |
1,603 |
|
Growth % |
19% |
29.2% |
15.7% |
13.6% |
11.5% |
9.4% |
*c = a x b
Source: Intel, JPR, Khaveen Investments
All in all, although Intel had already established its leadership in the integrated GPU market, we believe its entry into the discrete GPU market could provide it with growth opportunities with its new product launches. Despite being new in the discrete GPU market, we believe Intel could become a strong contender against rivals Nvidia and AMD, which both dominate the discrete GPU market based on market share, as we see its products being fairly close to its competitors in terms of performance with only a narrow average score difference for Intel (8.4% for AMD and 6.5% for Nvidia). Also, Intel has announced its roadmap for its future generations of discrete GPUs which we believe could result in more competition for AMD and Nvidia. That said, based on our previous analysis of Nvidia, we also see the company’s innovation with its product roadmap showcasing ‘Ampere Next Next’ expected in 2024. Overall, based on our forecasts assuming management achieves its target in 2022, we see a 29.2% revenue growth for the AXG segment and a market opportunity of $1.5 bln by 2025.
Foundry Expansion
In its earnings briefing, the company highlighted its IFS segment and is working with 5 target customers including Qualcomm (QCOM) and has 30 test chips this year on Intel’s 16nm node as well as its deals representing greater than $5 bln. Intel also previously announced its acquisition of Tower Semiconductor for $5.4 bln in cash as part of its IDM2.0 strategy with the new IFS segment. The company specializes in foundry services for DAO products with process nodes up to 65nm.
We forecasted Tower Semiconductor’s revenue growth based on an estimate of its capex at its 5-year average capex as a % of sales of 18.2%. We derived an average capacity growth per cost based on TSMC’s (foundry market leader) expansion in Arizona at 1.7 Kwpm per $ bln with 20,000 wafers per month and a total planned investment cost of $12 bln. Further, we assumed its wafer ASP to grow based on the forecasted increase of 55/65nm wafers at 33% from 2020 to 2022 based on Counterpoint Research by a factor of 0.5 for a 1-year increase assumption. (16.5%)
|
Tower Semiconductor Revenue Forecast ($ mln) |
2020 |
2021 |
2022F |
2023F |
2024F |
2025F |
2026F |
|
Wafer Capacity (‘000s per month) |
166.7 |
172.9 |
179.6 |
186.4 |
193.6 |
201.0 |
|
|
Growth % |
3.8% |
3.8% |
3.8% |
3.8% |
3.8% |
||
|
Tower Semiconductor Capex |
313.7 |
313.8 |
313.8 |
330.9 |
343.6 |
356.7 |
370.4 |
|
Capacity Growth per cost (kwpm/$ bln) |
1.7 |
1.7 |
1.7 |
1.7 |
1.7 |
||
|
Incremental Wafer Capacity (‘a’) |
6.28 |
6.62 |
6.87 |
7.13 |
7.41 |
||
|
Wafer ASP (‘b’) |
9.0 |
10.5 |
10.5 |
10.5 |
10.5 |
10.5 |
|
|
Growth % |
16.50% |
0% |
0% |
0% |
0% |
||
|
Tower Semiconductor Revenue (‘c’) |
1,266 |
1,508 |
1,823 |
1,893 |
1,965 |
2,041 |
2,119 |
|
Growth % |
19.2% |
20.9% |
3.8% |
3.8% |
3.8% |
3.8% |
*c = a x b
Source: Tower Semiconductor, Khaveen Investments
As explained in the quote below, the company’s management views the deal as complementary to its vision for its foundry expansion.
Tower’s speciality technology portfolio, geographic reach, deep customer relationships and services-first operations will help scale Intel’s foundry services and advance our goal of becoming a major provider of foundry capacity globally, – Intel CEO Pat Gelsinger
Intel’s commitment to IFS is evident with the planned expansion of its Arizona and Ohio fabs for both Intel products and IFS but is only expected to be completed by 2023. We projected its growth based on our forecast of its capex at an assumption of 20% of total capex for IFS expansion. We used the average capacity growth per cost of 1.7 kwpm per $bln to derive its incremental capacity growth and ASPs based on our projection of TSMC’s ASPs in 2022 from our previous analysis of the company.
|
Intel IFS Revenue Forecast ($ mln) |
2020 |
2021 |
2022F |
2023F |
2024F |
2025F |
2026F |
|
Intel Capex |
14.3 |
18.7 |
27.0 |
28.1 |
29.1 |
30.1 |
30.7 |
|
Intel Foundry Capex (estimate 20% of total) |
5.6 |
5.8 |
6.0 |
6.1 |
|||
|
Capacity growth per cost (Kwpm/$ bln) |
1.7 |
1.7 |
1.7 |
1.7 |
|||
|
Incremental Annual Capacity (‘000s) (‘a’) |
112.2 |
116.3 |
120.2 |
122.8 |
|||
|
ASP ($) (‘b’) |
4107 |
4107 |
4107 |
4107 |
|||
|
Incremental Revenue to IFS (‘c’) |
461.0 |
477.6 |
493.7 |
504.3 |
|||
|
IFS Revenue |
715 |
786 |
786 |
1,247 |
1,725 |
2,218 |
2,723 |
|
Growth % |
58.6% |
38.3% |
28.6% |
22.7% |
|||
|
Tower Revenue |
1,266 |
1,508 |
1,823 |
1,893 |
1,965 |
2,041 |
2,119 |
|
Growth % |
20.9% |
3.8% |
3.8% |
3.8% |
3.8% |
||
|
Total IFS Revenue (Including Tower) |
715 |
786 |
2,609 |
3,140 |
3,690 |
4,259 |
4,841 |
|
Growth % |
232.0% |
20.3% |
17.5% |
15.4% |
13.7% |
*c = a x b
Source: Intel, Tower Semiconductor, Khaveen Investments
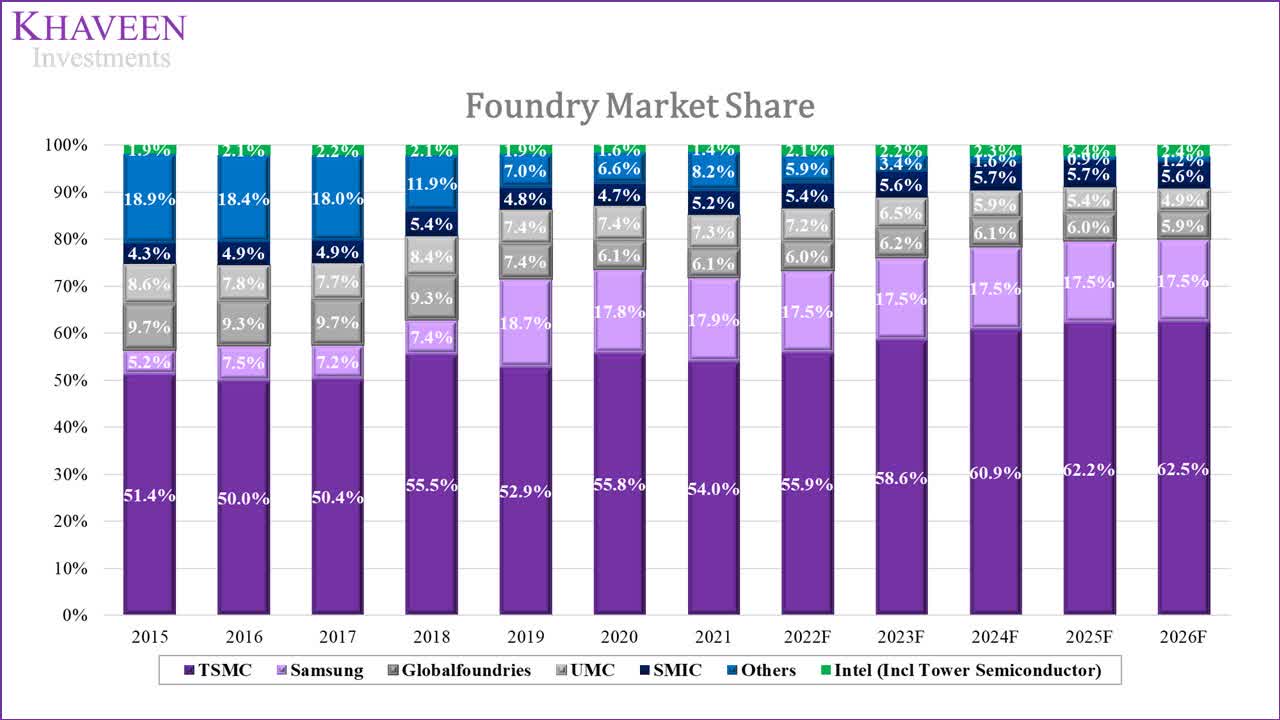
Based on our forecasted revenue of the company, we projected its market share in the chart below with data from Trendforce and IC Insights.
Trendforce, IC Insights, Khaveen Investments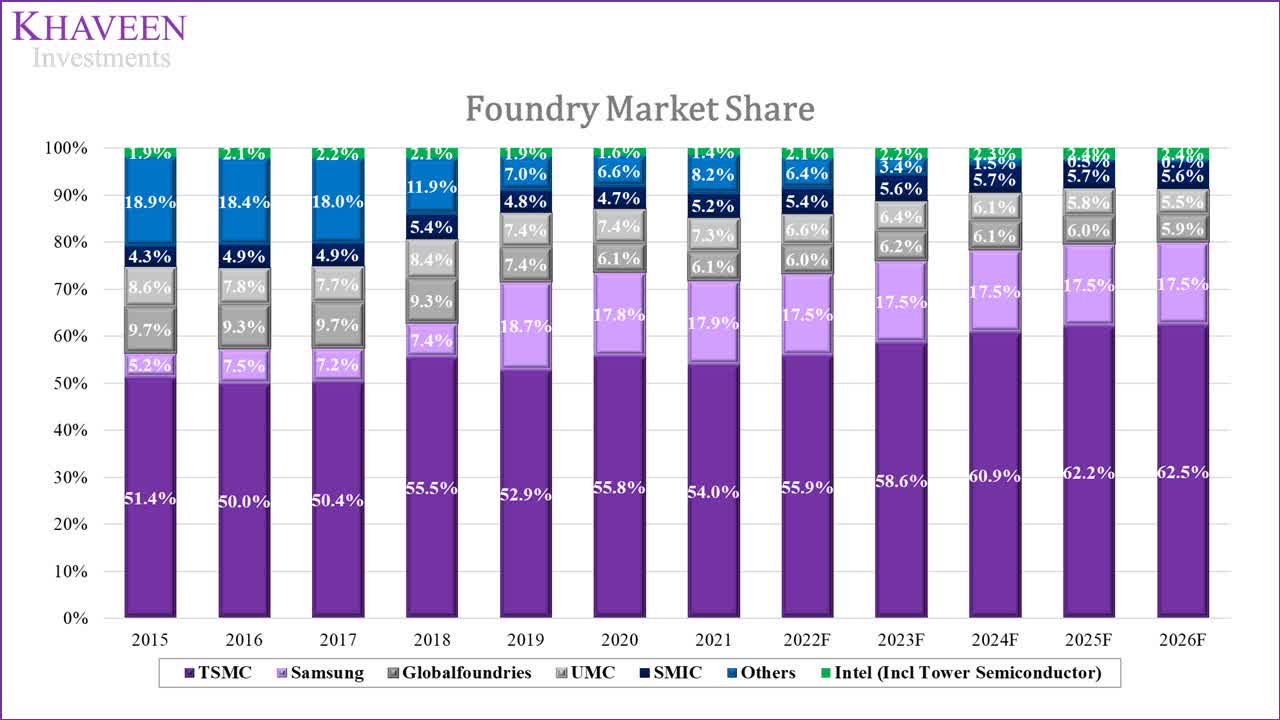
All in all, we first analyzed the company’s expansion into the foundry business with its acquisition of Tower Semiconductor for $5.4 bln. While Tower Semiconductor accounts for only a small portion of the foundry market with a market share of 1.4% in 2021, we believe the acquisition of Tower complements Intel’s strategy to expand in the foundry market under its IDM2.0 strategy and contribute additional foundry revenue to its IFS segment. Based on our forecast, we expect the company to contribute $1.8 bln in revenues for Intel’s IFS segment in 2022. Besides the acquisition of Tower, we believe the company’s aggressive planned investments to expand capacity and build fabs globally including in Arizona, New Mexico and Europe, as covered in our previous analysis, bodes well for its expansion drive in the foundry market. With an assumption of only 20% of capex for its foundry expansion, we believe the acquisition and expansion could drive Intel’s IFS segment revenue growth with a total market opportunity of $4.3 bln by 2025 and increase Intel’s market share in the foundry market to 2.4% by 2026.
Risks: PC Market Slowdown
According to Gartner, the PC market had declined in Q1 2022 by 6.8% YoY and is forecasted to reach 320 mln total shipments, translating to a decline of 2.4% for the full year of 2022 based on IDC. This is as the IDC highlighted that PC market demand has passed peak pandemic demand. We believe this could affect Intel’s CCG segment revenue growth outlook this year which is its largest segment. With a revised revenue projection for its CCG segment, we calculated the revenue impact to be 5% for both notebook and desktop segment revenues in 2022.
|
Revenue Forecast ($ mln) |
Previous Forecast |
Current Forecast |
Revenue Impact |
Revenue Impact % |
|
CCG Notebook |
26,749 |
25,411 |
-1,338 |
5% |
|
CCG Desktop |
12,623 |
12,031 |
-592 |
5% |
Source: Intel, Khaveen Investments
Valuation
All in all, we summarized our revenue projections for the company following its new reportable segments with our projections for its NGX, AXG and IFS segments as well as an updated CCG revenue projections following the PC market slowdown forecast.
|
Intel Revenue Projections ($ bln) |
2021 |
2022F |
2023F |
2024F |
2025F |
|
Client Computing Group |
41.067 |
40.90 |
43.14 |
45.30 |
47.38 |
|
Growth % |
1.3% |
-0.4% |
5.5% |
5.0% |
4.6% |
|
Datacenter and AI |
22.691 |
24.53 |
26.38 |
28.22 |
30.05 |
|
Growth % |
-3.1% |
8.1% |
7.5% |
7.0% |
6.5% |
|
Network & Edge |
7.976 |
9.23 |
10.73 |
12.53 |
14.69 |
|
Growth % |
11.8% |
15.8% |
16.2% |
16.7% |
17.2% |
|
AXG |
0.774 |
1.00 |
1.16 |
1.31 |
1.47 |
|
Growth % |
18.9% |
29.2% |
15.7% |
13.6% |
11.5% |
|
Mobileye |
1.386 |
1.93 |
2.69 |
3.74 |
5.20 |
|
Growth % |
43.3% |
39.2% |
39.2% |
39.2% |
39.2% |
|
IFS |
0.786 |
2.61 |
3.14 |
3.69 |
4.26 |
|
Growth % |
9.9% |
232.0% |
20.3% |
17.5% |
15.4% |
|
Others |
5.019 |
0 |
0 |
0 |
0 |
|
Growth % |
-1.4% |
– |
– |
– |
– |
|
Intersegment Revenue |
-0.675 |
-0.675 |
-0.675 |
-0.675 |
-0.675 |
|
Total |
79.02 |
79.53 |
86.55 |
94.12 |
102.37 |
|
Growth % |
1.5% |
0.6% |
8.8% |
8.7% |
8.8% |
Source: Intel, Khaveen Investments
|
Revenue Projections |
2022F |
2023F |
2024F |
2025F |
|
Current Projections |
0.6% |
8.8% |
8.7% |
8.8% |
|
Previous Projections |
2.0% |
7.6% |
7.5% |
7.5% |
Source: Intel, Khaveen Investments
Compared to our previous analysis, our revenue projections in 2022 is lower by 1.4% mainly contributed by the lower forecast for its CCG segment. This is because our previous forecast for the CCG segment was based on a higher shipments growth rate of 3.2% for its desktop and notebook but this updated projection is based on the revised market forecast growth rate of -2.4% by the IDC, resulting in a difference for the CCG revenue projection from 5.7% in 2022 previously to a decline of 0.4%. Though, we also projected its AXG and IFS segments this time which was not accounted for in our previous analysis with a high growth rate of 29.2% and 232% respectively. However, as these segments are small, their revenue contribution to the company is still very low. Beyond 2022, our revenue projections show an increase compared to our previous analysis by 1.2% per year driven by the superior growth of its NEX, AXG and IFS segments.
We valued the company based on a DCF valuation as we expect the company to continue generating positive FCFs. Also, we based its terminal value on a perpetual growth terminal value with the denominator based on its discount rate (6.6%) less a long-term growth rate assumption (2.8%).
Intel, Khaveen Investments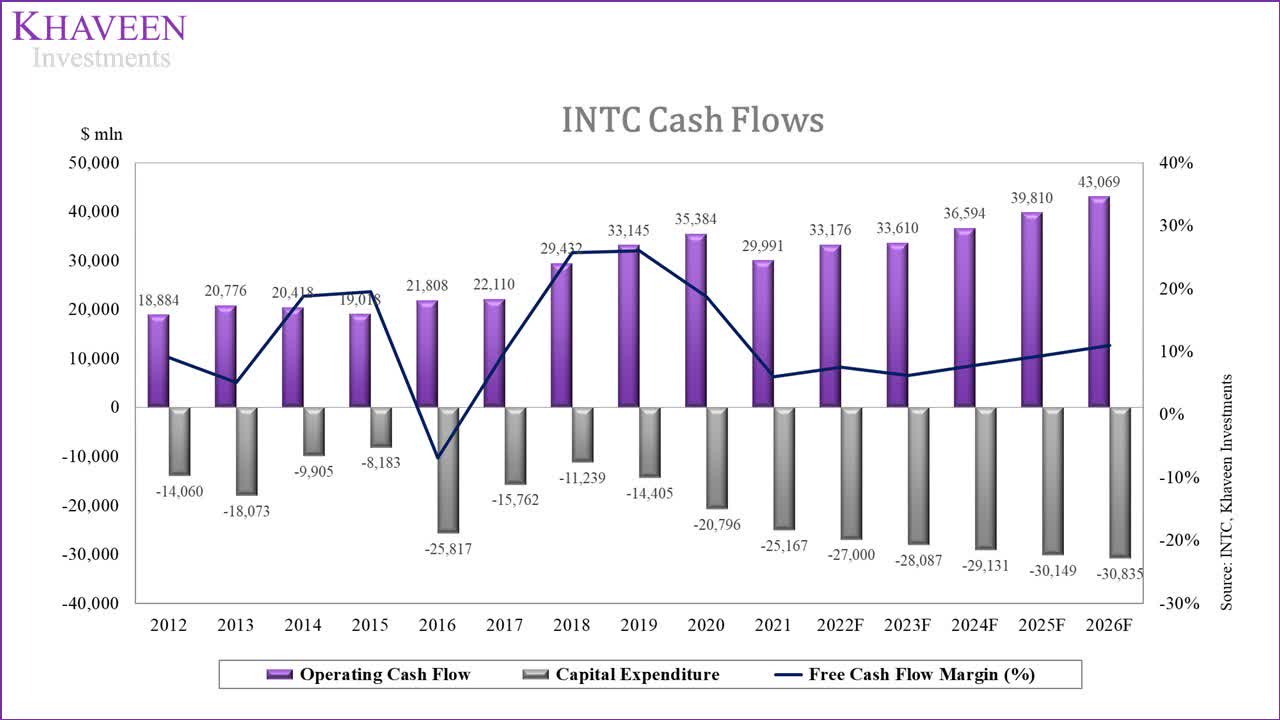
Source: Intel, Khaveen Investments
Based on a discount rate of 6.6%, our model shows its shares undervalued by 55%.
Khaveen Investments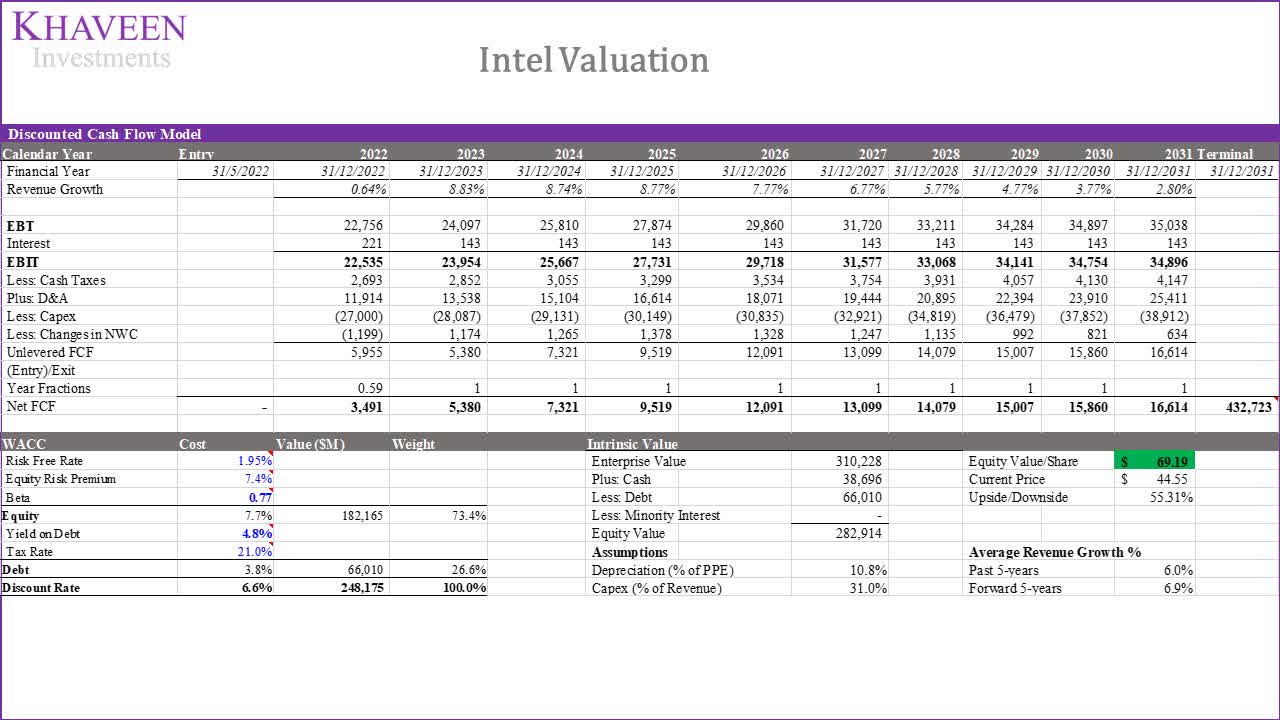
Verdict
To conclude, following the reorganization of Intel amid its planned expansion in the foundry market and development of discrete GPUs, we looked into the company’s 3 new reportable segments. This includes its networking & edge segment which we examined and broke down to its revenue streams from processors, ethernet adapters and silicon photonics which are expected to drive its revenue growth at a forecasted rate of 15.8% in 2022. Furthermore, in GPUs, we highlighted its expansion in the discrete GPU market with a solid introduction with performance narrowly close to rivals Nvidia and AMD with an average difference of 8.4% for AMD and 6.5% for Nvidia based on its benchmark scores and projected its revenue growth at 29.2% in 2022. Lastly, we analyzed its foundry business expansion with Tower Semiconductors and planned capacity fab expansions to project its revenue growth for its IFS segment at 232% in 2022. By 2025, we see these 3 new segments generating a combined $20.41 bln in revenue. We expect these new segments to be growth drivers for the company with a revenue growth forecast of 1.2% per year higher resulting in a higher valuation for the company. Overall, we rate the company as a Strong Buy with a target price of $69.19.
Be the first to comment