

KKIDD/E+ via Getty Images
This dividend ETF article series aims at evaluating products regarding the relative past performance of their strategies and quality metrics of their current portfolios. As holdings and their weights change over time, I may update reviews when necessary.
WDIV strategy and portfolio
The SPDR S&P Global Dividend ETF (NYSEARCA:WDIV) has been tracking the S&P Global Dividend Aristocrats Index since 5/29/2013. As of writing, it has 94 holdings, a distribution yield of 5.26% and a total expense ratio of 0.40%. Distributions are paid quarterly.
As described by S&P Dow Jones Indices, eligible companies must have:
- A float-adjusted market capitalization of at least $1 billion.
- An average daily volume of at least $5 million.
- A positive EPS.
- Increased dividends or maintained stable dividends every year in the last 10 years.
- An IAD yield inferior or equal to 10%.
- New components must have a payout ratio below 100%.
- Stocks listed in mainland China are excluded.
The 100 stocks passing these rules with the highest IAD yield are included in the index at every annual reconstitution, with a maximum of 20 stocks in each country and 35 stocks in each GICS sector. They are weighted based on IAD yield with a maximum of 3% for each constituent and 25% in each country and each sector. The index has a semi-annual review of weight limits and a monthly review of constituent eligibility. Excluded stocks are not replaced until the next reconstitution.
The top 15 holdings, listed below, represent about 24% of asset value.
|
Name |
Ticker |
Weight |
Sector |
Currency |
|
H&R Block, Inc. |
1.95 |
Consumer Discretionary |
USD |
|
|
LTC Properties, Inc. |
1.83 |
Real Estate |
USD |
|
|
Enagas SA |
ENG-ES |
1.77 |
Utilities |
EUR |
|
Keyera Corp. |
KEY-CA |
1.68 |
Energy |
CAD |
|
China Overseas Land & Investment Ltd. |
688-HK |
1.65 |
Real Estate |
HKD |
|
Sino Land Co. Ltd. |
83-HK |
1.62 |
Real Estate |
HKD |
|
South Jersey Industries, Inc. |
1.61 |
Utilities |
USD |
|
|
Capital Power Corporation |
CPX-CA |
1.57 |
Utilities |
CAD |
|
Electric Power Development Co., Ltd. |
9513-JP |
1.57 |
Utilities |
JPY |
|
TC Energy Corporation |
TRP-CA |
1.48 |
Energy |
CAD |
|
Power Assets Holdings Limited |
6-HK |
1.47 |
Utilities |
HKD |
|
New World Development Co. Ltd. |
17-HK |
1.45 |
Real Estate |
HKD |
|
KT & G Corporation |
033780-KR |
1.42 |
Consumer Staples |
KRW |
|
Takeda Pharmaceutical Co. Ltd. |
4502-JP |
1.41 |
Health Care |
JPY |
|
APA Group |
APA-AU |
1.38 |
Utilities |
AUD |
Hereafter, I will compare WDIV with its close competitor First Trust Dow Jones Global Select Dividend Index Fund (FGD) regarding portfolio structure, valuation and performance. FGD has a distribution yield of about 6.5% and was reviewed here.
Both funds are close in size segmentation, with about 85% of their portfolios in large and mid-cap companies.
WDIV vs. FGD (size segments) (chart: author; data: Fidelity)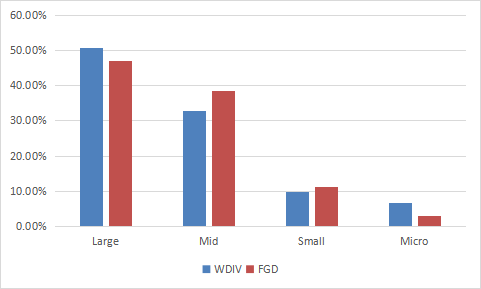
However, country weights are very different. WDIV overweight the U.S. and Canada, which represent together about 42% of asset value. South Korea, the heaviest country in FGD, is ignored by WDIV, along with Australia and Italy. Switzerland, China and France are parts of WDIV and ignored by FGD. China and Hong Kong together represent 13.5%: this exposure to geopolitical and regulatory risks must be taken into account by investors.
WDIV vs. FGD (countries) (author; data: Fidelity)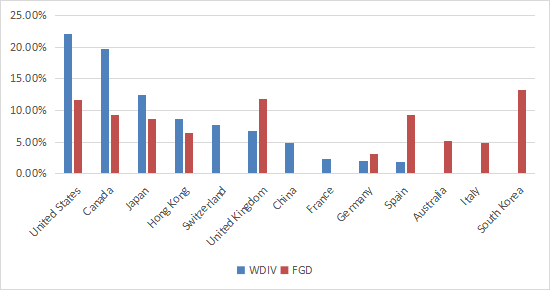
WDIV is better diversified across sectors than FGD. No sector weighs more than 23%, whereas FGD has almost 43% in financials. WDIV’s heaviest sector still is financials though, followed by utilities and real estate. These three sectors represent over 60% of asset value in aggregate, whereas no other sector weighs more than 7%.
WDIV vs. FGD (sectors) (chart: author; data: Fidelity)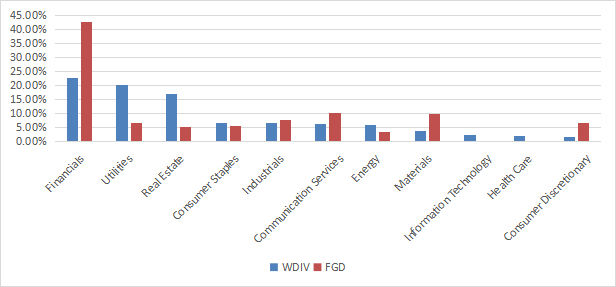
WDIV looks more expensive than FGD regarding the usual valuation metrics (see next table), but this may be an illusion due to sector bias: financials, which are much heavier in FGD, have naturally lower and less reliable ratios.
|
WDIV |
FGD |
|
|
Price/Earnings TTM |
11.24 |
6.19 |
|
Price/Book |
1.12 |
0.81 |
|
Price/Sales |
1.04 |
0.67 |
|
Price/Cash Flow |
8.31 |
5.08 |
Past performance
The next table compares performance and risk metrics since June 2013 for WDIV, FGD and another high-yield international ETF: the Global X SuperDividend ETF (SDIV), reviewed here.
|
Since June 2013 |
Total Return |
Annual.Return |
Drawdown |
Sharpe Ratio |
Volatility |
|
WDIV |
53.41% |
4.81% |
-40.11% |
0.35 |
15.35% |
|
FGD |
42.01% |
3.93% |
-43.26% |
0.3 |
16.95% |
|
SDIV |
-17.44% |
-2.08% |
-56.62% |
-0.01 |
19.93% |
Here, WDIV is a clear winner, and it is also safer regarding past drawdowns and volatility. SDIV is in loss due to a steep capital decay.
In the same period of time, the S&P 500 has returned 181% (12% annualized).
WDIV share price is close to flat since inception:
WDIV share price (TradingView on Seeking Alpha)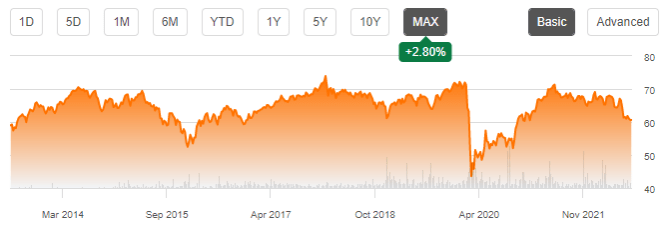
Distributions have also been quite stable ($2.58 in 2015, $2.75 in 2021). However, both capital and income streams have shrunk a bit after inflation adjustment.
Takeaway
WDIV holds 94 stocks of international dividend aristocrats with high dividend yields. About 42% of asset value is in companies listed in the U.S. and Canada. Over 60% of the portfolio is in three sectors: financials, utilities and real estate. The fund beats its competitors FGD and SDIV since inception, with a lower risk measured in drawdown and volatility. However, it lags the S&P 500 by far. WDIV’s geographical concentration in North America is an inconvenient for investors seeking diversification and a global equity exposure. Its weight in financials and an underwhelming total return since inception don’t make it very attractive either. For transparency, a dividend-oriented part of my equity investments is split between a passive ETF allocation and my actively managed Stability portfolio (14 stocks), disclosed and updated in Quantitative Risk & Value.
Be the first to comment