

EtiAmmos
Stocks rallied for the second day in a row after the S&P 500 bounced off of technical support at 3,900, but the major market indexes oscillated between gains and losses throughout the day before closing near their highs, as Chairman Powell continued his tough talk on inflation in a speech at a Cato Institute conference. Despite interest rates edging higher on his insistence that the Fed won’t flinch “until the job is done,” the dollar weakened from its recent highs after the European Central Bank raised its benchmark rate by 75 basis points. That was clearly the catalyst for all the green on my screens, but I was also encouraged by one comment from Chairman Powell during his speech.
Finviz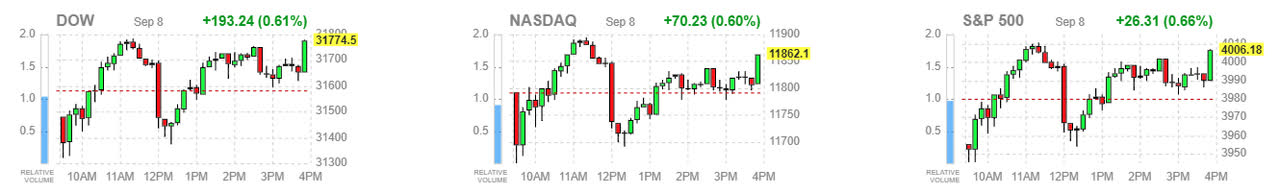
He said that “history cautions strongly against prematurely loosening policy.” No one is expecting the Fed to loosen policy next year, so I found it odd that he would bring that up. It was a reminder that Powell is still a dove at heart. He and other Fed officials are obsessed with keeping inflation expectations anchored by inundating investors with hawkish rhetoric, but they have largely won that battle. In fact, the one-year breakeven inflation rate, which is a closely watched bond-market gauge, has fallen below the Fed’s 2% target for the first time in two years. This is consistent with my forecast for the rate of inflation to fall within a range of 2-3% by next summer. Today, investors are myopically focused on what Chairman Powell and other Fed officials are saying when they should be more concerned with what they actually do.
Bloomberg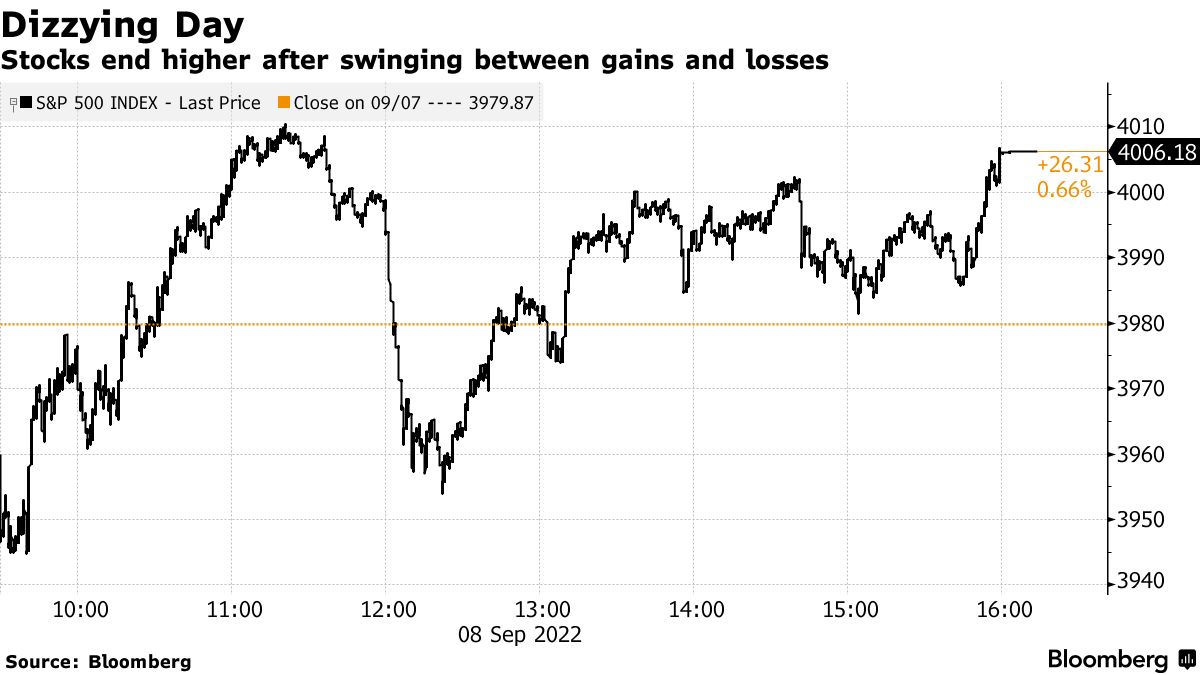
The Fed will most likely increase its benchmark rate by 75 basis points to 3% at its next meeting, as that is what the consensus expects. While the Fed’s rhetoric is unlikely to change, I expect it will become far more data-dependent in its decision-making, resulting in one or two much smaller rate increases. This is because we are likely to see a more meaningful decline in the rate of inflation between now and year-end. The CPI report for August will come next week. There are more signs every day that the rate of inflation will fall over the coming 12-18 months as fast as it rose over the past 12-18 months. The latest indicator is the Manheim Used Vehicle Value Index, which shows that wholesale used vehicle prices declined 4% from July to August. While they remain 8.4% higher than a year ago, the monthly declines are bound to lead to an annualized decline at some point very soon.
Manheim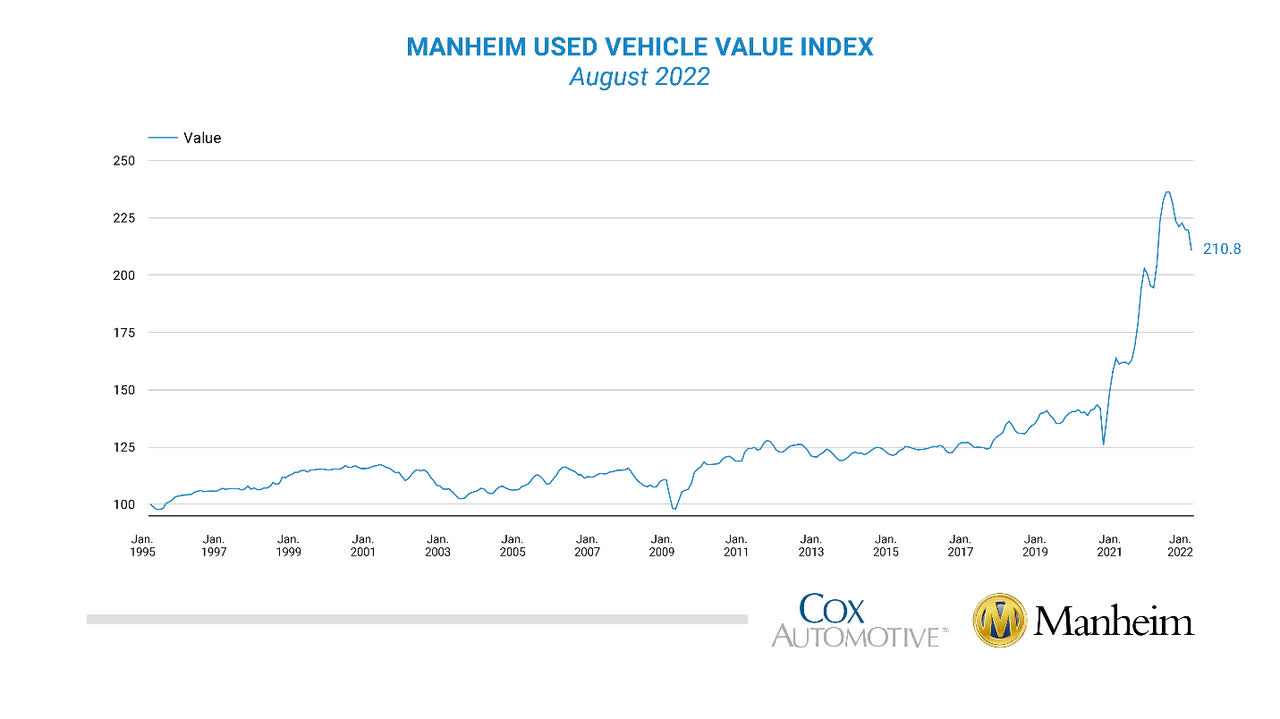
This is just one component of the inflation index, but the chart for used vehicles looks very much like the chart for the entire index. These price declines are primarily a function of the free market rebalancing supply and demand, but the increase in market rates is also starting to weigh on prices, as we are seeing in housing, and the Fed’s monetary policy tightening has yet to fully work through the economy. This is why I think the peak in the Fed funds rate will come sooner and at a lower level than the consensus now expects. While the Fed maintains its hawkish rhetoric to anchor inflation expectations, it will no longer see the need to tighten policy as aggressively once the downtrend in prices accelerates.
StockCharts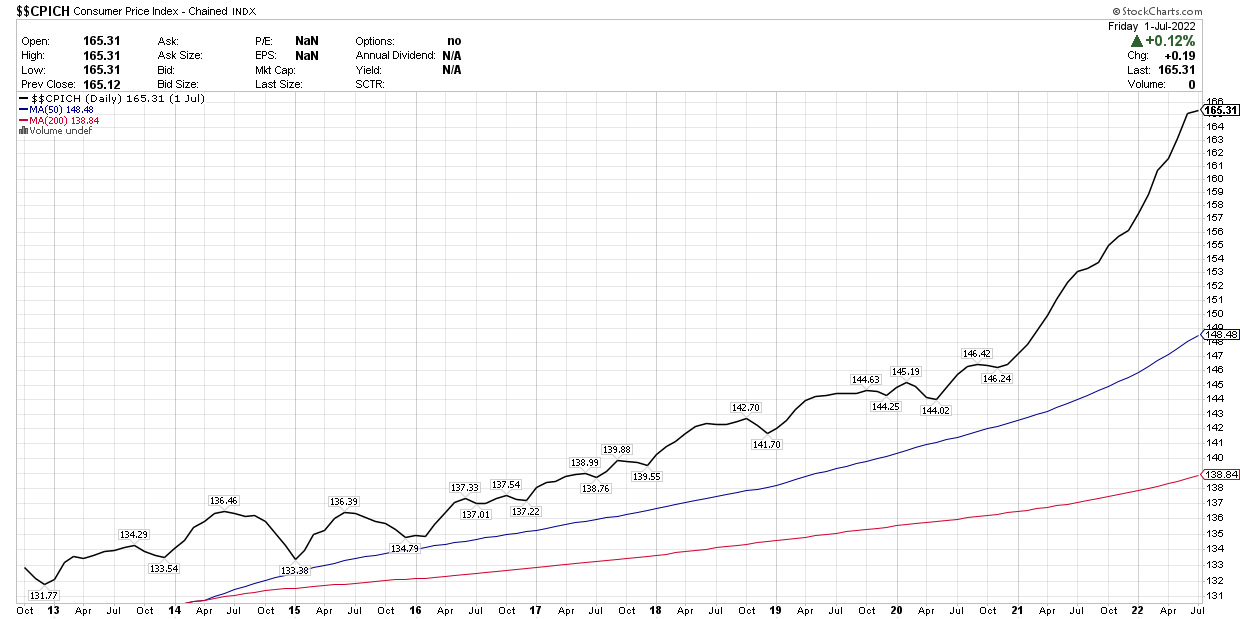
The Fed will grow increasingly concerned about recession, as its concern about inflation abates. It has acknowledged that monetary policy works with a lag and that it runs the risk of overtightening. As the rate of inflation falls under increasingly difficult year-over-year comparisons, we should see both short- and long-term interest rates level off. As foreign central banks catch up with the Fed in tightening their respective monetary policies, we should see the ascent of the dollar stall out.
This is why I remain bullish on risk assets through the remainder of this year. Investor sentiment is focused on what the Fed is saying, while my outlook is based on what the Fed is most likely to do. This means that stocks can climb a wall of worry from bearish extremes that are more consistent with market bottoms than tops.
AAII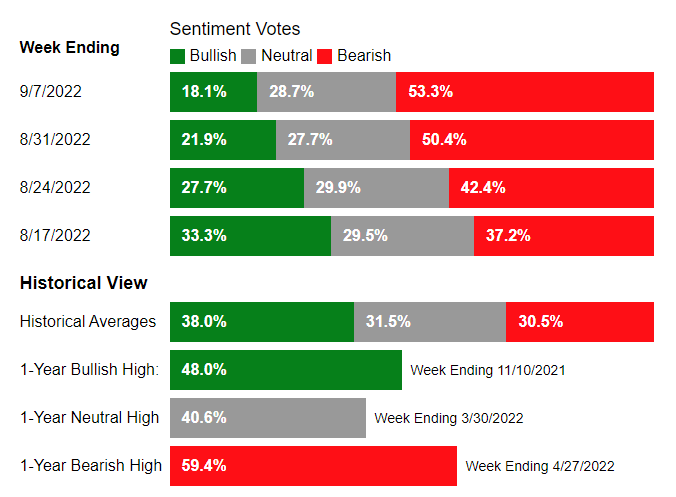
The Technical Picture
According to plan, the S&P 500 ran into resistance at its 200-day moving average, which coincided with an overbought reading of 70+ on its relative strength index, in what I viewed as a pause to refresh. It found support at 3,900, which was close to an oversold reading on its relative strength index, but below where I saw support at its 50-day moving average. I now expect the index to retake its 50-day in a construction higher bottom from its June bear-market low.
StockCharts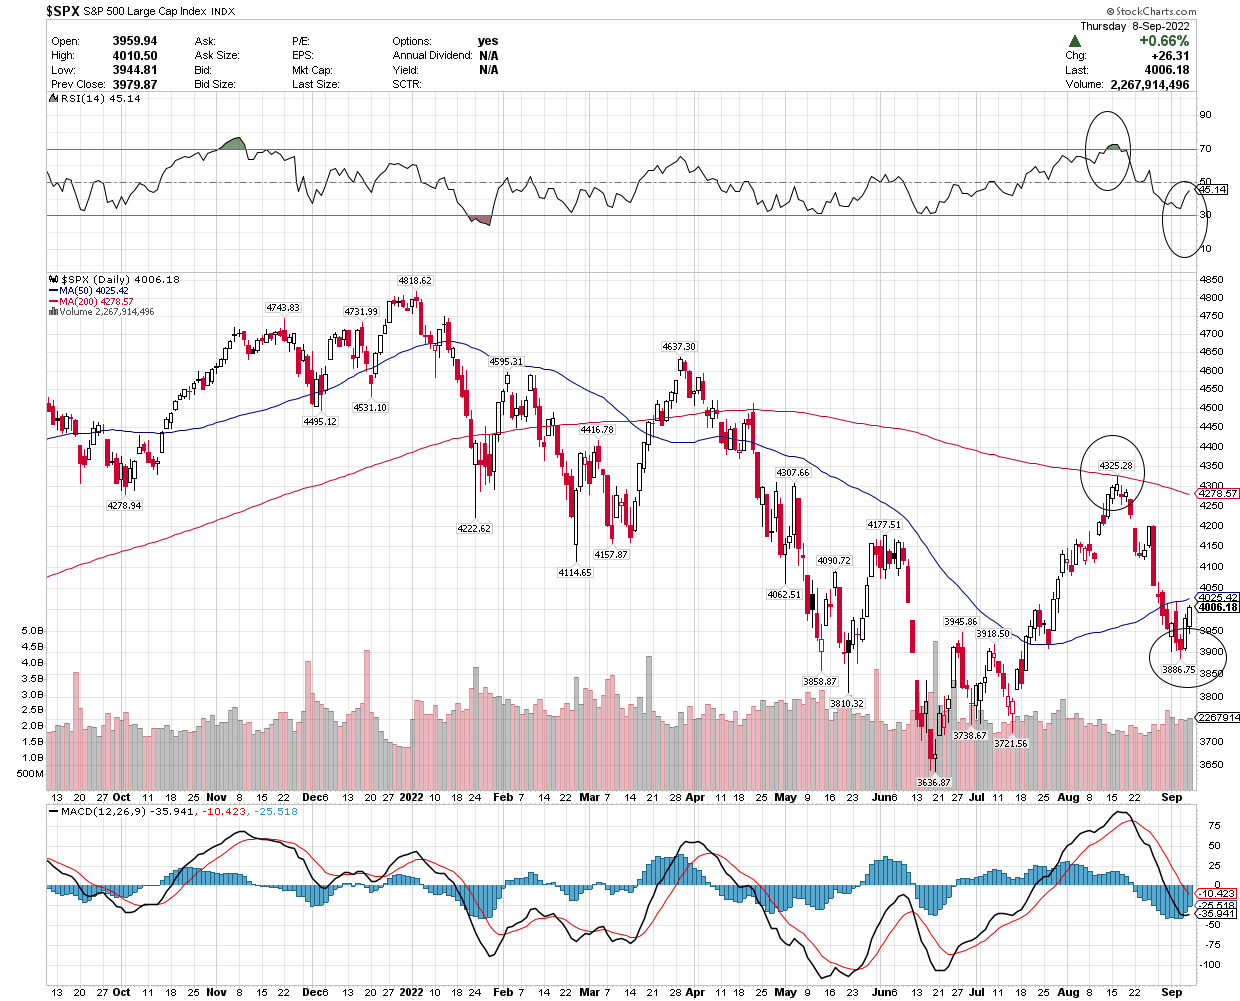
Be the first to comment