

Wolterk
General Mills (NYSE:GIS) produces a diverse range of name-brand packaged foods. GIS brands include household names including Annie’s, Pillsbury, Betty Crocker, Progresso, Nature Valley, Old El Paso, Yoplait, and Haagen-Dazs. One might expect that high inflation and supply chain disruptions would be significant headwinds for General Mills, but earnings have not suffered. In the most recent quarterly results, for Q1 of FY 2023 reported on September 21, 2022, the company reported adjusted operating profit up 8% and adjusted diluted EPS up 13% (see slide 5). GIS, like a number of other major names in packaged foods, has been able to raise prices sufficiently to more than offset inflation in input prices (ingredients). Additionally, higher prices at restaurants have led to families eating more meals at home, which is positive for GIS. Overall, rising inflation has corresponded to high earnings for GIS, and the share price is up almost 30% over the past 12 months.
Seeking Alpha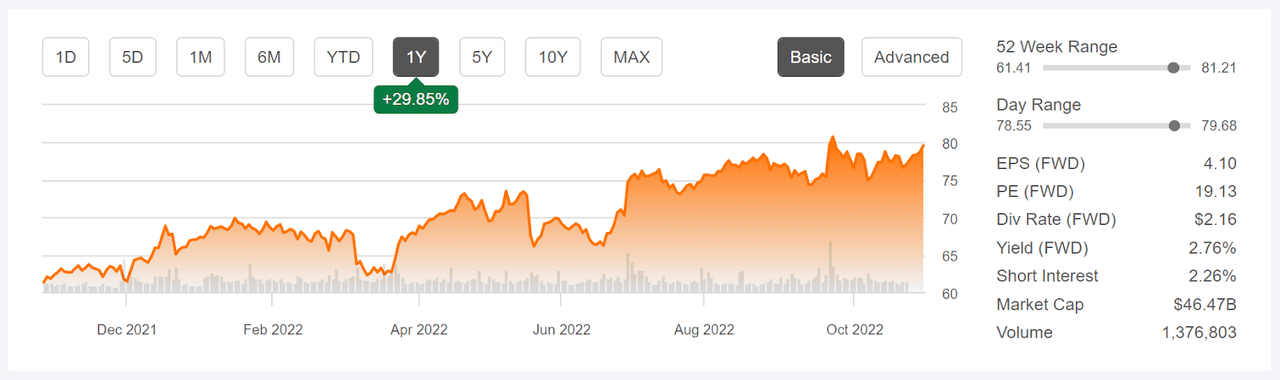
12-Month price history and basic statistics for GIS (Source: Seeking Alpha)
With the huge rally so far in 2022, GIS has returned a total of 18.7% per year over the past 3 years, as compared to 7.6% per year for the packaged food industry as a whole (as tracked by Morningstar) and 8.2% per year for the Consumer Staples Select Sector SPDR ETF (XLP), and 10% per year for the S&P 500 (SPY).
GIS’ FY 2023 Q1 earnings per share (EPS) was more than 10% higher than the EPS for Q1 of 2022 and 2021, which were both markedly above the Q1 EPS for 2019. The consensus expected EPS growth over the next 3 to 5 years is 7% per year. This level of earnings growth is well above the dividend growth rate in recent years (2.3% 3-year and 1.6% 5-year) and would be expected to strengthen the company’s balance sheet. This, in turn, will be an advantage if the U.S. economy enters a recession.
ETrade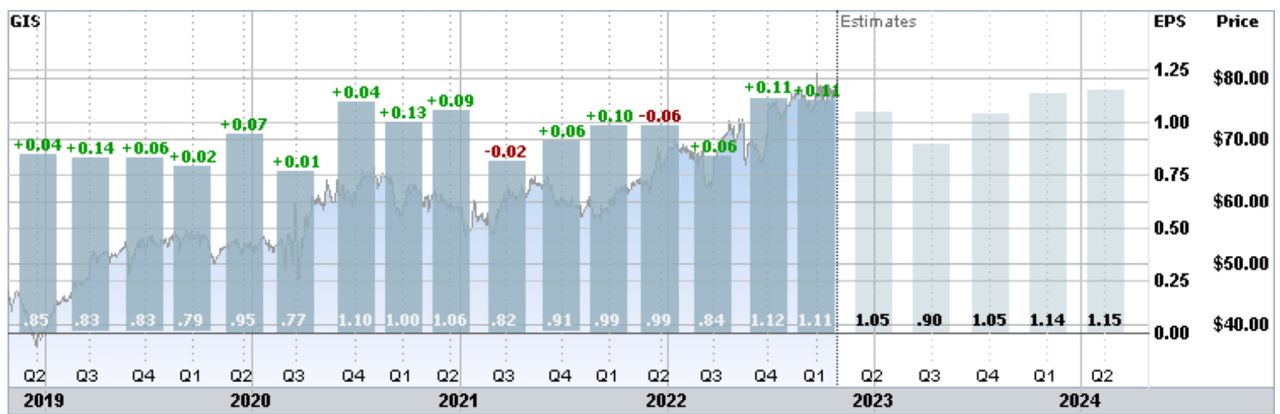
Historical (4 years) and estimate future quarterly EPS for GIS. Green (red) values are amounts by which EPS beat (missed) the consensus expected value (Source: ETrade)
Broadly speaking, it is expected that some customers will switch products (substitution) in response to rising prices. This is considered to be a particular threat to name-brand products when there are generic alternatives. Thus far, in this rising inflation environment, GIS has been able to maintain market share even as it has increased prices.
I last wrote about GIS on March 2, 2022, almost 8 months ago, at which time I maintained a neutral / hold rating on the shares. From the close of that date until today, GIS has returned a total of 20.6%, as compared to -3% for the Consumer Staples Select Sector SPDR and -12.2% for the S&P 500. As of March 2nd, the Wall Street consensus rating for GIS was a hold and the consensus 12-month price target was right at the share price at that time. In other words, Wall Street consensus implied no price appreciation over the next year. GIS has a TTM P/E of 18.6, somewhat higher than the 5-year average of 16.6. The market-implied outlook, a probabilistic price forecast that reflects the consensus view from the options market, was bullish to mid-July of 2022 and neutral to mid-January of 2023. I underweighted the bullish near-term market-implied outlook in my overall assessment, leading me to assign a neutral rating, and that decision looks ill-advised in retrospect.
For readers who are unfamiliar with the market-implied outlook, a brief explanation is needed. The price of an option on a stock is largely determined by the market’s consensus estimate of the probability that the stock price will rise above (call option) or fall below (put option) a specific level (the option strike price) between now and when the option expires. By analyzing the prices of call and put options at a range of strike prices, all with the same expiration date, it is possible to calculate a probabilistic price forecast that reconciles the options prices. This is the market-implied outlook. For a deeper explanation and background, I recommend this monograph published by the CFA Institute.
I have calculated updated market-implied outlooks for GIS and compared these with the current Wall Street consensus outlook in revisiting my rating.
Wall Street Consensus Outlook
ETrade calculates the Wall Street consensus outlook for GIS using the views of 12 ranked analysts who have published price targets and ratings within the past 3 months. The consensus rating is neutral, and the consensus 12-month price target implies a 2.2% price drop over the next year. At the start of March 2022, the 12-month consensus price target was $67.33. Wall Street was not anticipating that GIS would thrive as inflation spiked.
ETrade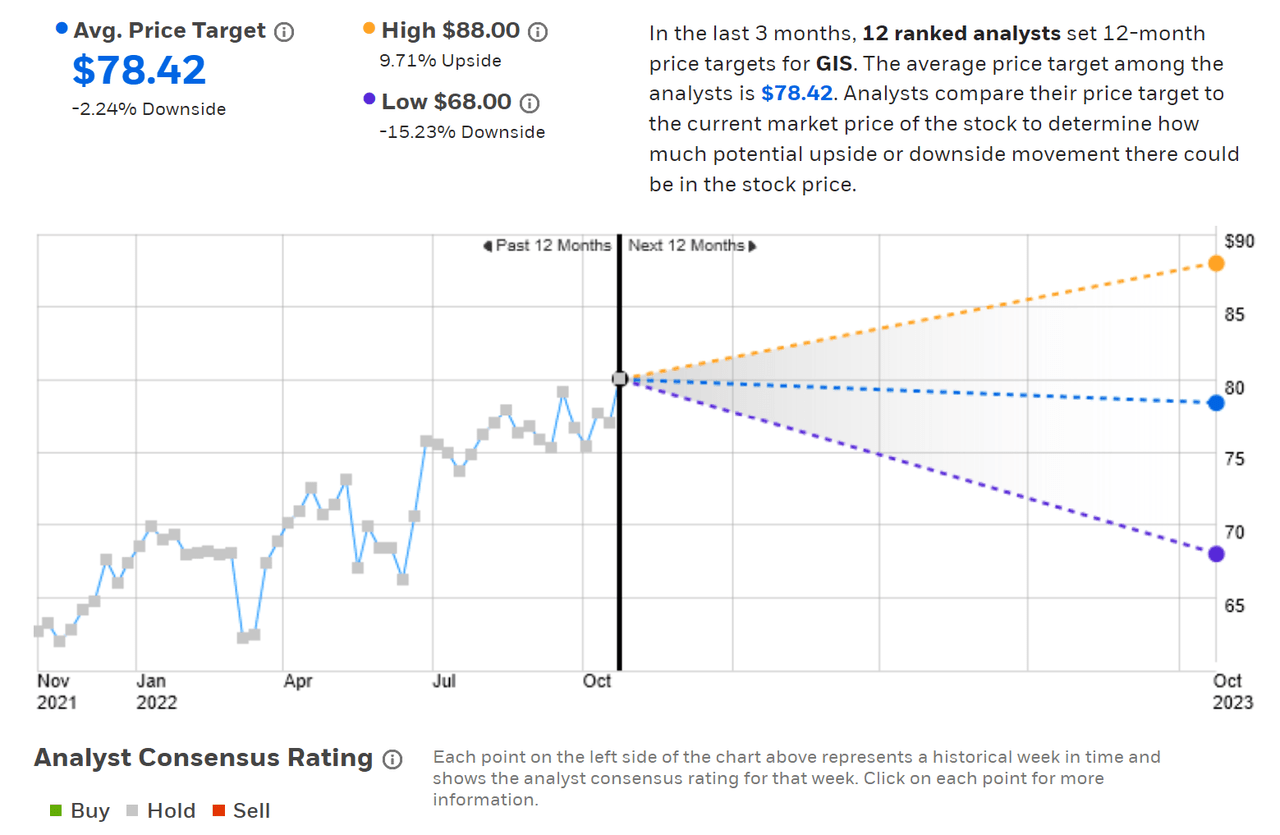
Wall Street analyst consensus rating and 12-month price target for GIS (Source: ETrade)
Seeking Alpha’s version of the Wall Street consensus outlook uses price targets and ratings from 19 analysts who have published opinions over the past 90 days. The consensus rating is a hold, as has been the case for all of the past 3 years. The consensus 12-month price target is 3.5% below the current share price. According to Seeking Alpha’s numbers, there has never been a consensus buy rating on GIS over the past 3 years. This is notable, in retrospect, because GIS’ trailing 3-year annualized return is so much higher than that of the S&P 500.
Seeking Alpha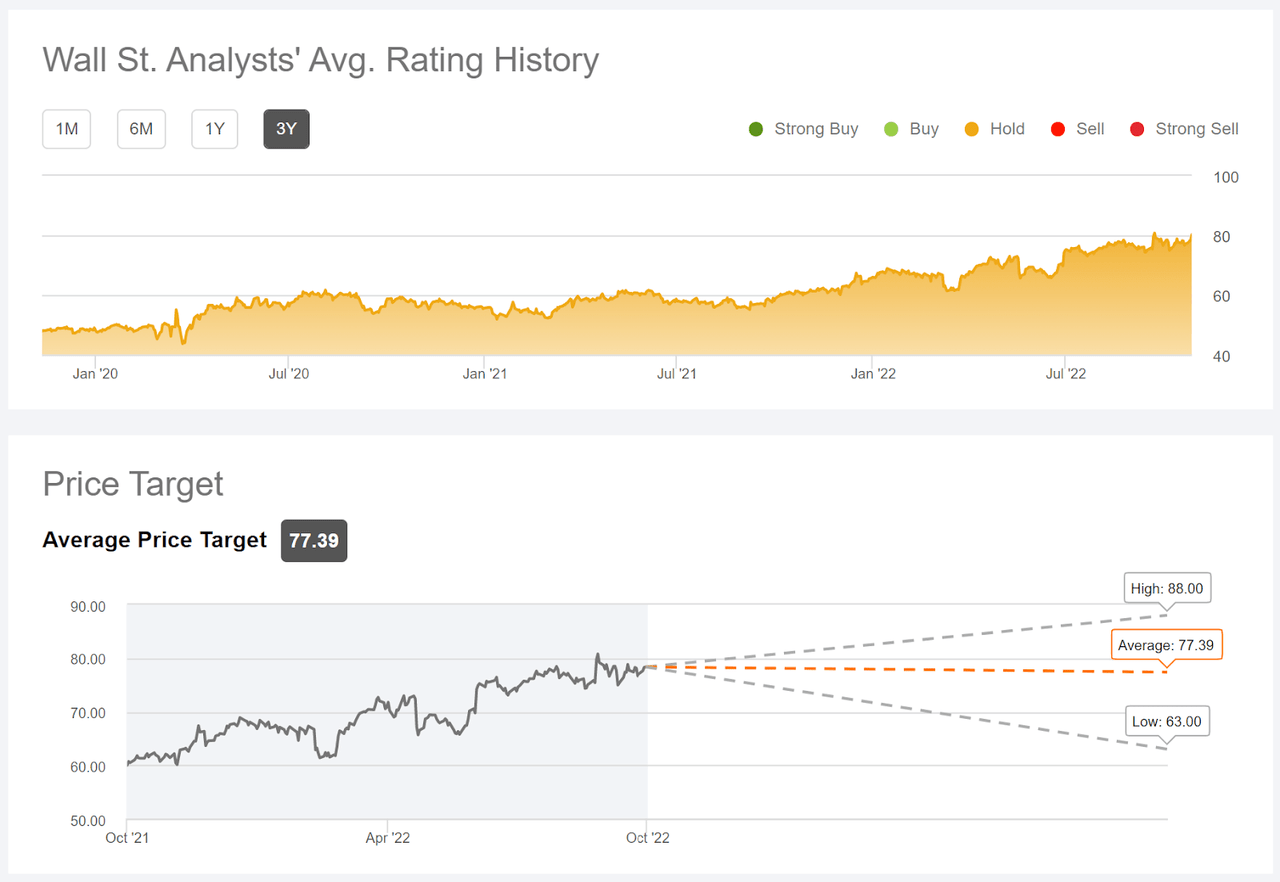
Wall Street analyst consensus rating and 12-month price target for GIS (Source: Seeking Alpha)
The Wall Street consensus outlook for GIS is quite similar to the results from March, with a neutral rating and a 12-month price target that is very close to the current share price. On one hand, it appears that the prevailing Wall Street view has underestimated GIS’ growth potential. On the other hand, most of the outperformance in the past 3 years has come in the past year, as inflation has shot up to multi-decade highs.
Market-Implied Outlook for GIS
I have calculated the market-implied outlook for GIS for the 2.8-month period from now until January 20, 2023 and for the 7.6-month period from now until June 16, 2023, using the prices of put and call options that expire on these dates. I selected these two expiration dates to provide a view through the end of 2022 and to the middle of 2023.
The standard presentation of the market-implied outlook is a probability distribution of price return, with probability on the vertical axis and return on the horizontal.
Geoff Considine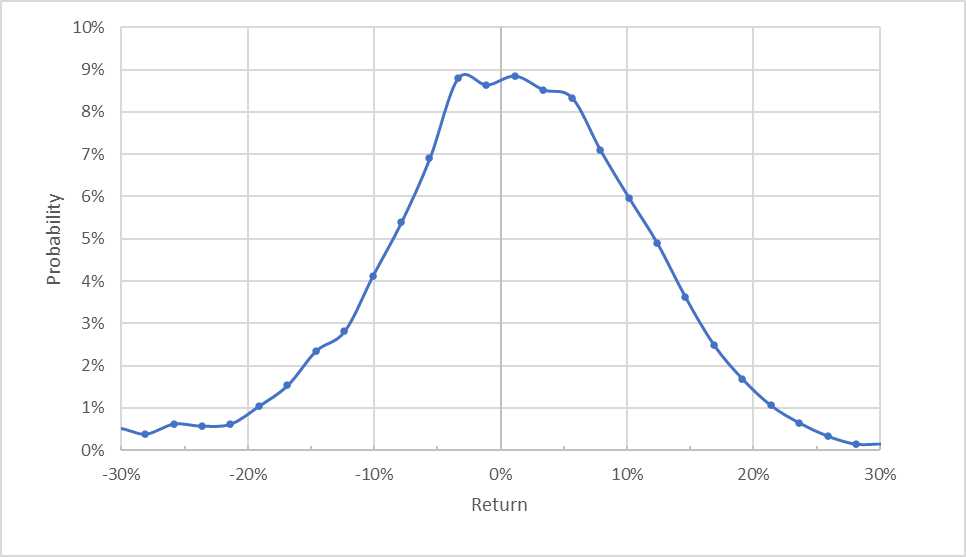
Market-implied price return probabilities for GIS for the 2.8-month period from now until January 20, 2023 (Source: Author’s calculations using options quotes from ETrade)
The outlook to January 20, 2023 has a broad peak in probability, generally centered around a return of 0%, but there is a tilt in the probabilities that favors positive returns. Compare the probability of having a +10% return to the probability of a -10% return, for example. The expected volatility calculated from this outlook is 24.0% (annualized), which is very low for an individual stock and identical to the expected volatility calculated back in March.
To make it easier to compare the relative probabilities of positive and negative returns, I rotate the negative return side of the distribution about the vertical axis (see chart below).
Geoff Considine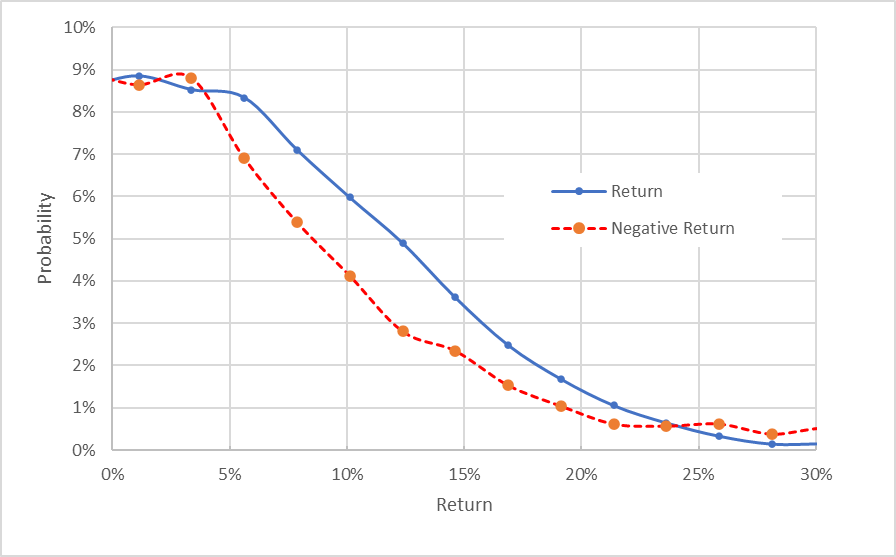
Market-implied price return probabilities for GIS for the 2.8-month period from now until January 20, 2023. The negative return side of the distribution has been rotated about the vertical axis (Source: Author’s calculations using options quotes from ETrade)
This view makes it much easier to see the positive (bullish) tilt in the market-implied outlook. The probability of positive returns is consistently higher than the probability of having negative returns of the same magnitudes (the solid blue line is above the dashed red line over almost all of the chart above). This is a bullish outlook for the next 2.8 months.
Theory indicates that the market-implied outlook is expected to have a negative bias because investors, in aggregate, are risk averse and thus tend to pay more than fair value for downside protection. There is no way to measure the magnitude of this bias, or whether it is even present, however. The expectation of a negative bias reinforces the bullish interpretation of this outlook.
The market-implied outlook for the 7.6 months from now until June 16, 2023 is also markedly bullish. The expected volatility calculated from this outlook is 24.3% (annualized).
Geoff Considine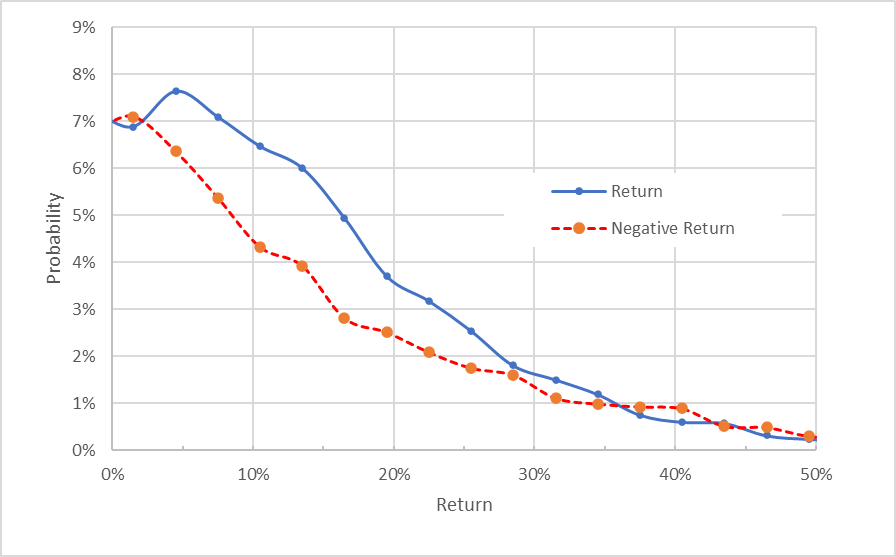
Market-implied price return probabilities for GIS for the 7.6-month period from now until June 16, 2023. The negative return side of the distribution has been rotated about the vertical axis (Source: Author’s calculations using options quotes from ETrade)
Back at the start of March, the market-implied outlook for GIS was bullish to the middle of 2022 and neutral to early 2023. The updated market-implied outlooks are consistently bullish to early- and mid-2023. The expected volatility continues to be low.
Summary
General Mills has managed to maintain and grow margins in the face of high inflation and supply chain disruptions. The company has demonstrated considerable pricing power, as customers are willing to pay higher prices for GIS products rather than choosing cheaper alternatives. GIS’ EPS over the past 3 quarters was higher than for the same quarters of the previous year. The Wall Street analysts have underestimated GIS, maintaining a hold rating even as earnings have been robust. Although the consensus price target has risen over the year, the expected price appreciation implied by the consensus 12-month price target is slightly negative. The market-implied outlook is bullish to mid-January and to mid-June of 2023, with low expected volatility. These outlooks are considerably more favorable than back at the start of March. While GIS is quite expensive relative to earnings, high consumer prices are likely to persist and the company is demonstrating the ability to thrive in this environment. I am changing my rating on GIS to a buy.
Be the first to comment