

Francisco Javier Ortiz Marzo/iStock via Getty Images
When the S&P 500 (SPY) and NASDAQ (QQQ) drop by more than 2% on the release of a single macro data point, you know the print was a big miss to expectations. In this case, the August CPI came in hotter than expected at 8.3% compared to the consensus for a lower number at 8.1%. More importantly, the month-over-month level climbed higher to +0.1% which was a real shocker compared to the market estimate for a -0.1% decline.
We were looking for a much lower inflation setup and it appears the jump in core services beyond energy was the biggest disappointment. There’s no way around it. This was a bad miss considering the stakes compared to the narrative that had been gaining momentum going back to June and July of “peak inflation”.
FXStreet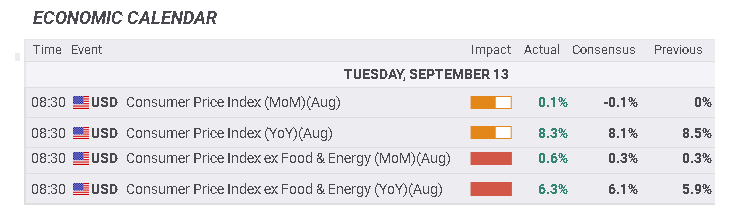
When digging down through the underlying CPI data, the takeaway is that the trends are structural and deeply ingrained. We were particularly surprised by the 0.5% m/m increase in transportation services prices. This category captures things like airline tickets and rental car prices. Even as the cost of fuel has declined sharply from highs in June, operators continued to push average pricing higher through August.
The 0.7% m/m spike in shelter prices was also the hottest all year which captures home rents along with categories like hotel accommodations continued to rise. One read is that a late summer travel boom, boosted by lower gas prices added to the inflation momentum. The elevated trend of food prices despite the correction in agricultural inputs and the connection with transportation costs was also a culprit of the big headline miss. Anecdotally in our local area, we’ve seen prices at grocery stores and big box retailers pull back with recent sales, although it wasn’t reflective of the national average.
U.S. Bureau of Labor Statistics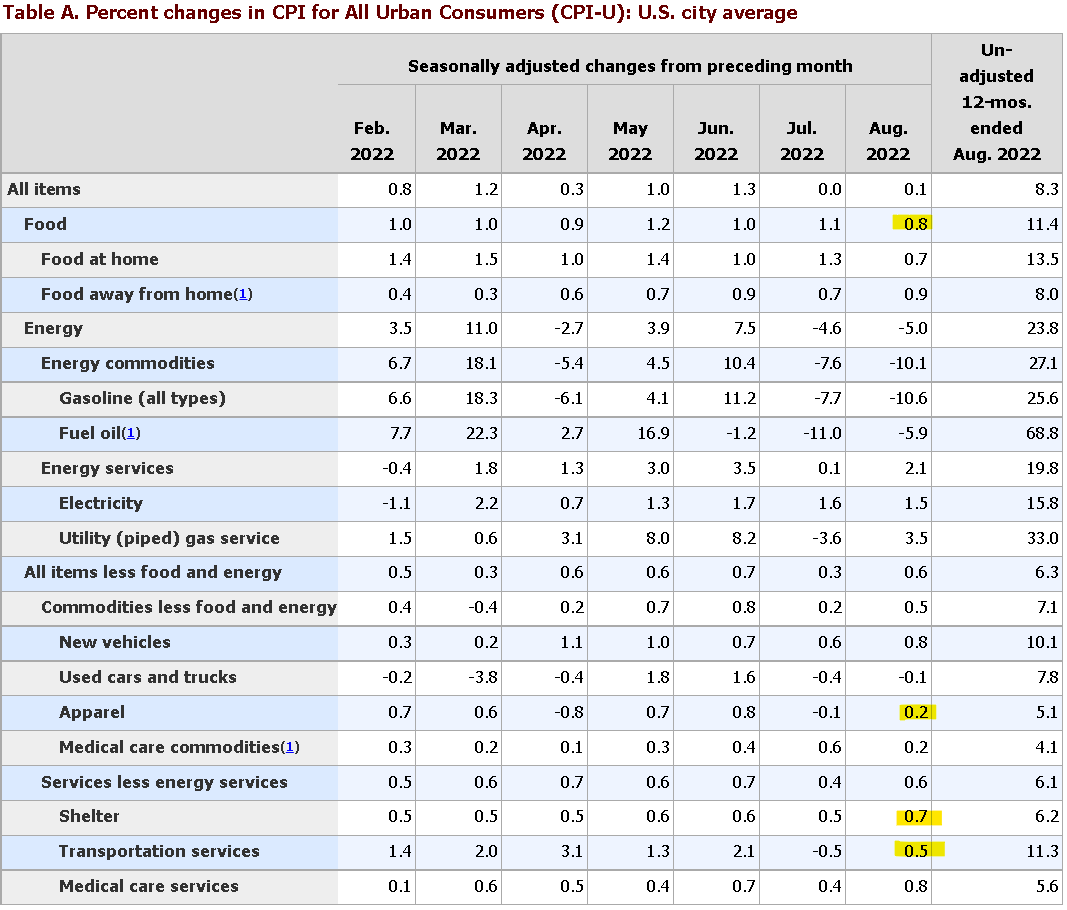
What’s Next For Stocks
For investors, our message here is to reduce risk. We may very well see a lower CPI number over the next few months but the damage here is done. The first implication is that the FED remains on track for an aggressive rate hike at the September FOMC set for later this month.
The messaging from Chairman Powell to expect further rate hikes got reinforced today. A 50 to 75 basis point hike was already a lock for this meeting, but the August CPI data now puts a potential 100 basis point increase on the table. The interest policy path forecast into 2023 likely also gets a bump higher. Higher inflation for longer means that interest rates have room to climb.
As it relates to stocks and other risk assets, more uncertainty regarding economic conditions translates directly into market volatility. If there is any good news for investors, SPX is still trading nearly 10% above its June low when it briefly reached 3,650. We’re still at 4,000 but the September low of around 3,880 is the first level of critical support the bulls will need to hold to maintain the uptrend in place over the last three months.
Finviz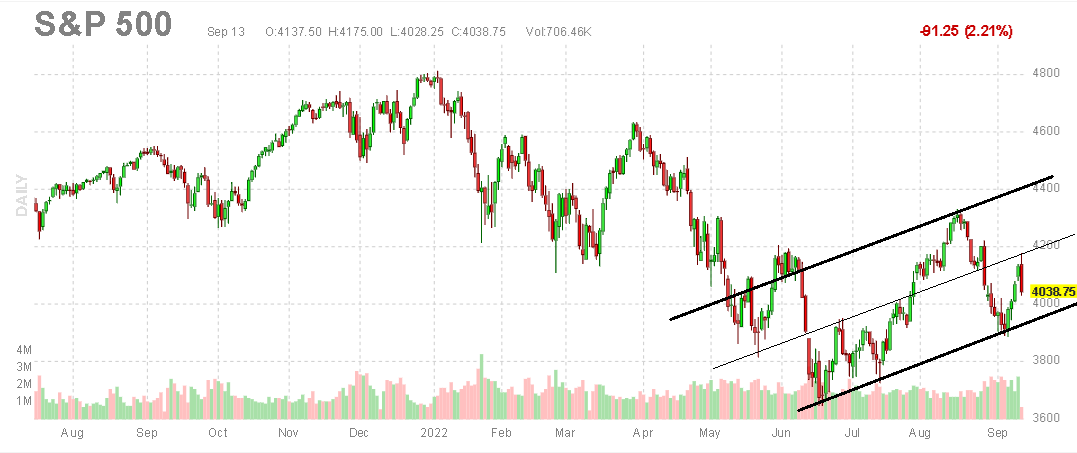
With that, the bigger question here outside of inflation and the direction of interest rates is how is the economy holding up. There is a thought that many companies are benefiting from the drop in energy costs while also realizing higher prices for their services. By this measure, there is still a good read for Q3 earnings among cyclical names that may have seen a boost from consumers saving on gasoline able to divert spending towards other categories.
Indicators across consumer sentiment and the labor market have been resilient in recent months and we expect some of that momentum to continue. The August retail sales data set to be released on Thursday, September 15th can confirm this dynamic.
Bullish on Energy and Commodities
One area of the market we like is the energy sector and broader commodity-focused names. This is a group that was a big winner in the first half of the year as part of the early “inflation trade”, among companies benefiting directly from the trend of higher raw material pricing amid supply chain disruptions. Fast forward, a selloff in oil over the last several months along with a corresponding decline in agriculture and metals prices off their highs was part of the enthusiasm for an expectation that the worst of inflation had passed.
We sense that the correction has gone too far with room now for prices to again rebound higher. WTI crude oil, for example, fell from above $120 a barrel in June down to $81.00 earlier this month. With a view that economic conditions still have some momentum despite rising interest rates, stronger demand can push energy prices higher going forward. An ETF like the SPDR S&P Oil & Gas Exploration & Production ETF (XOP) can lead to the upside in a bullish scenario.
Finviz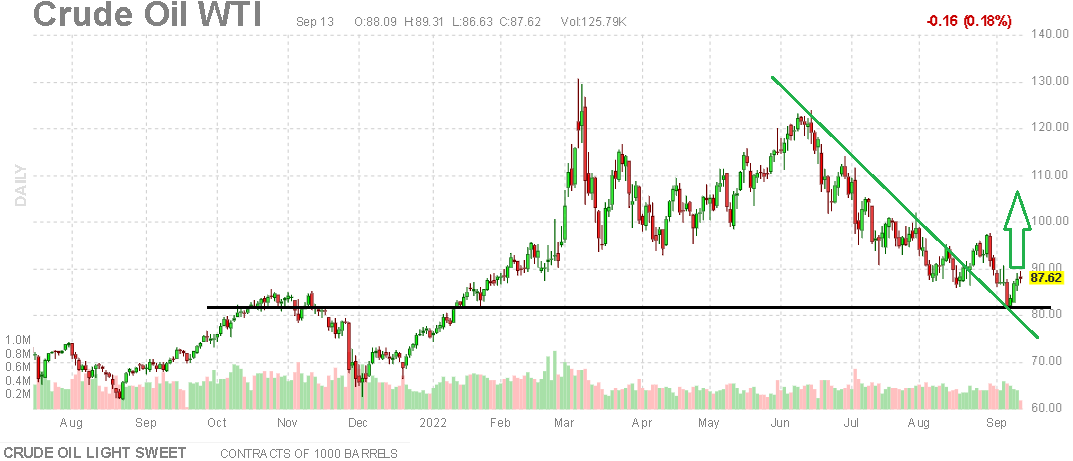
A rebound in energy would create a bigger problem for the FED recognizing it’s the main component of the CPI which is largely out of its control. We didn’t want to believe it, but the risk of a stagflation scenario where inflation remains stubbornly high while economic conditions slow and the labor market unravels is back on the table. This is a situation where even a 100 basis point rate hike from the Fed this month may not necessarily move the needle in terms of effectively stabilizing consumer prices, in our opinion.
Interest Rates Going Higher
The other call we’re making is an expectation for interest rates at the long end of the curve to continue climbing. The 10-year U.S. Treasury is currently at 3.4%, back near the June high where it approached 3.5%. At this stage, the outlook is that the next leg higher could take the benchmark towards 4% and beyond as the Fed is forced to continue hiking, particularly if energy prices gain momentum. Naturally, this is deeply bearish for bond funds with floating rate instruments and cash as the only place providing some solace.
CNBC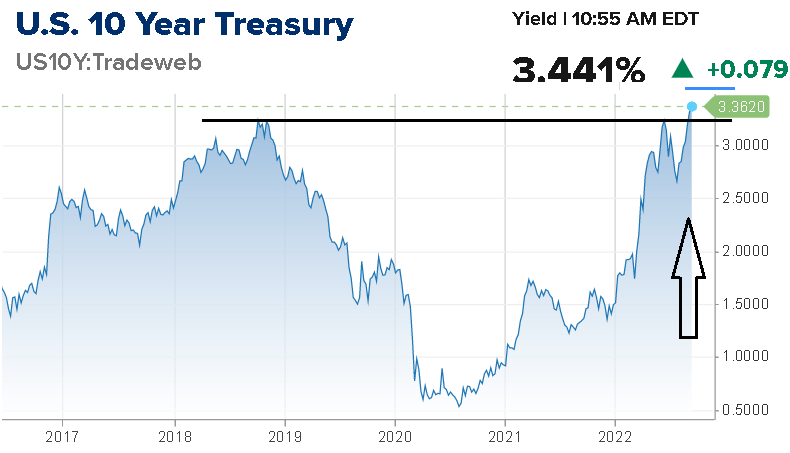
Take a look at the ProShares Short 20+ Year Treasury ETF (TBF) which essentially is a bearish bond fund that climbs alongside long-term Treasury yields. TBF is essentially the inverse of the widely-held iShares 20+ Year Treasury Bond ETF (TLT), which is down nearly 30% this year. In a scenario where the 10 Year Treasury Yield reaches 4%, we can extrapolate a near 20% upside in TBF over the period highlighting its use as a tactical trading instrument. There is also the 2x leveraged version in the ProShares UltraShort 20+ Year Treasury ETF (TBT) that adds a layer of risk.
Seeking Alpha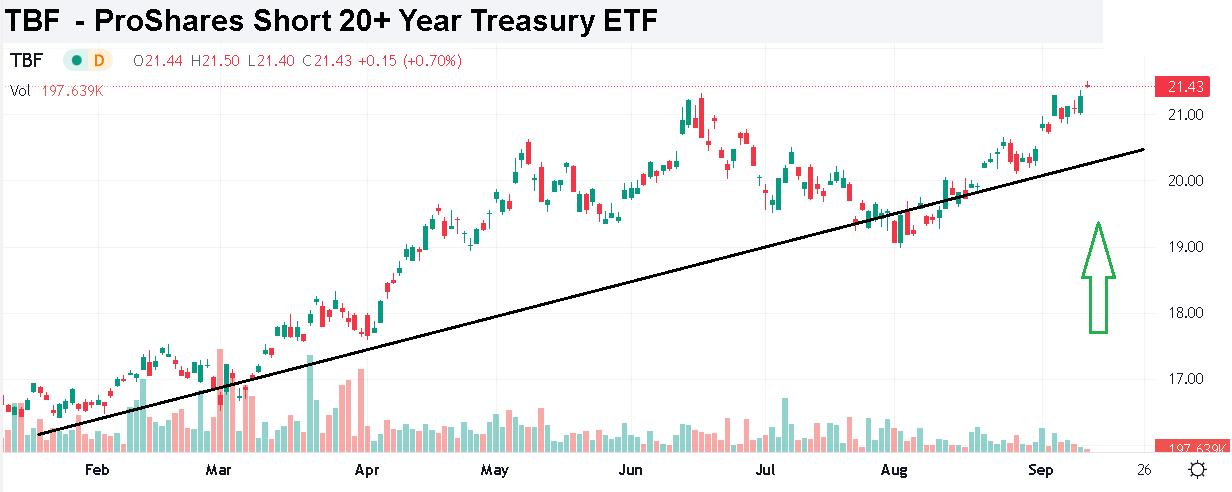
Final Thoughts
The shocking August CPI was enough to pour some cold water on any budding bullish momentum this week. With uncertainty high and a return of volatility, it makes sense to reduce risk exposure either by trimming winners or exiting positions to raise cash. We’ll leave with a more optimistic tone, noting it’s still possible data outperforms going forward; with the turning of inflation lower and a stronger rally in stocks that is simply pushed back a few months.
Be the first to comment