


A Better View From The Office Than A Snarlup On The 101
Samantha Bailey/iStock via Getty Images
DISCLAIMER: This note is intended for US recipients only and, in particular, is not directed at, nor intended to be relied upon by any UK recipients. Any information or analysis in this note is not an offer to sell or the solicitation of an offer to buy any securities. Nothing in this note is intended to be investment advice and nor should it be relied upon to make investment decisions. Cestrian Capital Research, Inc., its employees, agents or affiliates, including the author of this note, or related persons, may have a position in any stocks, security, or financial instrument referenced in this note. Any opinions, analyses, or probabilities expressed in this note are those of the author as of the note’s date of publication and are subject to change without notice. Companies referenced in this note or their employees or affiliates may be customers of Cestrian Capital Research, Inc. Cestrian Capital Research, Inc. values both its independence and transparency and does not believe that this presents a material potential conflict of interest or impacts the content of its research or publications.
Swiss Toni Need Not Apply
When Atlassian Corporation (NASDAQ:NASDAQ:TEAM) was young and at least some Cestrian staff were in short trousers, there were three defining characteristics of the company. One, it sold incredibly low-cost development tools at a time when tooling was still mainly the preserve of large old-line software brands – Rational/IBM, various Java toolsets, Visual Studio/Microsoft and so on. Two, it was Australian yet sold all over the world. Three, and not unconnected to two, it had no enterprise sales team, choosing instead to sell online via the developer community. (This sales model is commonplace today. It was a biiiiig deal in the early 2000s). Four, and very much connected to three, the company had raised no venture capital but had been able to become profitable as a result of founder thriftiness and, you guessed it, the lack of that enterprise sales function. No Presidents’ Club jollies on Maui, no Bentley Convertibles to pay for, and none of the costly and time-consuming HR events that typically form a contrail in the wake of your regular swashbuckling enterprise software sales team.
Fast forward twenty years and the fundamentals remain exceptionally strong. In addition, the beating handed to the stock by the market this year makes the name an attractive buying opportunity in our view.
Let’s take a look at the numbers.
TEAM Stock Key Metrics
TEAM Fundamentals (YCharts.com, Cestrian Analysis)
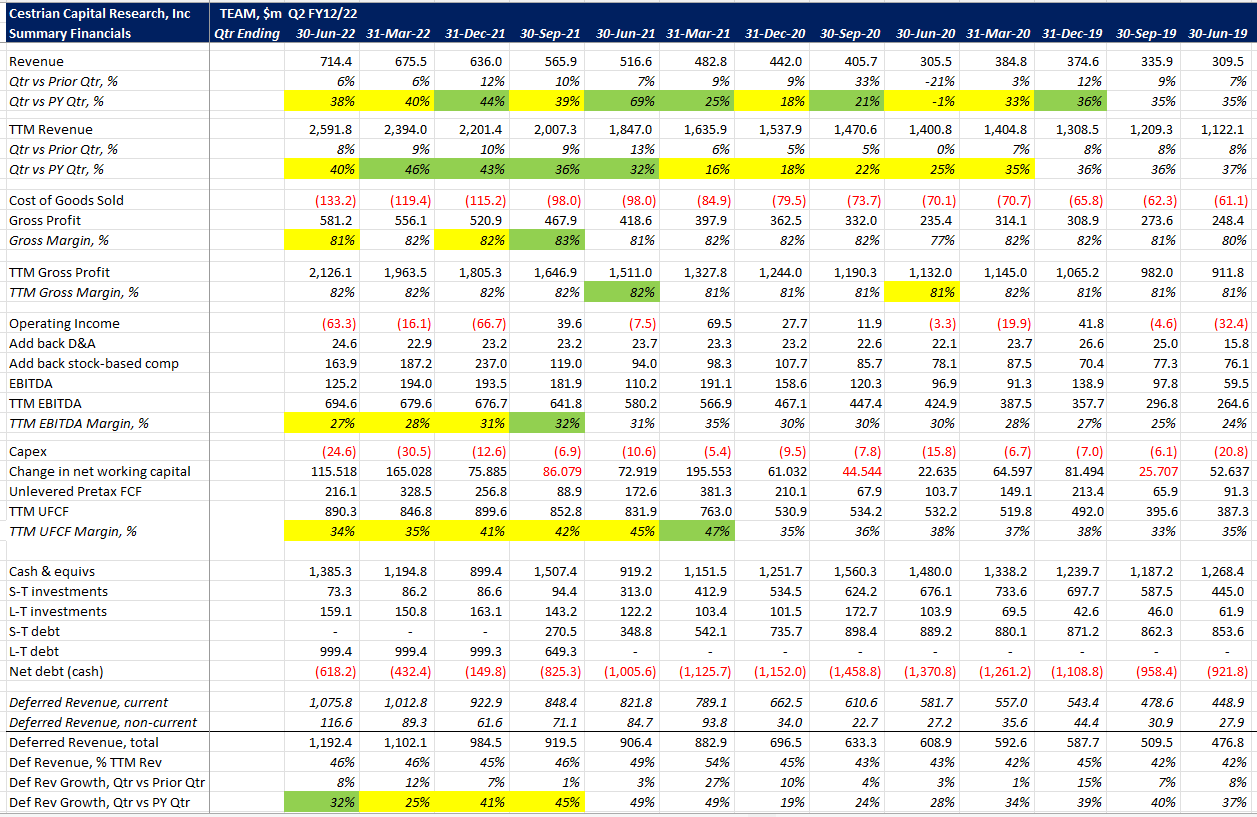
This is a high growth, high margin, highly cash generative company.
TTM revenue growth in the most recent quarter (ending June 30 – that’s the company’s year end, so, Q4 FY6/22) stood at +40%, now on a revenue base of $2.6bn. Not to be sneezed at. Gross margins are high at 82% on a TTM basis – that early no-commission-pay-away DNA remains intact – and the company has exceptionally strong cashflow characteristics. TTM unlevered pretax cashflow consistently exceeds TTM EBITDA – that’s because (i) capex is very low and (ii) the working capital profile is superb – TEAM gets paid by its customers a long time before it starts paying money out to suppliers. You can see that in virtually every quarter of the last three years, change in net working capital was positive, i.e., a cash inflow from the summation of changes in operating assets and liabilities. That again is an echo of those early bootstrapped days. When companies don’t raise big VC early, the careful-with-money characteristics tend to remain, and that’s to the benefit of investors over the long run. You could think of TEAM as a kind of inverse UBER. Uber never saw a dollar in its wallet it didn’t think it should have already spent yesterday; TEAM sees a dollar and thinks – hey that should be three dollars, I need to get Frank the payables clerk to stop giving out money so fast. What does he think – we’re made of money? (And this is why the company has almost $1.5bn in gross cash and liquid securities).
Is TEAM Stock Overvalued?
Well, so far so good. But as everyone knows, high growth software companies with fat cashflow margins are all permanently overvalued. No sane person would pay these kinds of valuations, right? Because 2009 and because 2022 and because 2001 and blah.
Here’s TEAM’s valuation as of the most recent close.
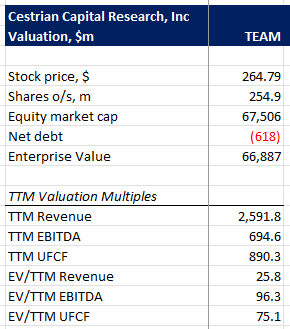
TEAM Valuation (YCharts.com, Cestrian Analysis)
Yikes! 26x TTM revenue after the stock was smacked in the teeth all year. This one won’t be attracting tech bottom-feeders, that’s for sure. It would be easy to walk away from the stock based on those multiples, if you restrict yourself purely to fundamental analysis.
That would be a mistake, in our view. Because if we consider technicals for a moment, we think the stock has great potential; and we think that a protective stop can be placed at a level close enough to actually be protective i.e., hand you a manageable loss if its triggered, rather than just blowing a comedy-sized realized loss in your account when the price momentarily visits your stop order, only to – of course! – reverse back up hard and fast, having dealt you that mortal blow. Which is a common experience of stop-losses in high beta names unless you are buying them near the lows.
Let’s look at the chart to learn more.
Atlassian Stock 2022 And Beyond Forecast
Here’s how we see the story of the stock in recent years. This is the zoomed-out version. We’ll zoom in thereafter. (You can open a full-page version of this chart – here.)
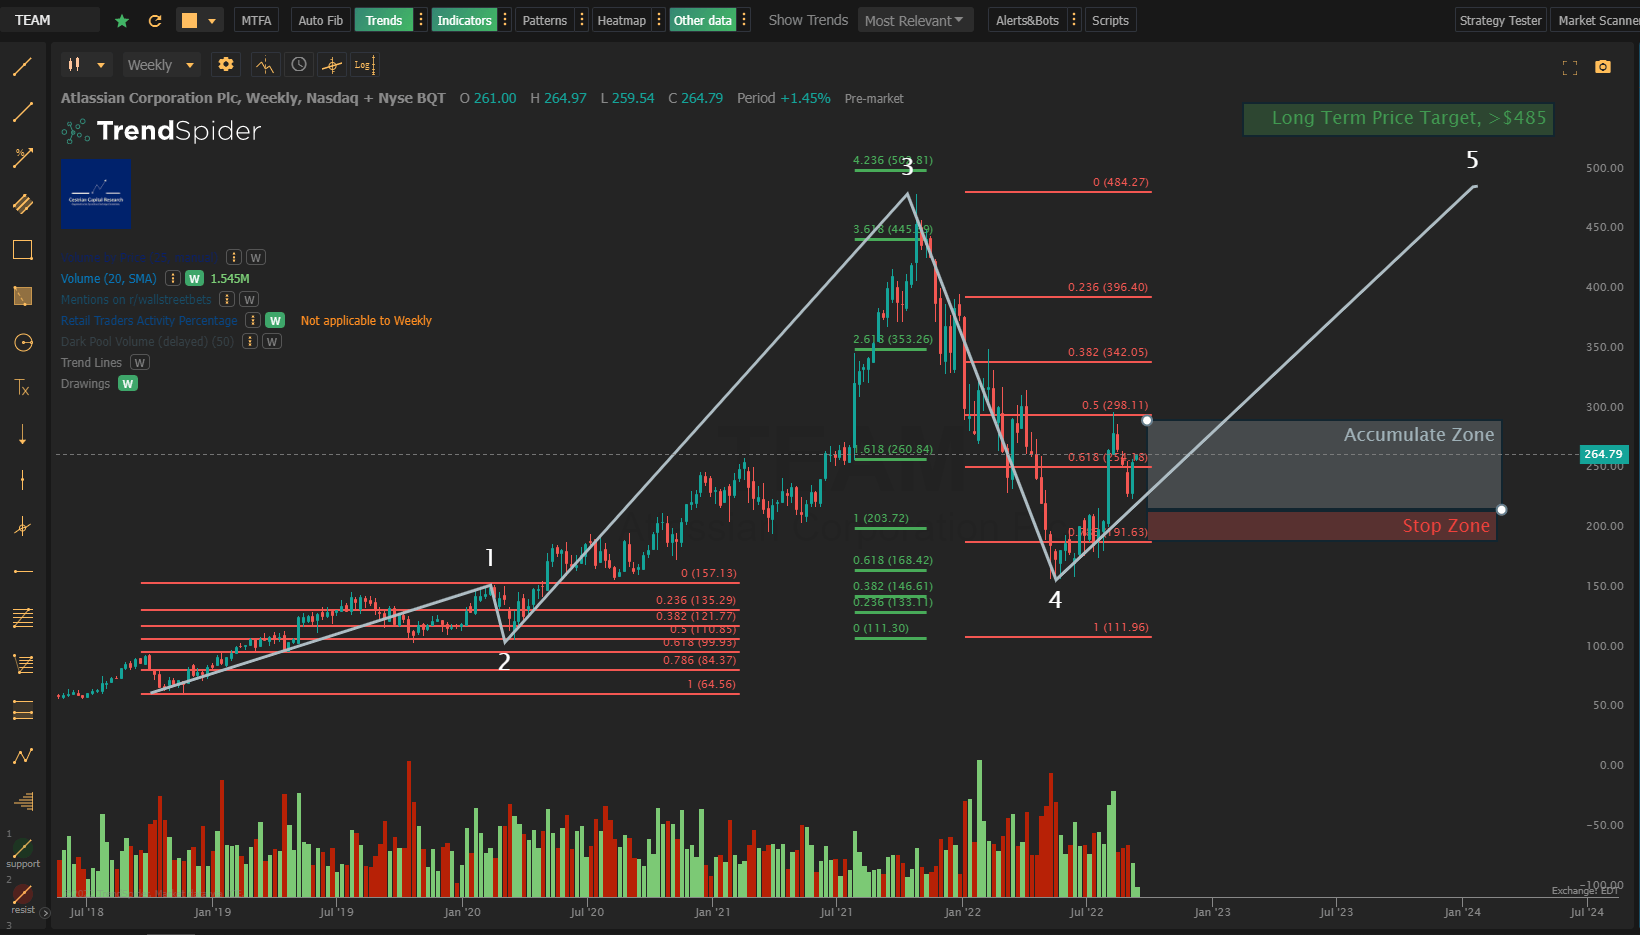
TEAM Larger Degree Chart (Trendspider, Cestrian Analysis)
OK, so:
Wave 1 up starts late in 2018 just as Mr. Powell is making an early attempt to normalize monetary policy. (Prior to being smacked upside the head by the then-Administration). It puts in around a +$93/share move, peaking in February 2020.
Wave 2 starts there and completes mid-March 2020 in the midst of the Covid crisis, like most other names. Unusually however, TEAM stock puts in only a 50% retracement of that Wave 1 up. Almost every stock or ETF we cover – and there are a lot of them – put in a 78.6% drop of the same Wave 1 period, and those that didn’t generally put in a 61.8% drop. Very very few such names dropped only a half of the value gained from the 2018 lows to the Q1 2020 highs. And that had consequences for what happened this year, as we shall see in a moment.
Wave 3 comes ripping up and out of the Covid lows and it was a doozy. TEAM added +$370/share in just 18 months or so, peaking at between the 3.618 and the 4.236 extensions of Wave 1. (If that sounds fancy and complicated, it isn’t. A 3.618 extension just means, take the share price movement in Wave 1, multiply it by 3.618, and add that to the stock price at the Wave 2 low. The fancy and complicated part is why these Fibonacci numbers work at all but that’s for another day).
Wave 4. Ah, wave 4. Now, in say SPY or QQQ or MSFT or AAPL or other grownup companies, the Wave 4 that has been rolling in all through 2022 has been relatively modest. It hasn’t felt modest, but it has been modest. SPY so far bottomed at between the 38.2% and 50% retracement levels off of its post-Covid runup; QQQ a little tougher, bottoming so far between the 50% and the 61.8% retrace of the same runup. Now these aren’t pretty pullbacks, but they are just pullbacks. What happened at TEAM was, the Rule of Alternation played out. Rule? Well, common pattern let’s say. In Elliott Wave folklore/mythology it is common that if you get a deep Wave 2 correction, you get only a modest Wave 4 correction. Hence, SPY and QQQ hit the 78.6% Wave 2 retraces into the Covid crisis, but dropped a lot less (so far!) in the 2021-22 correction. But TEAM? Well, as we noted above the Wave 2 into the Covid crisis was shallow – only a 50% retrace of the prior runup. So a thumping worse-than-78.6%-retrace Wave 4 from the 2021 highs to the 2022 lows, isn’t abnormal for this chart pattern. How you know the chart logic is holding up is the very special kind of voodoo-spell that kept the Wave 4 low ($161, assuming the bottom is in) above the Wave 1 high ($157). What an amazing coincidence! Nobody who bought pre-Covid crisis, or during the Covid selloff, or in the early part of the recovery, got hurt. Which is another way of saying, nobody at Big Money got hurt. Only Chad – who BTD’d and then held all the way up through 2021 – and stranded momentum funds – got hurt.
So now what? Well, we should declare our house position on the market at large here. We believe the market has bottomed in the current move down. We think that the SPY and the QQQ are likely to put in final Wave 5s up that complete the bull cycles that we measure from 2016 and 2018 respectively. And we think a big ol dump – a proper dump, not just a little dumpette like 2022 – is coming thereafter. But that’s for then and this is for now. For now, we think the next big move in the market is, up. And so we think that TEAM stock can also make that Wave 5 move up. And the thing about brutal Wave 4s down? Is that if the Elliott Wave / Harry Potter stuff holds up – and it does hold up, more than you might think – then Wave 5 will put in a new all time high for TEAM which, you will have noticed, is a long way up from here.
Let’s call it a long-term price target of not less than $485.
Is TEAM Stock A Buy, Sell, or Hold?
Well, you might say, if we think it can run to $485, it’s a screaming buy, right?
Not so fast.
Here’s how we like to play things of this nature at these market lows. As much as the Trading Gods have handed most of us a beating of some form in 2022 (nobody has escaped without at least a single blow – anyone that tells you they have is a big ol liar, or, has the luck of the Gods on their side, or, has been an oilbug on an exclusive basis their whole life), they are now handing you a number of gifts. That doesn’t mean a guaranteed one-way free pass to Money City, population, you. It means the risk/reward setups right now for these high beta names are attractive. Here’s how we think TEAM can be played in this light.
We think a prudent approach to trying to win from a long position in TEAM is:
Accumulate (i.e., build a position slowly, no YOLO’ing, just careful additions on red days) between around $228-$298. That range is defined by the smaller-degree Wave ii bottom, below, and the 61.8% retrace level of the larger-degree Wave 3 up. You could place a tight stop-loss around the $215-220 level, just below that smaller-degree Wave ii low; or a much wider stop below the Wave 4 low of $160. The upside from here is big, we think. Taking the most recent close as a baseline, and using even the wider stop, that looks like $100 downside versus $200 upside, so, a 2:1 risk reward even using a very distant stop. Set yourself a tight stop at $215 and you get $50 downside, $200 upside, a 4:1 risk/reward. And there’s every chance TEAM runs up above $485 but there’s little point explaining the voodoo behind that logic because nobody would believe us.
Here’s the zoomed-in chart to which all the above refers. (Open a full page version, here).
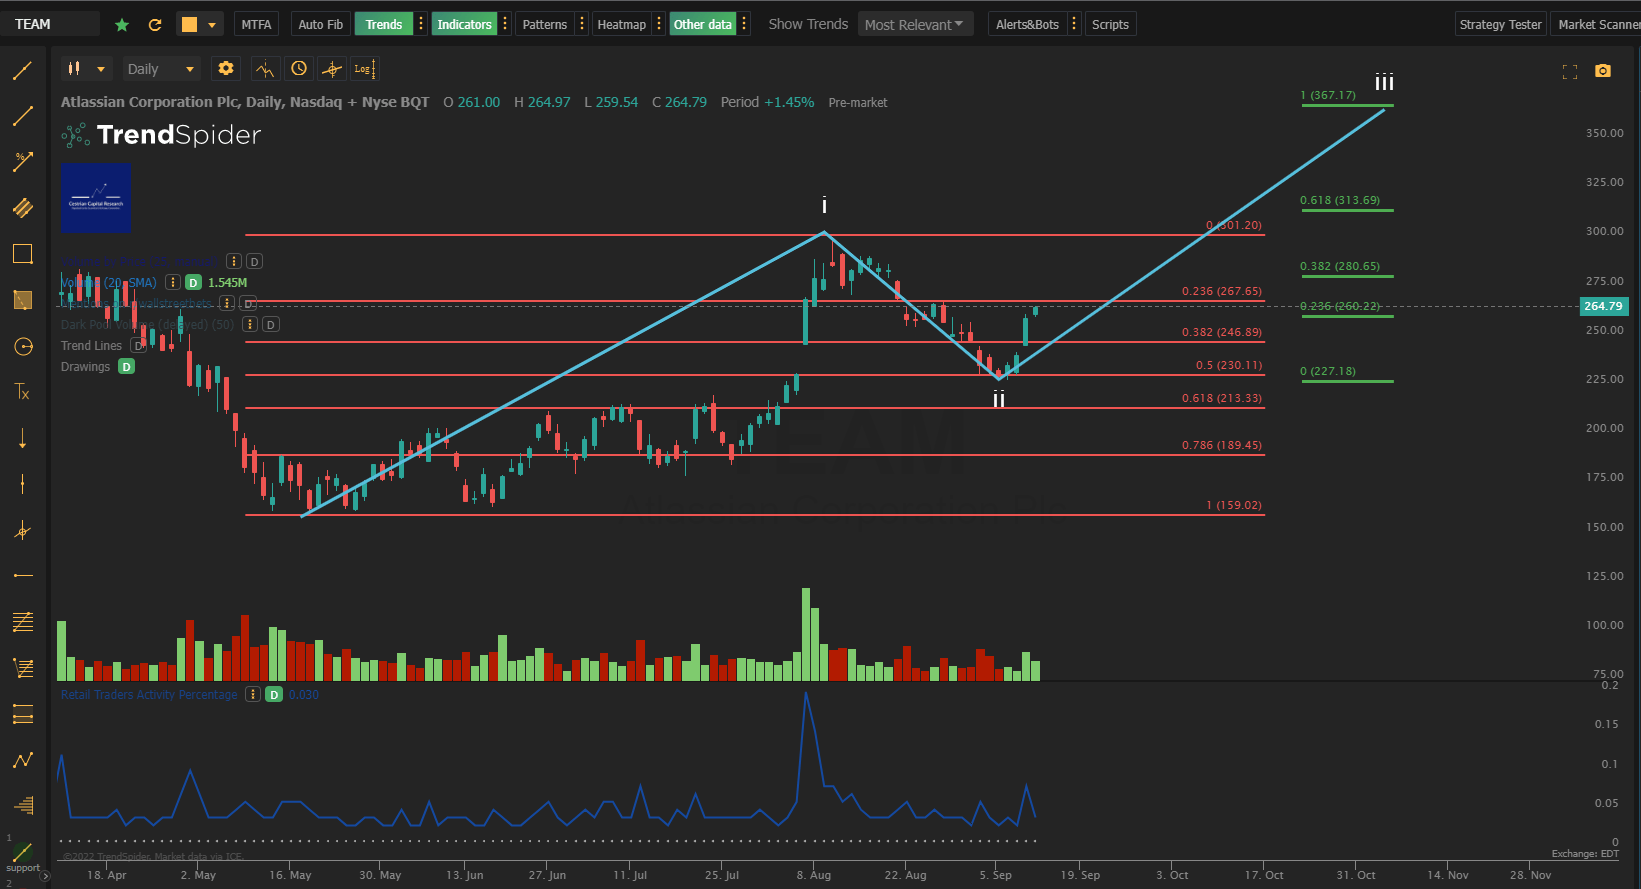
TEAM Smaller Degree Chart (Trendspider, Cestrian Analysis)
So. On that basis? TEAM is a Buy – in our usual parlance we rate it at Accumulate, on the logic above.
(Oh and by the way. The company is presently HQ’d in the UK, with operations centered in Australia, with a US-traded stock. It’s likely to move HQ to the US and indeed adopt US GAAP (the above tables are based on the IFRS the company reports to). Such a move probably won’t hurt the stock.)
Cestrian Capital Research, Inc – 13 September 2022.
Be the first to comment