

cemagraphics
Vanguard Extended Market Index Fund ETF (NYSEARCA:VXF) is an exchange-traded fund whose investment mandate is to allocate capital to small- and mid-cap companies; approximately 3000 of them, by investing in S&P Dow Jones Indices’ S&P TMI (Total Market Index) but excluding the constituents of the S&P 500 (mega- and large-cap) U.S. equity index. This wide constituent pool is represented by an alternative index that VXY uses to achieve its strategy: the S&P Completion Index (VXF seeks to replicate the performance thereof).
In fact, 3,000 is an under-statement: VXF’s benchmark had 3,732 constituents as of July 31, 2022, of which VXF invested in about 3,659. The median market cap as listed below was $6 billion.
Vanguard.com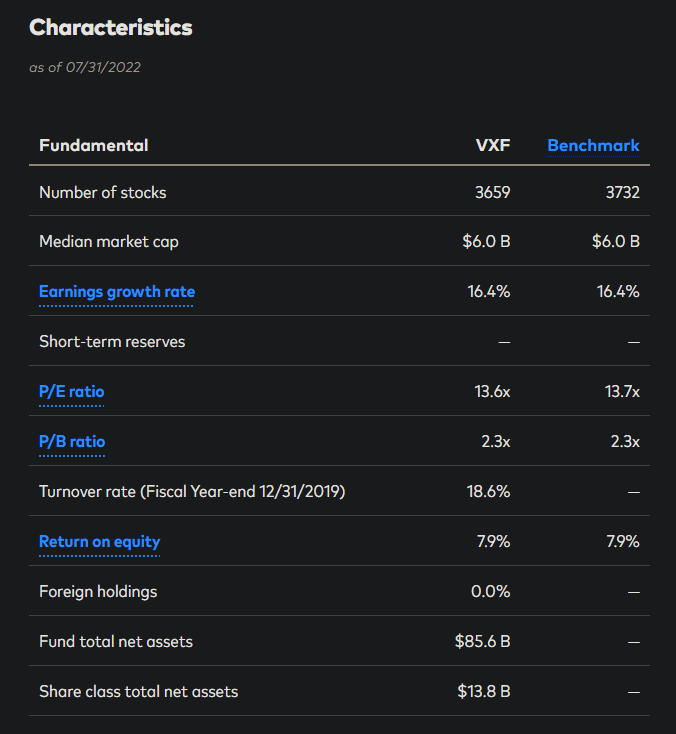
I last covered VXF in my article dated October 27, 2021, in which I did not think the fund would out-perform another popular fund, Vanguard S&P 500 ETF (VOO), which seeks to track the S&P 500 U.S. equity benchmark index. I believed this because I thought that investors were overvaluing the fund’s forecast earnings stream. Since then, commodities prices have also risen, and risk-free rates have risen too. I essentially viewed VXF as an expensive source of equity beta, and my prior prediction has been correct even in spite of the long time frame: Seeking Alpha data tells me that the price has fallen by -26.25% since that article, as compared to the fall in the S&P 500 of -14%.
As of September 2, 2022, VXF’s total assets under management were $13.4 billion. This follows net positive inflows over the past year too, in spite of the likely over-valuation explained in my prior article, of circa $650 million (see below). Clearly, there is still strong demand for an “extended” market exposure beyond the S&P 500, which could be a price-insensitive source of demand. In any case, net inflows have not been enough to support price.
ETFDB.com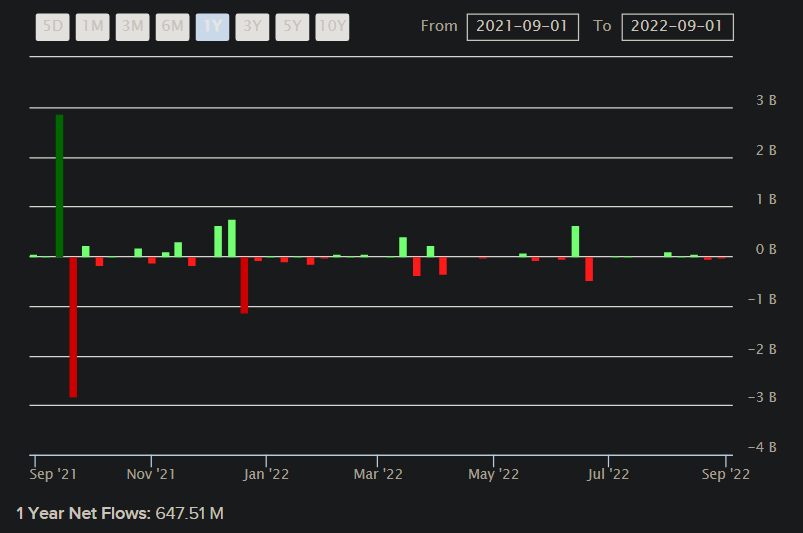
It is also worth noting that the United States is in the latter phases of its present business cycle, at least if we are to trust Fidelity research. This is based on factors such as moderating growth rates, tightening credit flows, earnings pressures, fiscal and monetary policy, and positive inventory growth/negative sales growth. This is as of Q3 2022.
Fidelity.com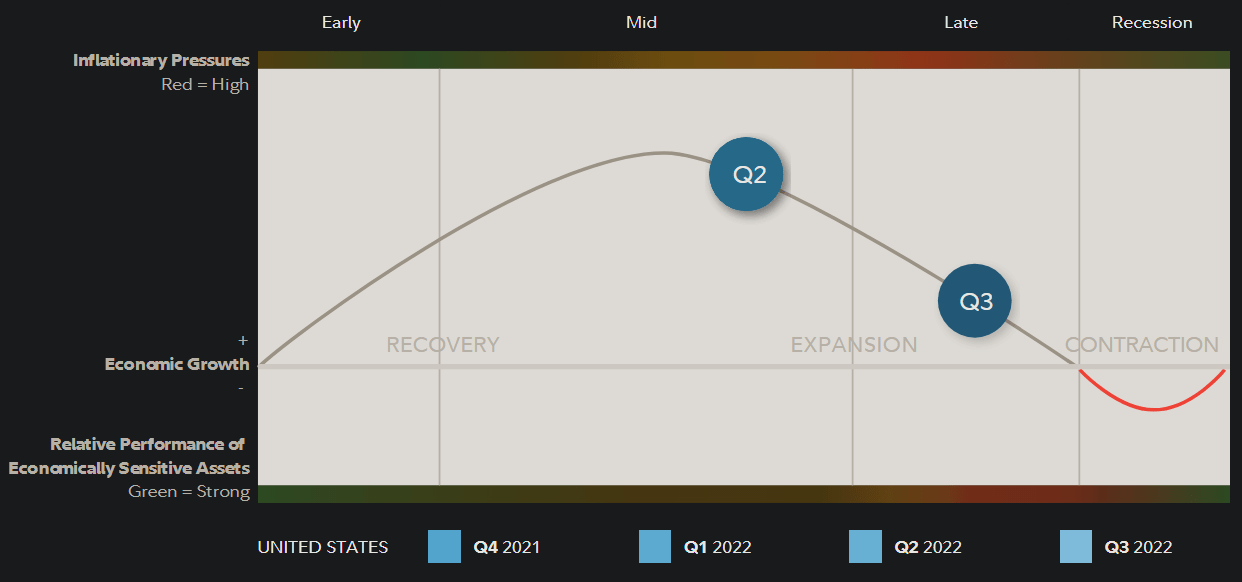
What happens to the ratio between VXF and the S&P 500 (SPX in the chart below) at the end of the business cycle? You could look at a few periods for this, such as the end of 2019, and also 2007/08, as two prominent examples.
TradingView.com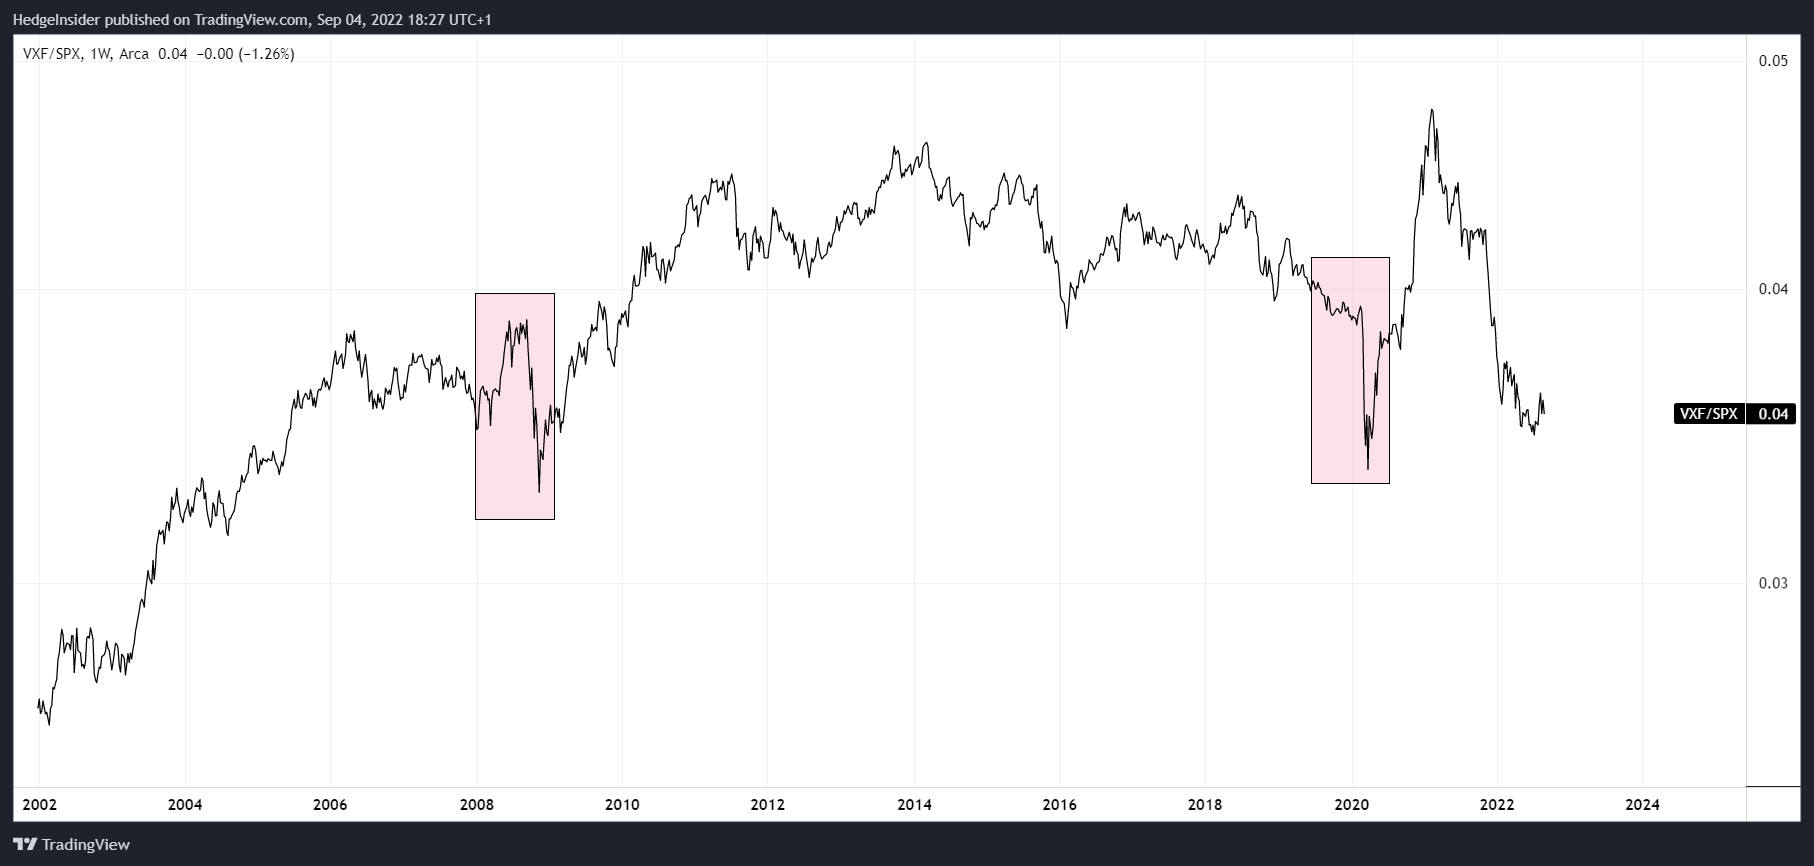
It makes sense that if equity markets are declining, and near-term growth prospects are declining, that larger-cap stocks will be used as a relatively safer trade than small-, mid- and even large-cap stocks (below the largest/mega-cap stocks). Therefore, VXF would be expected to under-perform. This does portend well for the fund in the near- to medium-term.
However, VXF has already been steeply under-performing the S&P 500 (which you can see clearly at the end of the chart above). It could be that VXF’s under-performance has been “front-loaded”. In any event, the historical beta of the fund exceeds the S&P 500; circa 1.23x. Fairly impressively, VXF has mostly held its own against the broader market indices over time. The peak in relative performance in fact happened quite recently, in Q1 2021.
More recently, relative performance has been poor, and I am leaning on thinking that further under-performance is likely, given poor cyclical positioning as discussed already. Nevertheless, we can review VXF’s valuation using S&P Dow Jones Indices’ information provided for the fund’s benchmark: the Completion Index referenced above recently had (as of August 31, 2022) trailing and forward price/earnings ratios of 38.49x and 21.63x, respectively, and a price/book ratio of 2.5x. The indicative dividend yield was 1.23%. This suggests a forward return on equity of about 11.6%, which is in the region of what could be described as “fair” for U.S. businesses.
Earnings growth expectations for VXF’s portfolio are probably over-stated given that we are in the latter stages of the business cycle. Nevertheless, per Morningstar figures, three- to five-year earnings growth is expected to average at around 15.36%. I would prefer to punch in the above figures are draw a curve that assumes a moderating return on equity to around 10% as a base case. This approach actually generously skips a full-scale earnings recession, which is certainly a risk.
Also, this approach would actually take my earnings growth estimate to an average of 15-24% per year given that I am including the one-year bounce forecasted by S&P. However, my estimate is not necessarily going to be more generous than Morningstar’s, as the latter firm typically use adjusted earnings numbers. It is likely that my figures are actually firmly on the conservative side. With this approach, my IRR gauge suggests an annual return over the next few years of about 8%, holding the earnings multiple constant.
Author’s Calculations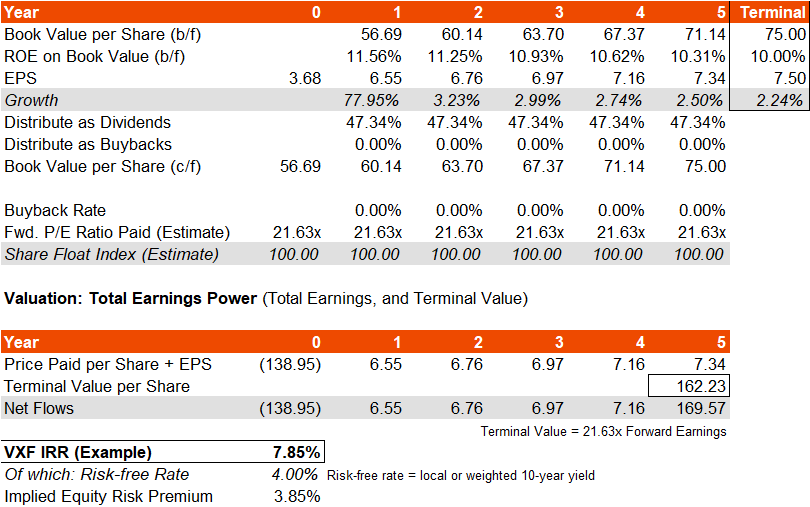
The implied equity risk premium here is tight, at just 3.85%. An alternative “sanity check” would be to review the current price/earnings multiple, which is 21.63x on a forward basis (using S&P’s unadjusted numbers). That puts the forward earnings yield of 4.6%. Let’s assume long-term earnings growth of 2-3% at least, from that higher (forward) earnings base. Further, a beta-adjusted equity risk premium of 6.8% (my estimate for what would be fair; I am using a 5.5% ERP base, and scaling this upward by VXF’s beta of 1.23x). And let’s assume a 4% risk-free rate. The net cost of equity (i.e., net of growth) would then be the sum of these components, in the region of 7.8-8.8%, implying a fair forward price/earnings multiple of around 11.36x to 12.82x.
Remember that VXF is not a “small-cap fund” or a “growth stock” fund or similar: it is just wide-scale beta. Given its valuation, and especially if we have a real earnings recession, you could see a draw-down in the region of 25-50% from present prices. That is a wide range, and it depends on the approach you want to take. But I can see this being conceivable, given that VXF’s valuation seems to suggest investors are over-paying for a fund that seems more risky than the broader market.
One important factor for markets, and indeed the economy, is energy. Energy and commodity prices are much higher nowadays, and this inflationary pressure is feeding into core inflation/wage growth too. These factors affect smaller companies with less pricing power the most. VXF once again would seem less well positioned than the largest companies that are more likely to enjoy higher margins/throughput relative to labour, and stronger pricing power.
My general view on markets is not optimistic in the near term; things are changing quickly. But in terms of relative performance, I think that is still worth taking a pessimistic view on VXF at the moment. There is no clear under-valuation here; on the contrary, I would expect VXF to be trading at much lower prices. In a down-market, VXF is probably going to press lower than average. I would be unsurprised to see the VXF/SPX ratio take out its recent lows, with the fund’s positive inflows over the past year getting pulled into reverse over the next three to twelve months.
Be the first to comment