

DNY59
Written by Nick Ackerman, co-produced by Stanford Chemist. This article was originally published to members of the CEF/ETF Income Laboratory on August 17th, 2022.
Invesco Senior Income Trust (NYSE:VVR) is a closed-end fund focused on senior loan investments. These senior loans are overwhelmingly floating rates in their structure. That means with higher interest rates; the fund should be able to produce higher income from its underlying portfolio.
Since we last looked at this fund, they posted a new annual report showing their net investment income increased significantly. However, the report reflected the fiscal year-end, which comes in at the end of February. This was before the Fed had even raised its target rates.
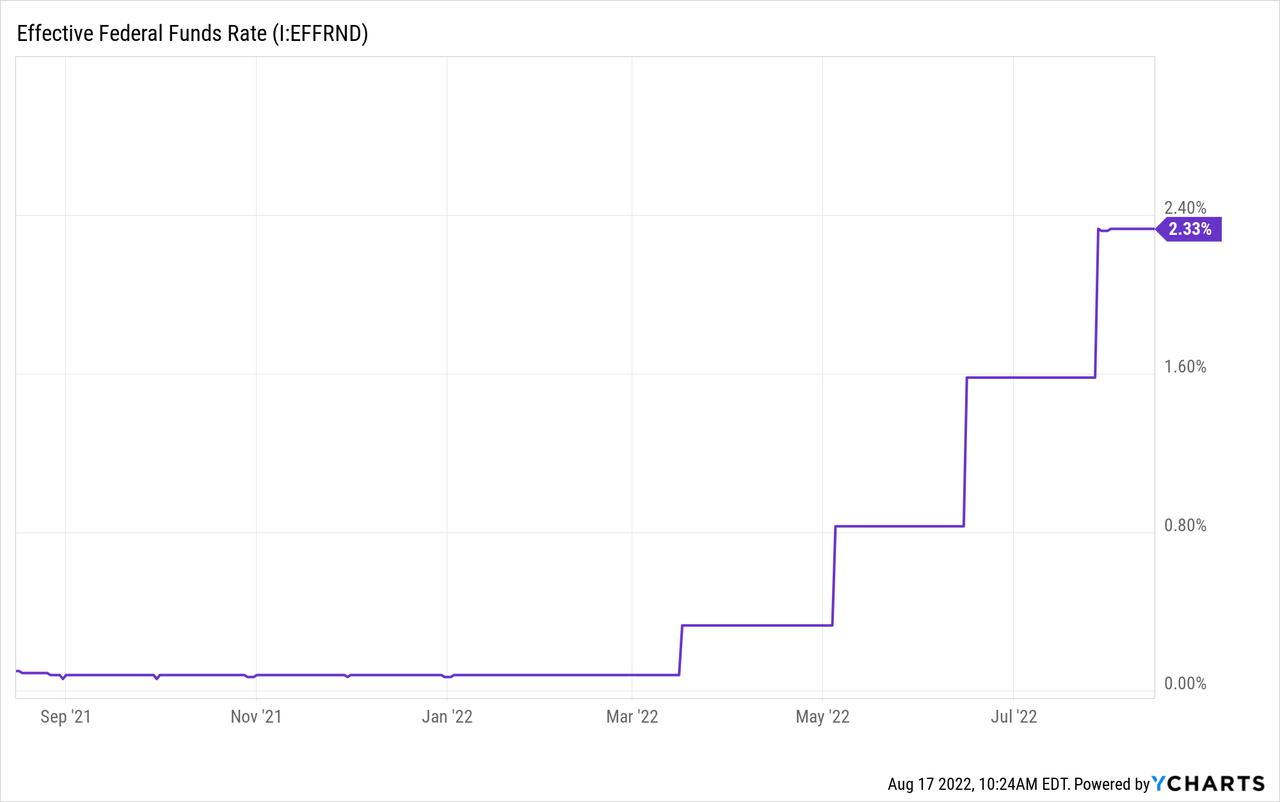
Ycharts
That suggests that from portfolio positioning alone, they were able to squeeze higher income out of the portfolio. They last reported a turnover rate of 86%. Over the last five years, they have averaged a turnover rate of 65%, meaning they are generally quite active. Although, this was the first year to see a substantial boost in the NII figure relative to the last five years.
With higher rates now, we should be seeing additional bumps in the income the portfolio can generate. The fund is at an attractive discount, which makes it a potentially attractive candidate in this environment. Discount widening and credit risks are playing a role in the portfolio, though. That should be considered before investing in a leveraged senior loan fund such as VVR.
The Basics
- 1-Year Z-score: -0.75
- Discount: -8.37%
- Distribution Yield: 7.92%
- Expense Ratio: 1.53%
- Leverage: 32%
- Managed Assets: $963.8 million
- Structure: Perpetual
VVR’s investment objective is “to provide a high level of current income, consistent with preservation of capital.”
To achieve this, the fund will “opportunistically invest primarily in floating or variable senior loans of issuers which operate in a variety of industries and geographic regions.”
The fund is a fairly large size relative to other closed-end funds. That can help provide plenty of liquidity. The higher amount of leverage certainly helps in this case too.
They utilize borrowings, which is pretty standard for CEFs. These are at floating rates. So they will see their expenses rise as higher interest rates come. That will offset some of the higher income we should see from the portfolio, but not enough to offset it completely. The weighted average spread above LIBOR in their portfolio is 5.06%. Here are their comments in the last report that they shared.
Leverage involves borrowing at a floating short-term rate and reinvesting the proceeds at a higher rate. Unlike other fixed-income asset classes, using leverage in conjunction with senior loans typically does not involve the same degree of risk from rising short-term interest rates since the income from senior loans generally adjusts to changes in interest rates, as do the rates which determine the Trust’s borrowing costs. (Similarly, should short-term rates fall, borrowing costs also would decline.)
Additionally, they have variable rate demand preferred shares. That’s a bit more unusual for CEFs, but it did reduce the expenses for the fund in the period. At the end of fiscal 2022, the preferred dividends came out to just 0.21%. The borrowings had an average interest rate of 1.05% for comparison.
In their latest annual report, they showed a comparison of $10k growth against a leveraged loan index. What we can see is exactly how leverage has worked to impact this fund. The result was meaningfully higher at the end. However, the ride it took to get there was quite volatile. During sell-offs, we saw the market value drop below the index. Though, on a NAV basis, it never appeared to drop below the index level.
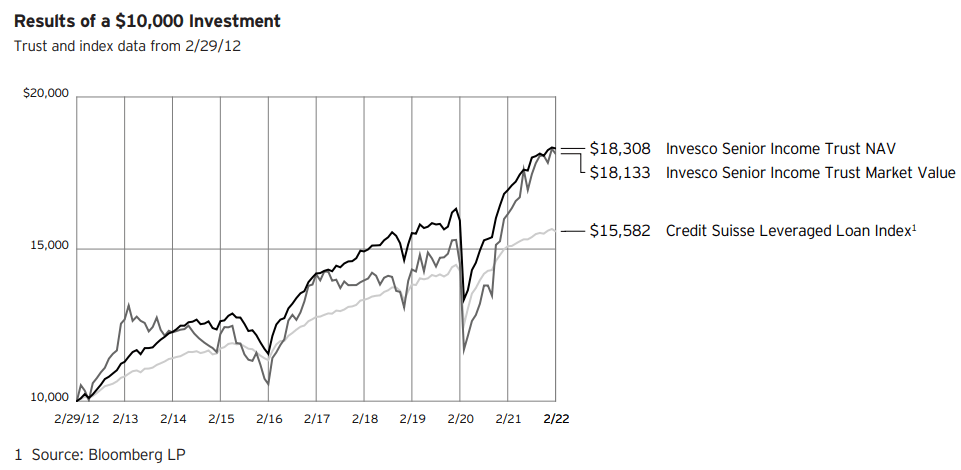
VVR Comparison To Leveraged Loan Index (Invesco)
Performance – Discount Widening
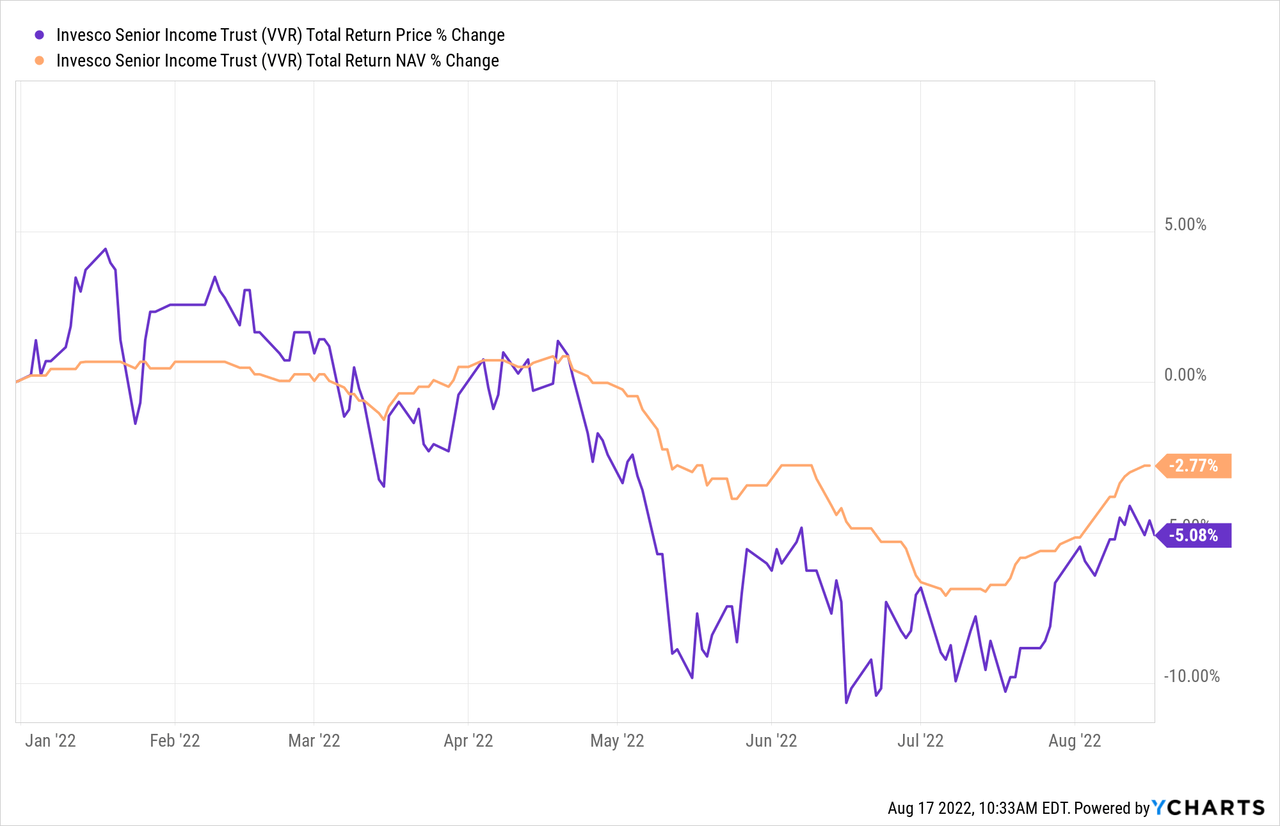
Since the last update, we’ve also seen that the fund’s performance hasn’t acted as the natural hedge it should be with higher interest rates. Below is the performance since the last posting compared to the S&P 500. That isn’t an appropriate benchmark, but it does give us some context of what the overall market has been looking like.
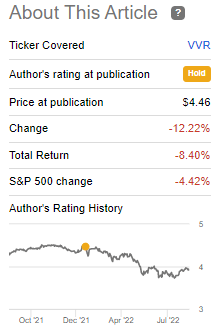
VVR Performance (Seeking Alpha)
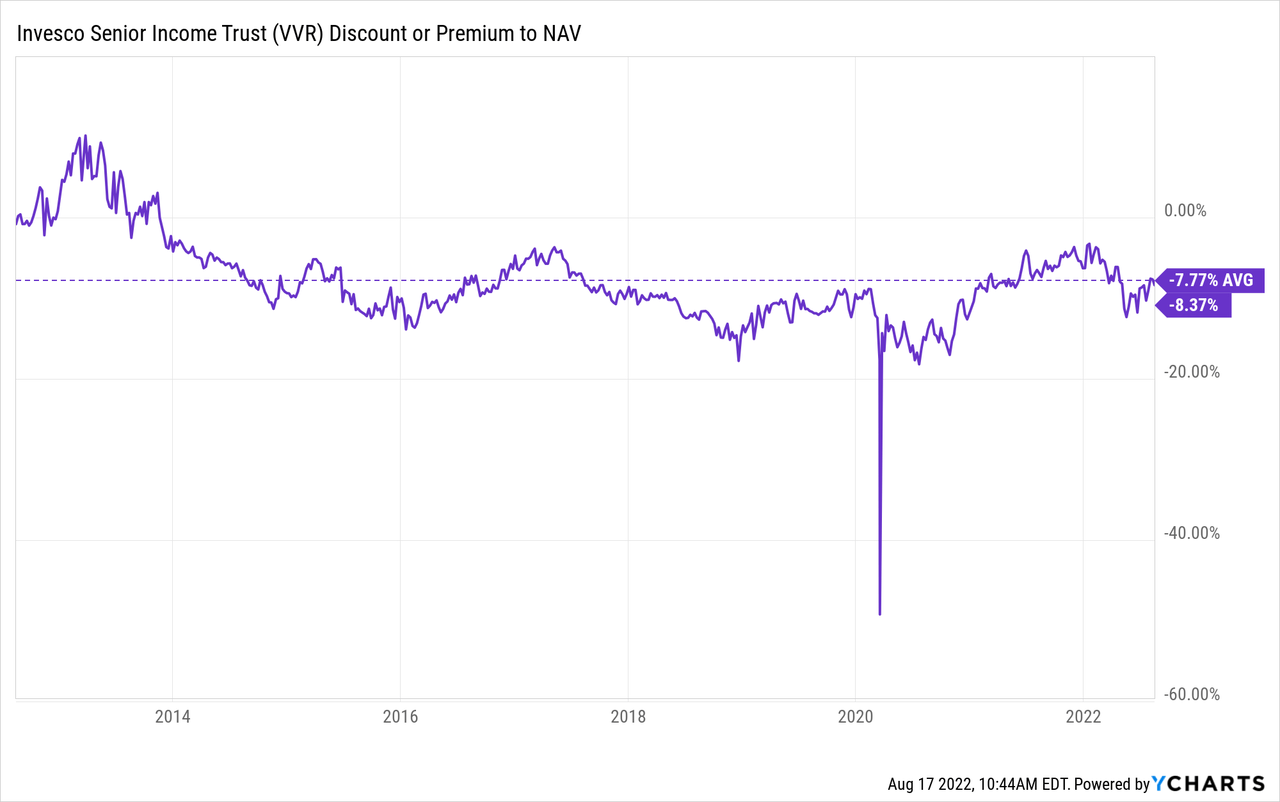
One of the primary reasons for this is the CEF structure itself. The fund has widened out its discount since we last touched on the fund. It went from a discount of 3.24% to the 8.37% level now. That had nothing to do with its actual total NAV performance through this time.
On a YTD basis, we can see that the total NAV return reflects how well the fund has been holding up. The overall fund has been recovering along with the market lately, too. The results are still better than the S&P 500 on a YTD basis. At the time of writing, the broader market is down nearly 11%.
Ycharts
That leads to the second reason why it is negative at this time too. That’s the credit risk. There is a heightened possibility of the economy going into recession. That increases the risk that the underlying portfolio will have defaults and bankruptcies. The holdings of the fund are significantly tilted towards below-investment-grade funds.
That isn’t referring to the technical recession we are in now. That hasn’t shown to slow things down too significantly, at least not yet. If fears of a recession begin to resurface, we could see more pressure on VVR shares reappear.
The current discount puts it at a slightly wider discount than its longer-term average. Interestingly, at one time, this fund carried a premium.
Ycharts
In fact, if we look at an even longer period, we can see that the fund traded at a premium on several occasions. However, it has been quite a few years since that happened.
VVR Discount/Premium History (CEFConnect)
Distribution – More Potential Raises
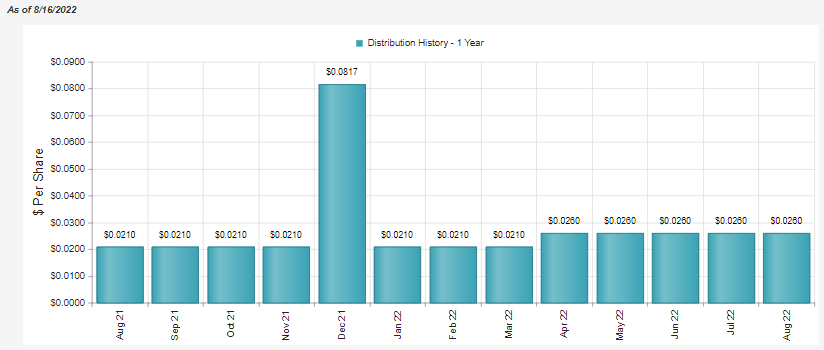
The latest distribution yield works out to 7.92%, with an NAV rate of 7.26%. Earlier this year, the fund boosted its distribution.
VVR Distribution History (CEFConnect)
At first, I thought that was a bit unusual. However, when they posted the report for their fiscal year-end, it made a bit more sense. NII had grown 16.6%. That being said, it kept NII coverage essentially flat. It went from 82.3% to 82.33%.
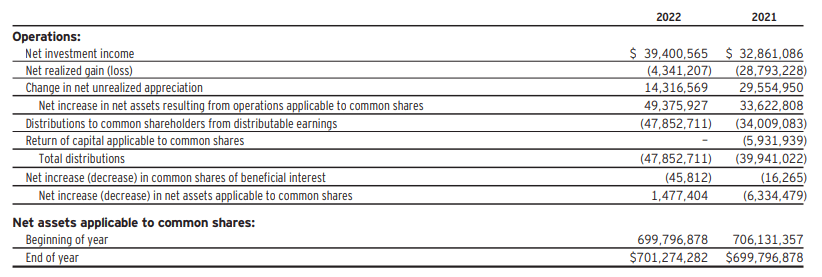
VVR Annual Report (Invesco)
On a per share basis, NII went from $0.21 to $0.26. They paid out $0.31 in distributions for the period. The unrealized gains were enough to offset the realized losses and basically covered the distribution.
For fixed-income funds, we would generally want to see 100% NII coverage ideally. That’s why I believe management is confident that they should be able to generate even higher NII going forward. That would be due to the higher interest rates and the floating nature of their holdings.
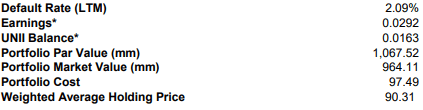
We are seeing signs of this already too. In the latest fact sheet, they posted that earnings over the last month were $0.0292 at the end of June 2022. This is a really short time frame to try to extrapolate, but it would indicate that NII is pushing $0.35+ annualized. Considering the distribution works out to an annualized $0.312 based on the latest monthly, we see coverage could be over 100% now.
If the economy doesn’t hit too much of a speed bump, we should anticipate higher distributions going forward.
VVR’s Portfolio
Besides the fund’s own discount, the underlying loans are discounted that the fund is holding. On average, the holding price was $90.31. Unfortunately, they bought these for $97.49. It could be argued that it helps highlight the potential for further upside.
VVR Fact Sheet (Invesco)
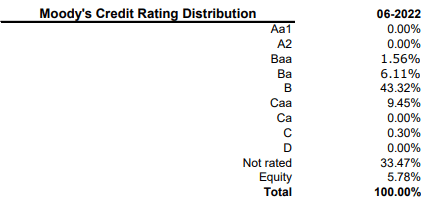
One of the reasons why these loans are being discounted goes back again to the credit risks of these loans. They are carrying a portfolio that is mostly below investment grade or not rated. We can see that the default rate remains low at this time.
VVR Fact Sheet (Invesco)
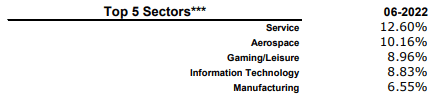
Helping to provide safety is the diversification of the fund. They carry 620 positions with 386 different issuers in 34 sectors. Though they are weighted towards the service and aerospace sectors more heavily, it doesn’t seem to be overwhelmingly so.
VVR Fact Sheet (Invesco)
A look at a sampling of their holdings can give us a better idea of what these floating rate terms look like.
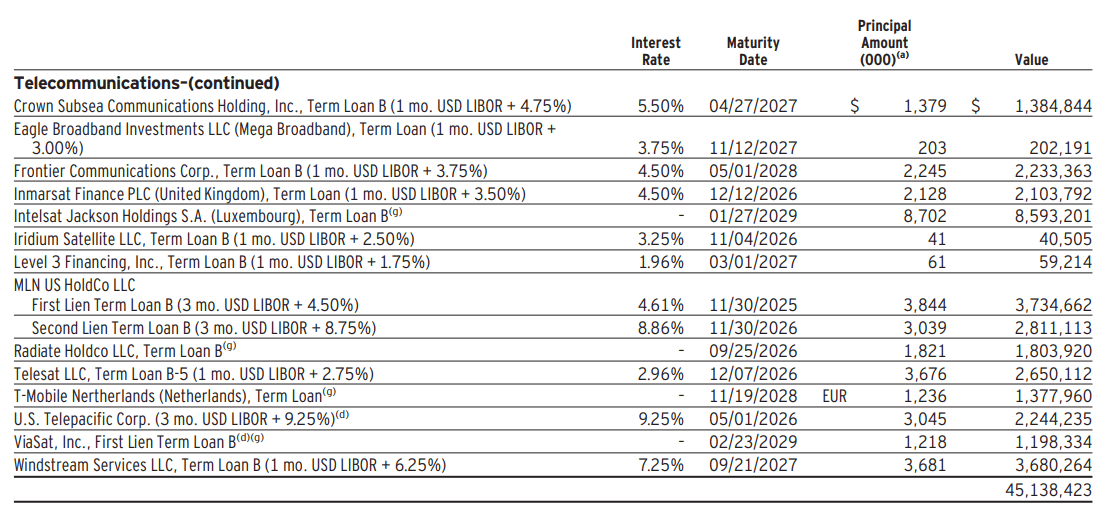
VVR Holdings (Invesco)
Over time, LIBOR is being phased out, so we will eventually see SOFR or some other relevant benchmark rate start showing up more commonly.
Conclusion
VVR has experienced a sizeable bump in the income the portfolio is generating. However, that occurred before rates had even started to tick higher. Now that rates have begun to increase, we’ve already seen signs that NII is rising. That should reward investors with more potential boosts in the distributions going forward. The attractive valuation and current economic conditions still make VVR a viable investment at this time. However, keeping an eye on economic conditions is always a risk for these types of funds. With slowing economic conditions, the Fed could be forced to reverse rates, and defaults could tick higher for VVR and all senior loan funds.
Be the first to comment