

Pickone/iStock via Getty Images
Vulcan Materials (NYSE:VMC) remains a relatively large company at $22 billion market cap with a S&P Credit rating of BBB+, providing confidence. They are larger in the south of the U.S. but remain the largest producer of aggregates (such as sand, gravel, and crushed stone) used in construction throughout the U.S. The company, at its heart, is driven by the aggregates segment (Figure 1). This is the largest segment and also shows the strongest activity and growth prospects. VMC remains relatively conservatively managed and operated and sees strong growth ahead in its core business, leading to the potential for high EPS growth in 2023 and 2024. In the rest of the article, I explain why I believe the current valuation of the company needs to be considered and why investors should be careful.
Figure 1. VMC segments (TIKR Terminal)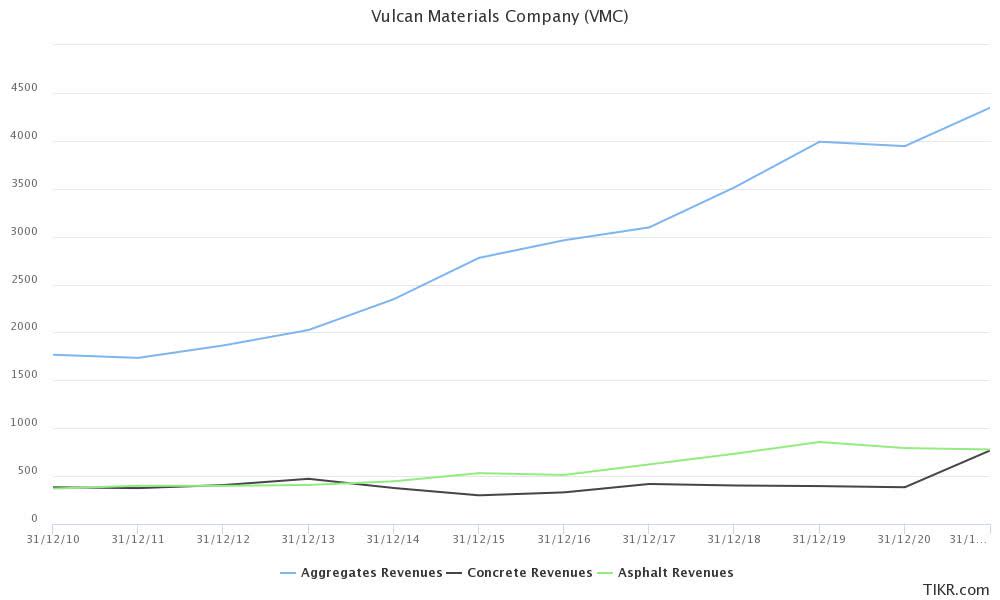
VMC has been carefully and conservatively managed. Their FFO to interest coverage is good and has been improving in recent years. The total liabilities to total assets ratio was moderately better between 2014 to 2019, but it has crept up again in the last three years. Even with the recent acquisition of U.S. Concrete, their leverage target is coming through at 2.5x. VMC’s operational efficiency has also been slowly and steadily improving. While the working capital turnover has bounced around a bit, it has not been trending in an overly negative direction. Further, the overall inventory turnover has been steadily improving over the last decade. These figures suggest conservative and careful management, and as noted in the Q2 earnings call, their efforts in “driving improved efficiencies in our plans to continue offsetting the impacts of higher input costs.”
Their current ratio of 1.9x and quick ratio of 1.3x are good, although a little lower than the building materials industry averages of 2.1x and 1.5x, respectively, with VMC’s interest coverage of 6.2x, which seems reasonable.
The 2022 Q2 results have been good (Source: 2022 Q2 supplementary information for earnings call). Aggregates lifted 9% to 63.8 million tons with a cash gross profit of $7.99/ton, which is up 2%. They are seeing housing starts in the markets they serve up 7% year-on-year, with private non-residential starts in their markets up 20% year-on-year, and highway starts up 9% year-on-year in June. They have 11.4 years of weighted-average debt maturity, which is valuable in this environment. Their CAPEX remains as expected, despite their notes on the Q2 call on how “the supply chain has made it difficult to take in some of that equipment that we had planned to be delivered last year.”
Reasons for caution
There are four points for caution to draw your attention to.
First, there is a reasonable level of goodwill on the balance sheet. I am not a big fan. I make it out as about a quarter of the assets on the balance sheet. I thought that this likely relates to the earlier acquisition of U.S. Concrete in 2021, but there has been a reasonable proportion of goodwill on the balance sheet for years earlier. It is something I am wary of as I have seen this use of goodwill later transformed into impairment charges, creating a substantial, unwelcome, and often surprising blow to the earnings.
Second, the EPS growth has been declining in recent years. I make the five-year estimated EPS growth at 8.6%, the three-year EPS growth at 1.5%, and the one-year EPS growth of -10.1%. This continued deceleration and then diminishing EPS levels is concerning and is likely one driver of the recent slowdown in stock prices. Part of the challenge may be because of the earlier U.S. Concrete acquisition, which may throw off some of these metrics for a while.
Third, this is a difficult stock to forecast. FAST Graphs’ analyst scorecard notes a 1-year forward (10% margin of error) of 23% beats, 23% hits and 54% misses. The 2-year forward (20% margin of error) is 15% beats, 23% hits, and 62% misses. So, analysts get it wrong twice as much as they get it right. Of immediate concern are the recent analyst moves and the downgrade of EPS expectations for the coming years (Figure 5, below).
Peer comparison
For a comparison with peers, I’ve selected several in the building materials industry. MDU is included as a conglomerate, with about $2,228 million of $5,680 million of their revenue from construction materials and services:
- CRH plc (CRH)
- CEMEX, S.A.B. de C.V. (CX)
- Eagle Materials Inc. (EXP)
- MDU Resources Group, Inc. (MDU)
- Martin Marietta Materials, Inc. (MLM)
VMC is relatively expensive compared to its peers, as we can see from the following comparisons; it tends to be the highest (EV/EBITDA) or close to the highest valued firm. For comparison, for the building materials industry the EV/EBITDA is 6.8x on average, with P/E of 10.9x, price to sales of 0.6x, and price to book of 0.9x.
Figure 2. EV to EBITDA comparison with peers (Finbox.io)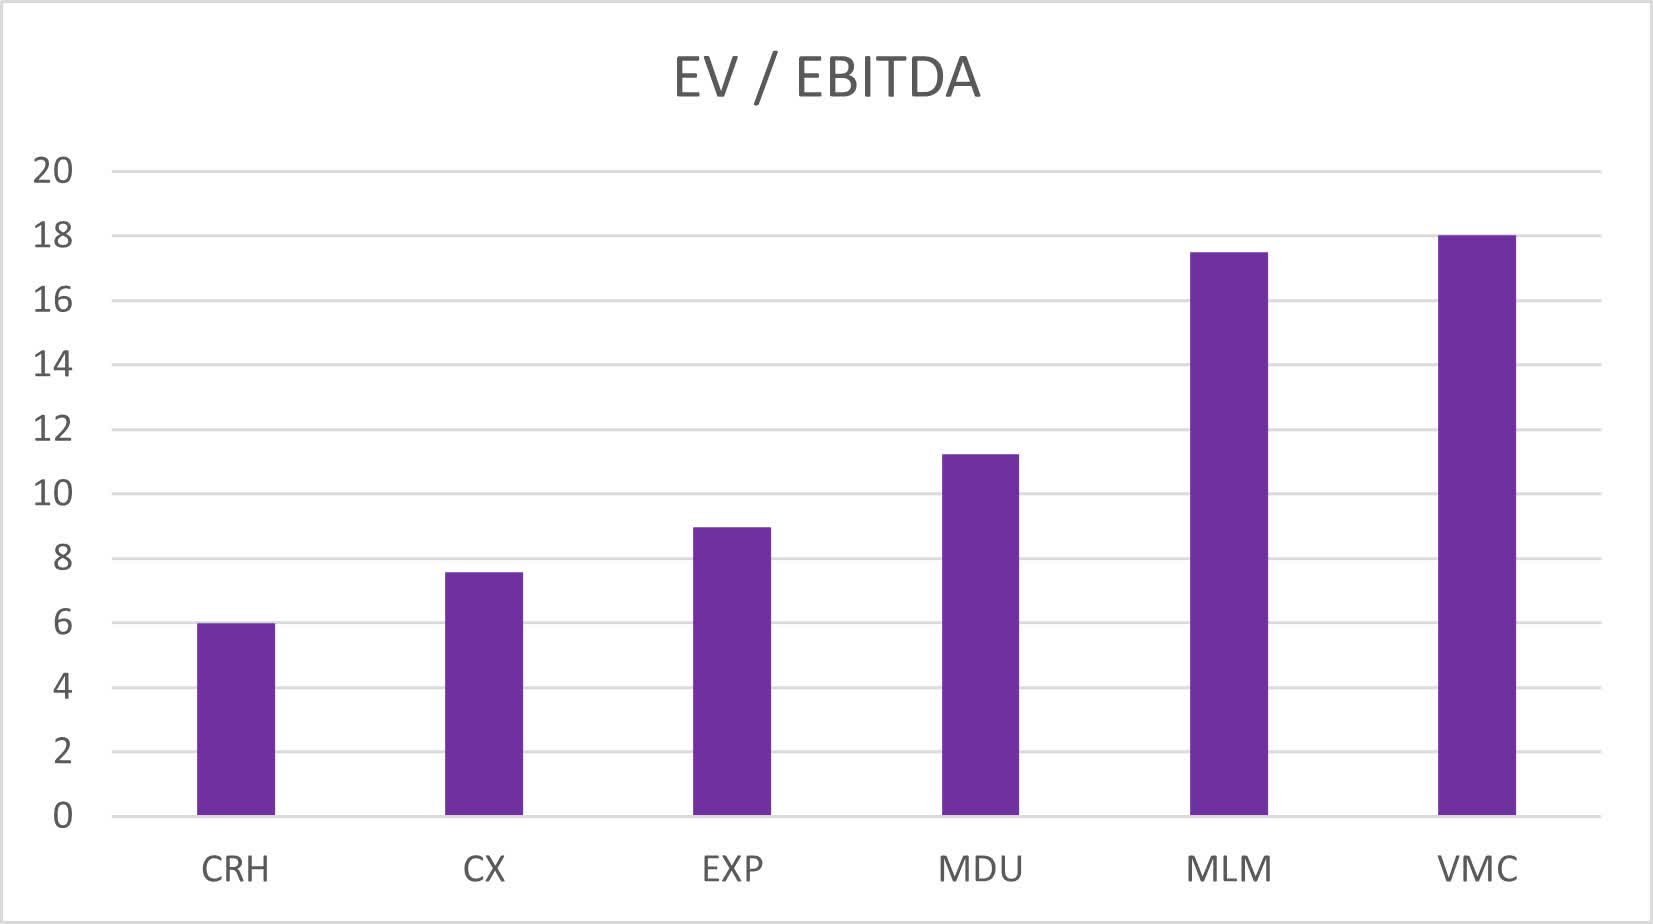
The EV/EBITDA tends to be high, much higher than some of the other options in this industry (Figure 2). It is not outlandishly high, with MLM having a comparable value, but it is substantially (three times greater) than the most affordable firm in this comparison, CRH, and VMC holds one of the highest EV/EBITDA ratios in the industry.
Figure 3. Price to Book comparison with peers (Finbox.io)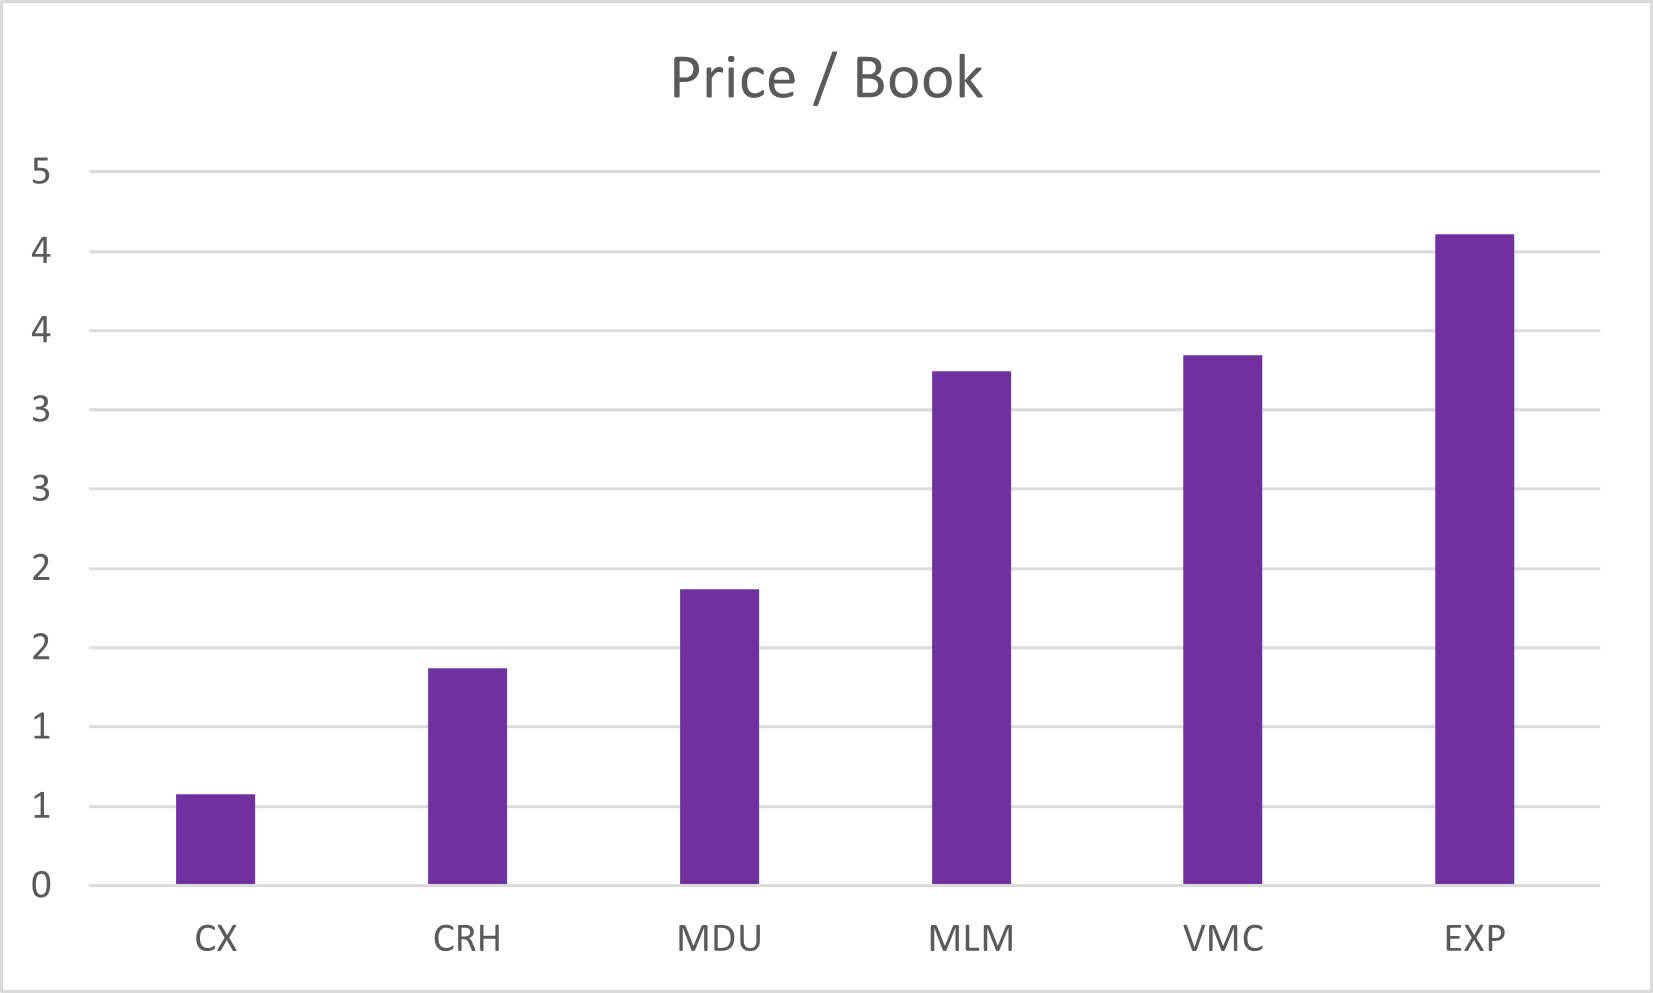
The Price/Book ratio is also quite varied over the industry. Again, VMC ranks as a higher option in the industry, though not quite the highest in this comparison (Figure 3).
Figure 4. Price to Sales comparison with peers (Finbox.io)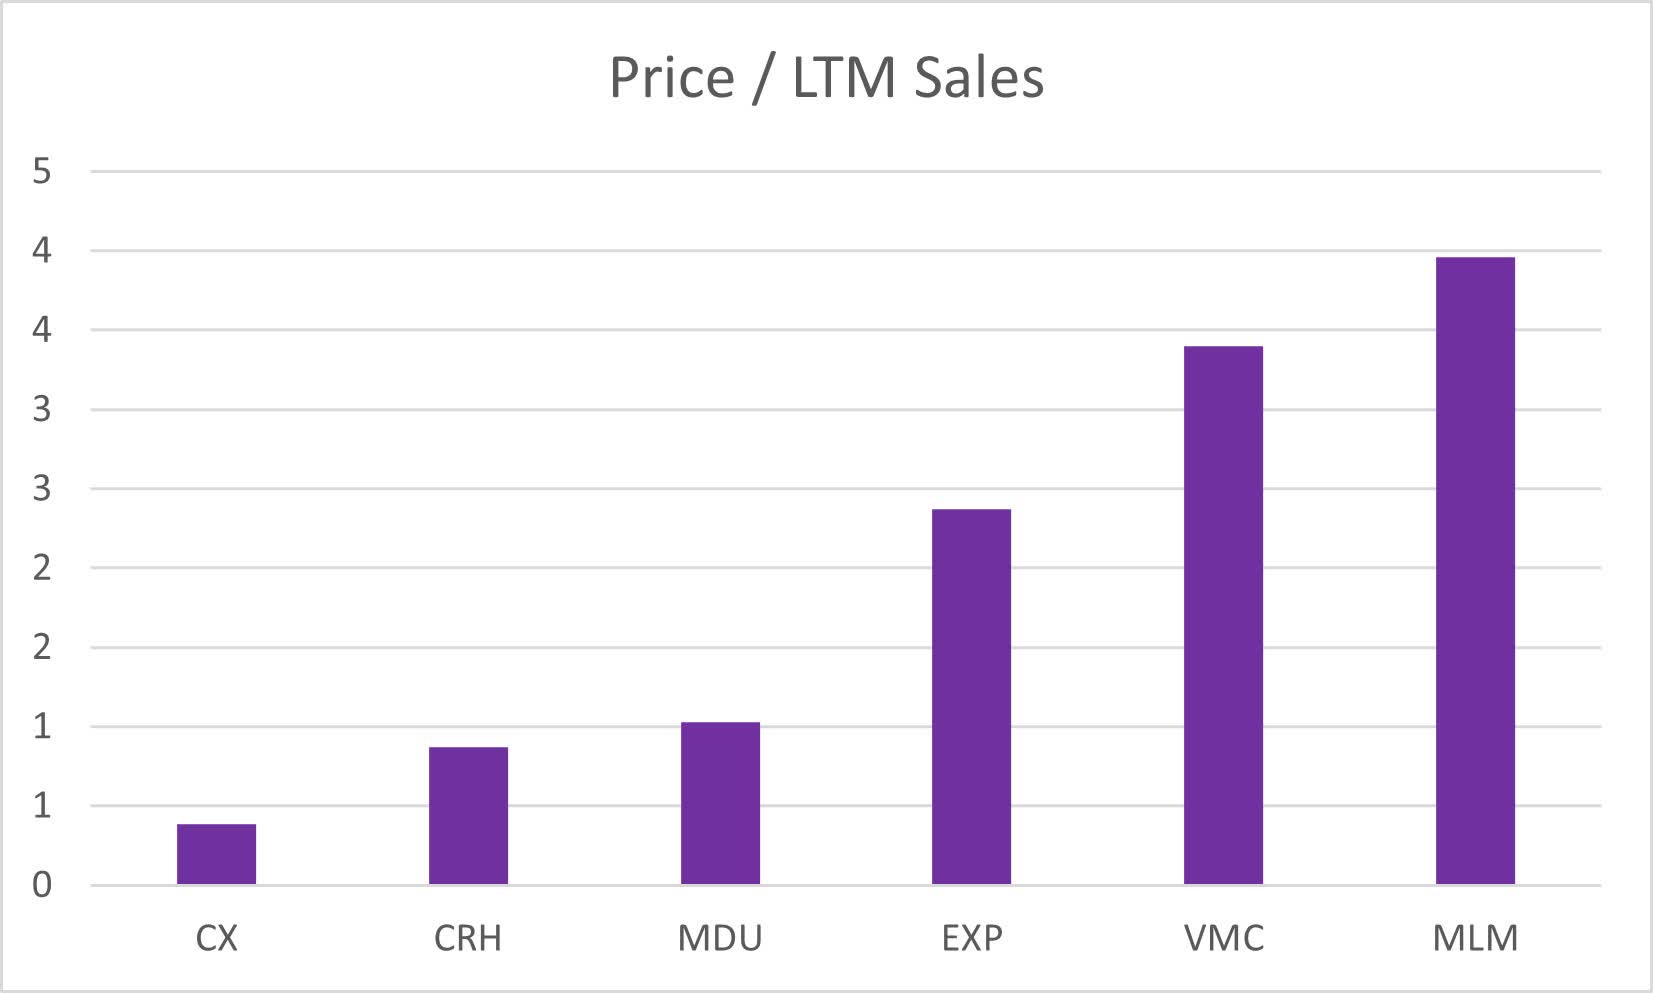
The price-to-sales ratio (Figure 4) also shows relatively high multiples for VMC. As noted elsewhere, VMC expects rapid growth in the coming years and so one of the questions is whether these multiples are warranted and reasonable. Would an investor in VMC be paying for growth?
Valuations
Analyst price targets (Finbox.io) suggest a fair value of $198, which I think is a little optimistic. Analysts have a difficult time forecasting the earnings for the company, with the FAST Graphs scorecard showing 54% misses for one-year forecasts (with a 10% margin of error) and 62% misses for two-year forecasts (with a 20% margin of error).
What can we expect from future growth? The long-term expectations for annual EPS growth are reasonable, with estimates of 19.15% (Yahoo) down to 14.7% (Factset, through FAST Graphs). Given the Factset analyst expectations of 30% in 2023 followed by 27% in 2024, this suggests that 2025 and 2026 could be very lean years.
To understand the impact, I’ve also generated a couple of other models. VMC has limited dividend history and so the use of dividend models is limited. Therefore, I’ve used a P/E Multiples model, which suggests a fair value of $171.98. My 10Y DCF Revenues & Exit model suggests a fair value of $194.38. Usually, I’m fairly happy with a DCF model, but this still seems high to me.
Using P/E ratios and our expectations for movements of the price back to a normalized level against the earnings, I like to use FAST Graphs to understand the likely returns.
First, the company has exhibited strong growth in earnings with expectations for EPS growth of 30% in 2023 and 27% in 2024 (Figure 5). Therefore, rather than considering a 15x P/E ratio, I will switch to using P/E=G for 21.69x. As we can see below in Figure f, if we use the analyst estimates for the end of 2024 with prices maintaining this P/E ratio and earnings reaching the estimates, we expect a price of $27, 18.2% total rate of return, and 7.39% annualized rate of return. This is a conservative estimate, and as we can see, the recent prices exceed this P/E multiple. However, if we look at the analyst estimate changes (at the bottom of the chart in Figure 5), we can see that the estimates have been revised down considerably in some cases, although not as much as I see in other companies, it gives a reason to pause and consider a conservative outcome.
Figure 5. VMC analyst estimates using PE=G ratio for 2024 (FAST Graphs)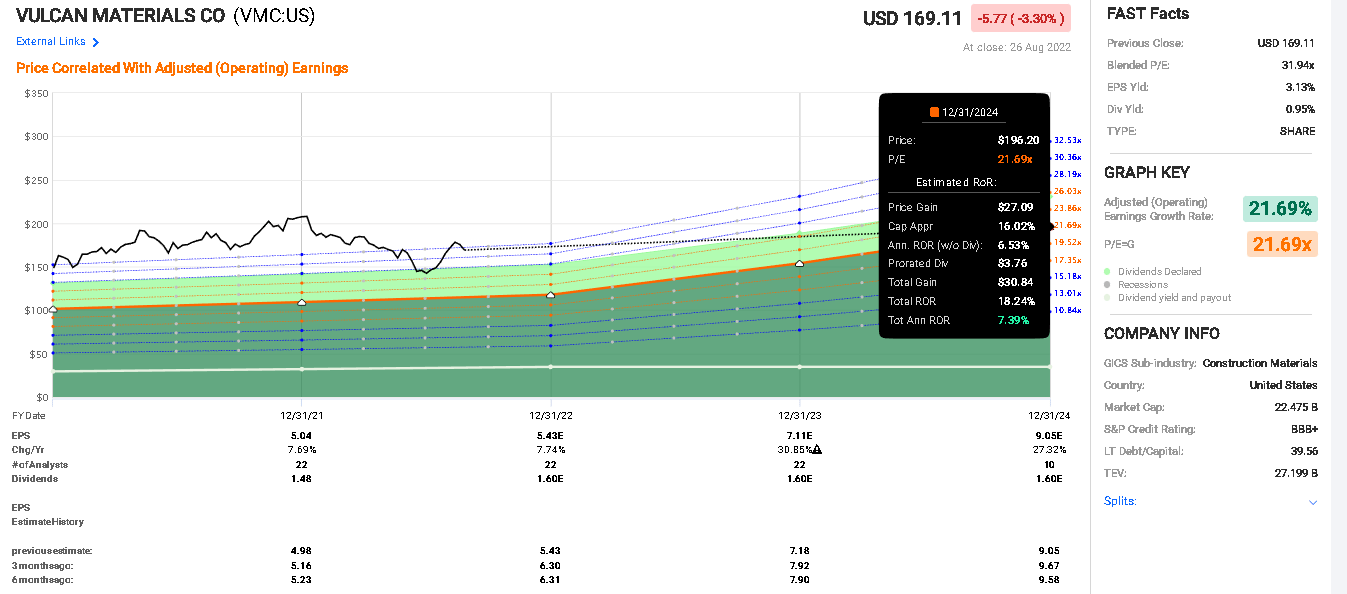
A more optimistic investor might consider the use of a normalized P/E ratio more reasonable (Figure 6). Over the last five years, VMC has traded with a P/E ratio of 36.4x, which is rich and possibly not warranted. However, if we assume they maintain this P/E ratio and the analyst estimates are met at the end of 2024, it would give us an expectation of a price gain of $160, a total rate of return of about 98%, and annualized rates of return of about 33%.
Figure 6. VMC analyst estimates using a normalized P/E ratio for 2024 (FAST Graphs)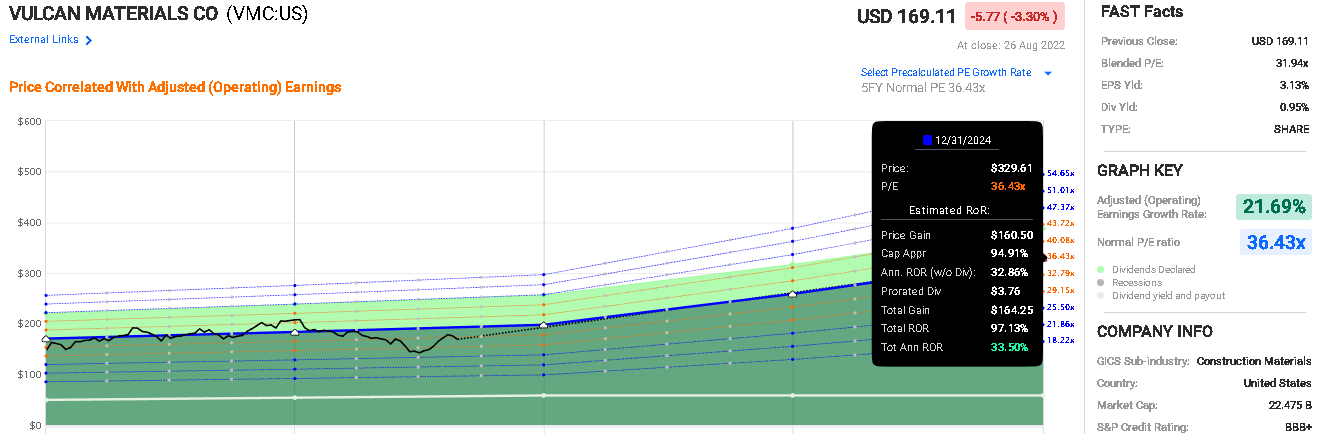
Thesis
VMC is a relatively richly valued company, but with the expectations of strong growth. While analysts are particularly bullish on the future prospects, I remain cautious about the growth, particularly as we head into a more recessionary environment which may result in a slowdown in construction and VMC’s core business.
VMC is a solid business and one that should be relatively reliable. They have proven to be a strong management team focused on maintaining and enhancing efficiencies, with the recent U.S. Concrete acquisition being nicely incorporated and lifting the VMC aggregates business.
Using the more conservative P/E=G ratio and analyst expectations for 2024, I believe investors can reasonably expect some gains in this stock but there is the potential for downside that needs to be accounted for, despite the strong expected EPS growth in 2023 and 2024 expected.
As a result, I suggest that VMC is a hold for investors.
Be the first to comment