

da-kuk/E+ via Getty Images
This article was first released to Systematic Income subscribers and free trials on Apr. 1
Welcome to another installment of our BDC Market Weekly Review where we discuss market activity in the Business Development Company (“BDC”) sector from both the bottom-up – highlighting individual news and events – as well as the top-down – providing an overview of the broader market.
We also try to add some historical context as well as relevant themes that look to be driving the market or that investors ought to be mindful of. This update covers the period through the last week of March.
Be sure to check out our other Weeklies – covering the Closed-End Fund (“CEF”) as well as the preferreds/baby bond markets for perspectives across the broader income space. Also, have a look at our primer of the BDC sector with a focus on how it compares to credit CEFs.
Market Action
It was an exceptional week for the BDC sector, with all but one company (in our 29-name coverage universe) rallying. The weekly total return for the sector was 1.75%.
Year-to-date about three-quarters of the sector is in the green. The underperformers are either high-valuation BDCs which have come off nosebleed levels or idiosyncratic cases such as (BXSL), under pressure from lock-up expirations, or (HRZN) which had a large public stock offering.
Systematic Income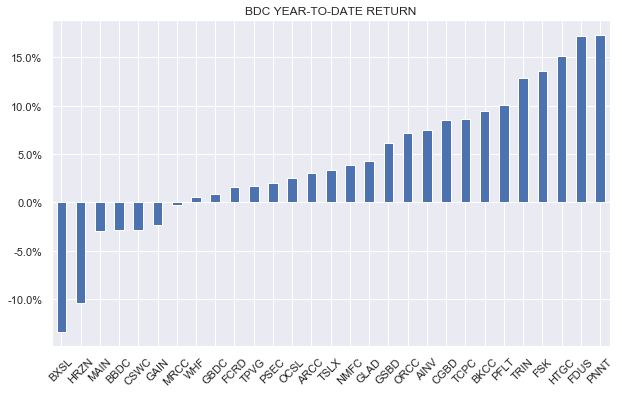
With two months behind us, BDCs are only one of four sectors in the green year-to-date. This resilience is probably not something most investors would have expected coming into the year. As we have discussed in previous weeklies, the combination of relatively range-bound credit spreads which have now retraced most of their widening, a very low default environment, corporate margin strength and a sharp rise in short-term rates, which is expected to boost BDC net income levels, have all supported the sector.
Systematic Income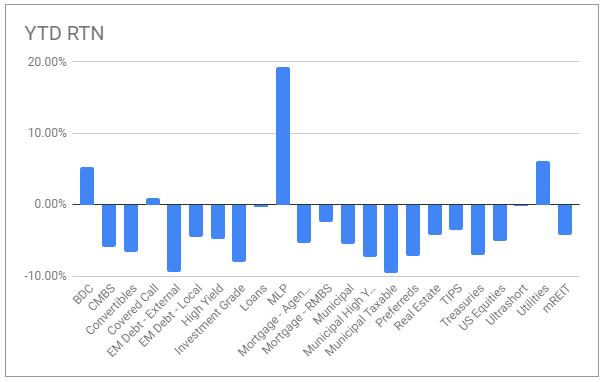
Market Themes
Our experience is that investors are increasingly looking across different investment vehicle silos in their search for attractive income opportunities. Something we discussed on the service recently was a quick comparison between two Ares credit investment vehicles – the BDC Ares Capital Corp (ARCC) versus the CEF Ares Dynamic Credit Allocation Fund (ARDC).This was prompted by a comment on a public article along the lines of “why would I hold ARDC when I can hold ARCC?”
This view of ARCC over ARDC is very likely driven by the simple fact that ARCC has delivered consistently stronger historic returns. In the table below we compile a list of managers with both BDCs and loan CEFs along with the key metrics and performance numbers for each type of vehicle.
Systematic Income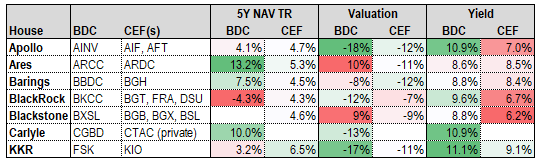
The table shows that ARCC has outperformed its Ares CEF counterpart by around 8% per annum over the last 5 years. Given this stark outperformance, it does raise the obvious question of why investors should hold loan CEFs at all. However, before we rush to sell all of our loan CEFs, let’s consider this BDC vs. CEF allocation question more broadly.
First, focusing on performance, Ares stands out with an unusually large outperformance of its CEF. There are not many other data points – only 5 in total. However, within this pool, 3 of 5 investment house CEFs actually outperformed BDCs (e.g., in Blackrock, KKR and Apollo). This suggests that the performance of ARCC is not necessarily indicative of the overall BDC vs. CEF performance space, making it a poor choice for making generalizations on this topic.
Second, the performance variation of CEFs is much smaller – the worst-performer at 4.3% and the best-performer at 6.5% – a range of 2.2%. In the BDC space, the performance variation is much larger ranging from -4.3% to 13.2% – a range of 17.5%. The BDC performance range is a crazy high multiple of near 8x of the CEF performance range. What this tells us is that there is much more of an element of luck in BDC allocation and less so in CEF allocation. In short, unless investors have perfect foresight, it makes a lot of sense to diversify more in the BDC space than in the CEF space.
Third, total NAV outperformance of ARCC is useful but not equally monetizable because of the difference in valuations. Once we take the valuations of ARCC and ARDC into account this outperformance on price will be closer to 6% rather than 8% even if ARCC outperforms ARDC by the same staggering 8% per year in total NAV return terms over the next 5 years.
Fourth, we need to consider the actual market environment of the last 5 years and how this might evolve over the medium term. It is fair to say that the last 5 years have been very favorable for both credit and equity markets. The credit default rate has been exceptionally low, private equity was firing on all cylinders (leading to large prepayment fees for BDCs) while equity returns have been very strong.
Because BDCs are more highly leveraged (ARCC is roughly 55% or 1.2x debt/equity vs. ARDC which is 38% leveraged i.e., 0.6x debt / equity) and tend to hold exposure to common stock and warrants (ARCC has a close to double the average BDC equity allocation at 13%) they would have benefited much more from this trend than loan CEFs which have essentially zero equity exposure and run at much lower leverage.
Fifth, BDCs not only have higher-yielding assets, but also have more levers with which to generate returns – specifically via prepayment fees as well as warrants.
Finally, BDCs operate at a much higher leverage, have a much higher equity allocation and invest in lower-quality holdings (judging by the fact that BDC asset discount margins are often 20-100% above the discount margins of loans held by loan CEFs). This unusual combination of higher-beta / higher-risk holdings and higher leverage is all due to the exorbitant privilege of not really having to mark their holdings to market. This makes BDCs less liable to a forced deleveraging. For example, it simply defies belief that the ARCC total NAV return in Q1 of 2020 was really -8% (-10% BDC average) while that of ARDC was -27% (roughly in line with loan CEF average). This ability to smooth out market volatility makes BDCs much more resilient to temporary market liquidity shocks.
Overall, it is true that BDCs have delivered significantly higher returns over the last 5-10 years than loan CEFs. This was due to higher yields of their underlying assets, higher level of leverage, structural resilience and other factors. At the same time, in our view, if the Fed does deliver on its promise to overtighten (judging by the latest dot plot) and tips the economy into a recession, loan CEFs could very well remain more resilient and defensive given their lower leverage and ability to more quickly exit their holdings.
Overall, we have a constructive view on both BDCs and loan CEFs and hold both in our Income Portfolios. In our view, few securities are all-weather holdings and this includes BDCs. Rather than falling in love with a single security or investment vehicle type, investors are more likely to achieve their investment goals by looking across a broader pool of income investments and adjust their allocation stance based on valuation levels and a likely trajectory of both the macro and market environment over the medium term.
Market Commentary
PennantPark Investment (PNNT) will transfer its listing from the Nasdaq to the NYSE. It does feel odd for a BDC (and not a particularly tech-oriented one) to be listed on the Nasdaq. And it’s true that the biggest Tech names like AAPL, MSFT, GOOG, and FB are all on the Nasdaq, but the exchange also has some “boring” names like Costco, PepsiCo, Starbucks, and others, so it’s a bit of a hodgepodge.
At the same time, it’s not a total surprise to find PNNT on the Nasdaq since some of the bigger BDCs like (ARCC) and (PSEC) also trade on the Nasdaq. Apart from the sector orientation, key differences between the two exchanges are that Nasdaq allows smaller companies and their listing fees are lower as well. Moving from the Nasdaq to the NYSE is fairly common – about $1.3trn in market cap has made this move this century. The most common reasons are probably visibility and prestige. There is a big song-and-dance NYSE makes about their market model which involves a human market maker who uses some discretion and additional liquidity to dampen volatility but it’s not clear who much value this really adds.
This move is notable since PNNT has been trying to revive its share price – the valuation remains very low at 79%, or 30% below the sector average, though it has risen recently. The company has also instituted a repurchase program which should further support the price. We have held PNNT in our High Income Portfolio since October of last year – since then it has generated at 25% return in less than six months. It continues to carry our “Buy” rating.
Prospect Capital Corporation (PSEC) announced they have issued $600m total in preferred liquidation preference. This equates to around a 7.0x equity / preferred coverage which is still very high as these things go, particularly given the company’s 50% first-lien allocation in the portfolio and a 0.4% non-accrual rate. A more intuitive way to show this is that the company’s assets can all go down to 42% (i.e., lose nearly 60% of their value) and the preferreds (OTCPK:PSECP) will still be whole. PSEC-A remains pretty attractive at a 6.64% yield – the stock is down about 4% in the last 3 months which is on par with the rest of the preferreds market. If the entire $1bn of the private preferred program is utilized coverage will be 4.1x and asset recovery rate would be 46% for the preferreds to be made whole – still pretty good.
Systematic Income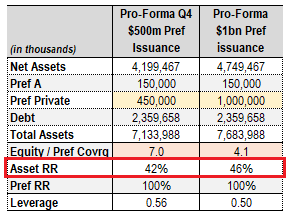
Stance and Takeaways
Overall, we remain constructive on the BDC sector and have “Buy” views on 3 of our 6 holdings (with the rest at Hold). We took off a “Buy” rating off our Fidus Investment (FDUS) position, as its valuation has run up nicely and is at the higher end of its differential to the sector over the last 4 year or so.
Systematic Income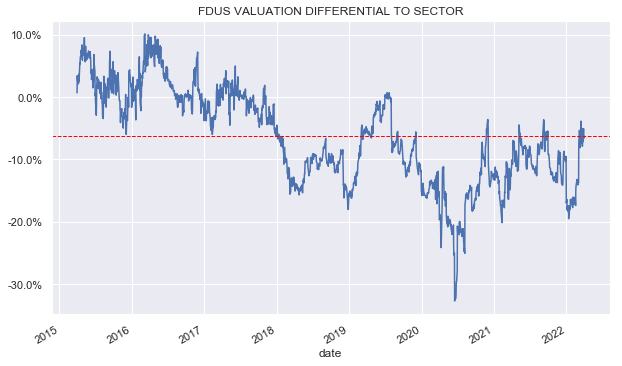
The key question for investors is whether the Fed will be able to avoid tipping the economy into a recession as it fights to temper inflation. The Fed says it can (based on its labor market expectations), however the market is not really buying it. This is, in part, because the Fed doesn’t have a great track record of achieving a smooth landing during hiking episodes and also, in part, because the market views the Fed jawboning as just posturing.
Most likely, the Fed still thinks inflation will fall on its own and all it has to do is wait it out and talk tough in the process. This suggests that it is unlikely to adopt a truly hawkish posture very soon which should put off a Fed-induced recession for at least another year. This suggests that BDC allocations should remain in place, with investors taking advantage of the occasional dips as they wait to benefit from rising short-term rates.
Be the first to comment