


Astrid Stawiarz
Investment Thesis
While we like VTI’s exposure to beaten down small-caps, the index is dangerously overweight the United States (99.9%) at a time when American stocks are perhaps more popular than ever before. The United States now accounts for 60% of the world’s stock market capitalization:
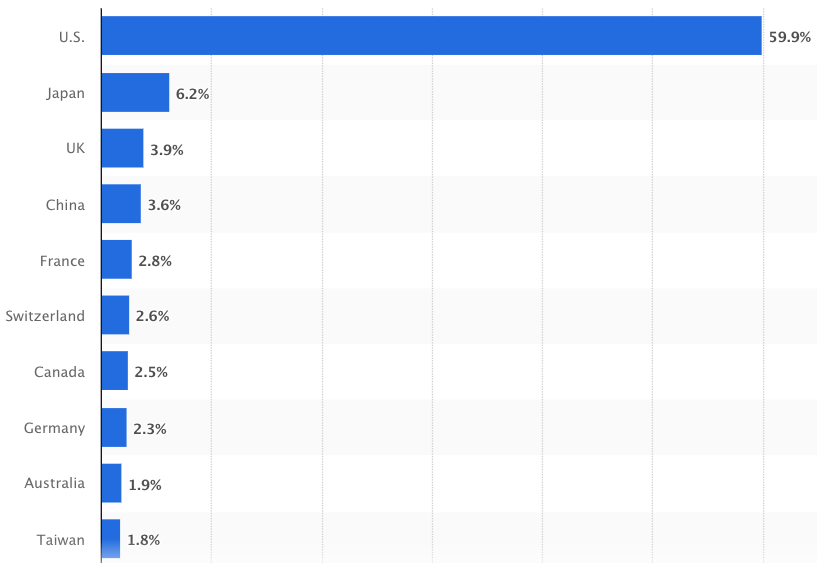
Share Of Global Equity Market Value By Country (Statista)
Issues in Europe and China have caused investors to flee global markets, flocking to the “safe haven” of the U.S. dollar and the world’s most popular investment, the S&P 500. In this flight to safety, investors have preferred “defensive stocks” such as Johnson & Johnson (JNJ), UnitedHealth Group (UNH), and Walmart (WMT), all of which are now priced for exceptionally low long-term returns.
In addition, the darlings of the bull market, Tesla (TSLA), Amazon (AMZN), Apple (AAPL), and Microsoft (MSFT) have benefited in a stimulus induced world of COVID-19. We’re now in a world of quantitative tightening and higher interest rates. A rude awakening may have just begun for these companies. Not only do they trade at high valuations in terms of price to book, price to sales, and price to earnings, but some of them may be at a cyclical peak in earnings. Collectively, these popular and overvalued assets make up a large portion of what you’re buying when you buy the Vanguard Total Stock Market Index (NYSEARCA:VTI).
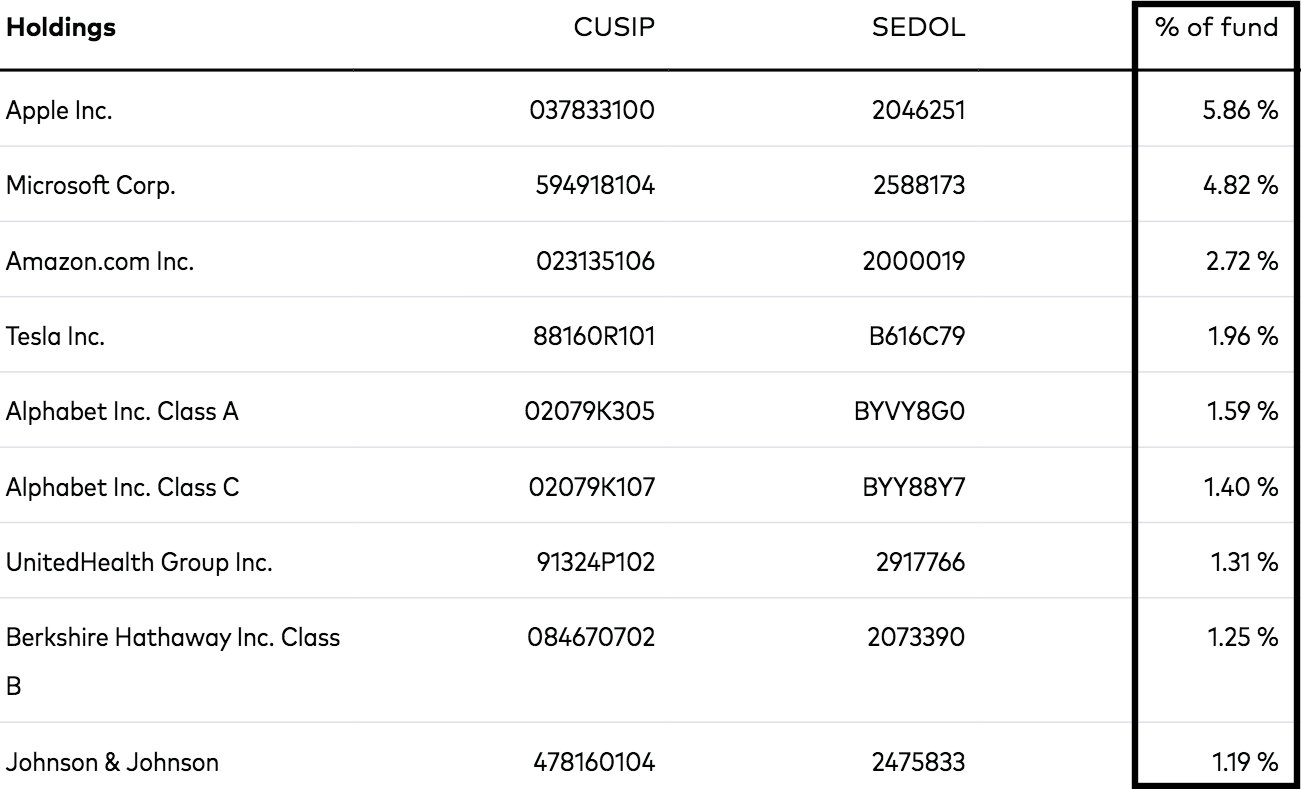
VTI’s Largest Holdings (Vanguard)
In summary, the problem with buying market-cap weighted ETF’s is that you’re buying more of what’s popular and less of what’s unpopular.
While Michael Burry recently admitted he’s beginning to feel greedy, his bullish call is very targeted:
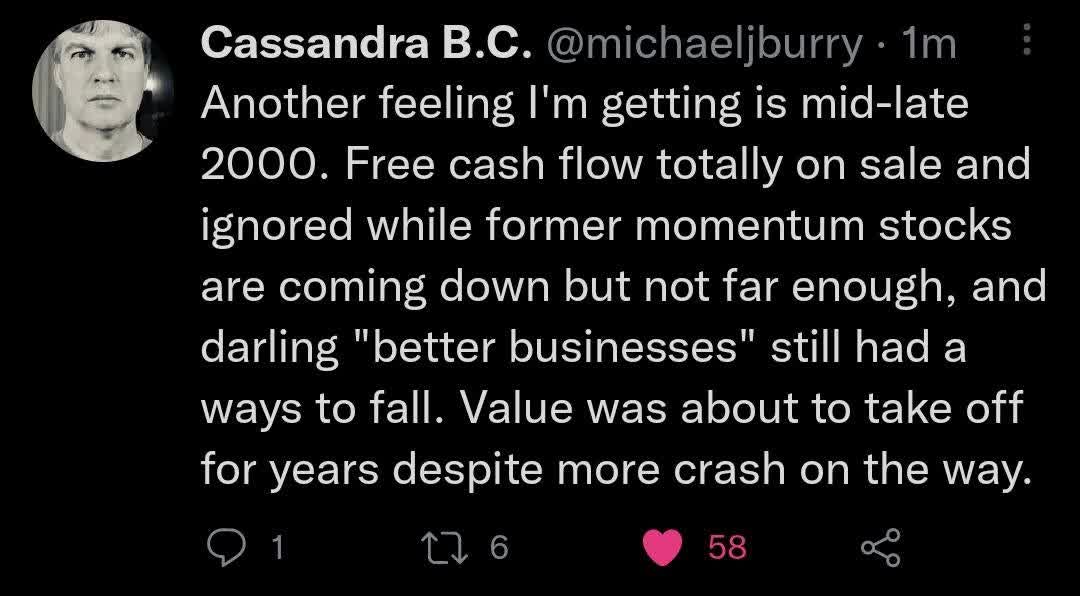
Michael Burry Tweet October 1, 2022 (Reddit)
Burry is calling for a value bull market, much like we had from 2002 to 2007. In the bubble of 2000, Coca-Cola and Microsoft traded at more than 50x earnings. As a result of this overvaluation, their stocks were flat for the next seven years. During the same seven years, emerging markets and oil companies like Exxon Mobil (XOM) absolutely crushed:
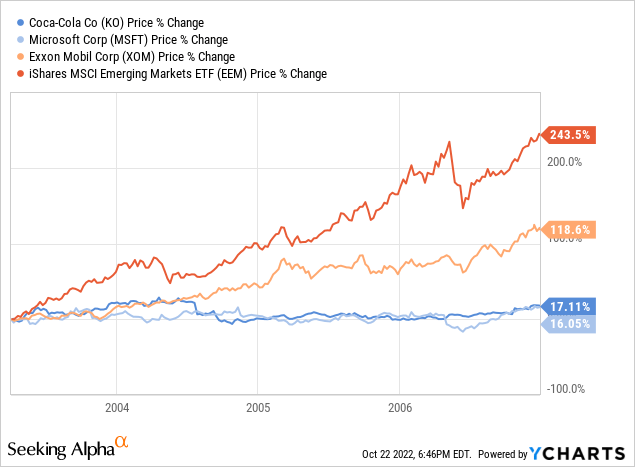
During this same period, VTI gained a volatile 3% per annum:
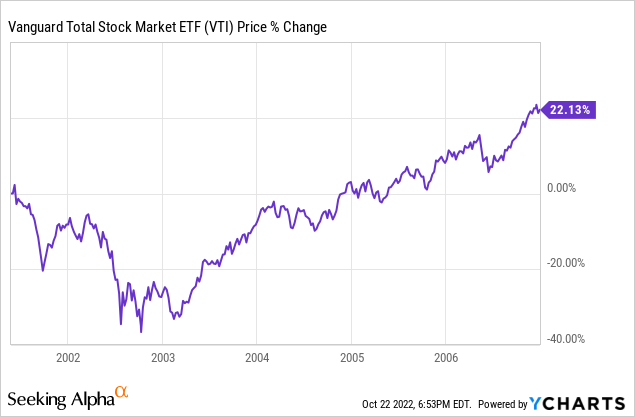
In the words of Mark Twain, “History doesn’t repeat itself, but it often rhymes.” In the decade ahead, we project returns of 5% per annum for VTI.
Four Problems For American Stocks
1) The Cyclicality Of Earnings
If we look solely at VTI’s PE ratio of 17, things aren’t looking too bad. The problem is, this is a backward looking number, and it doesn’t account for the cyclicality of earnings. According to Siblis Research, the cyclically adjusted PE [CAPE] of the Russell 2000 was still at 60x earnings in June. The S&P 500 currently has a CAPE ratio of 28x earnings. This indicates that the price is still exceptionally high when you take into account the earnings of the entire business cycle.
VTI’s trailing 12 month earnings still reflect the shopping spree of a stimulus induced economy, firing on all cylinders at the end of 2021. That won’t always be the case. Corporate earnings move up and down with the business cycle. With commodity prices having run up and the money supply winding down, forward earnings are likely to come in weaker than expected.
Another indication that we’re at a peak in earnings is what’s been happening with profit margins:
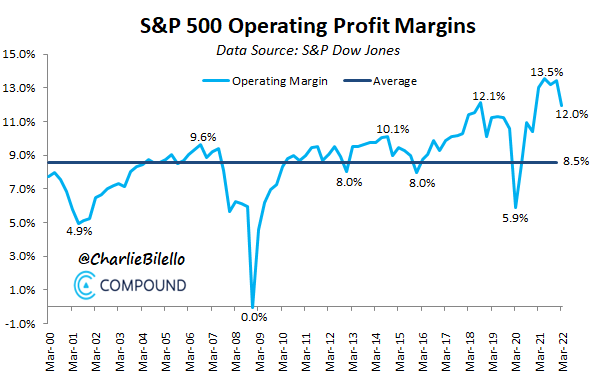
S&P 500 Operating Profit Margins (Charlie Bilello on Twitter)
2) Reliance On Globalization
In 2000, Warren Buffett foresaw the bubble by looking at what is now known as the “Buffett Indicator.” This indicator is the U.S. stock market capitalization as a percentage of GDP. During this great period of globalization we’ve experienced, U.S. companies have expanded into foreign markets more than ever before causing some to say this indicator is outdated. However, the war in Ukraine and sudden departure of American business from Russia is a just a small sample of what happens when globalization reverses. The “Buffett Indicator” is still above where it was in 2000:
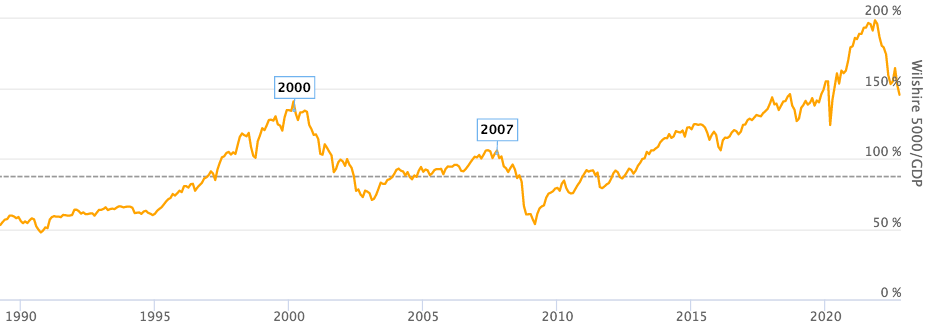
The Buffett Indicator (Longtermtrends)
3) An Exceptionally Strong U.S. Dollar
Stanley Druckenmiller has been warning of a recession in 2023, and part of his thesis is that high oil prices and a strong U.S. dollar are typically bad for forward corporate earnings. As the U.S. dollar strengthens, it becomes more expensive for other countries to purchase U.S. exports. This can cause a decline in earnings as countries pivot away from American goods.
Currency strength is two fold; it tends to decrease future earnings, but it makes trailing earnings look more attractive to investors. As the U.S. dollar gains against other currencies, as it did from 2008 to 2022, U.S. stocks tend to outperform. But, as the U.S. dollar falls against other currencies as it did from 2002 to 2008, international stocks usually outperform. The U.S. dollar has reached an important threshold of strength against other currencies. From these levels, the currency has fallen tremendously in the past:
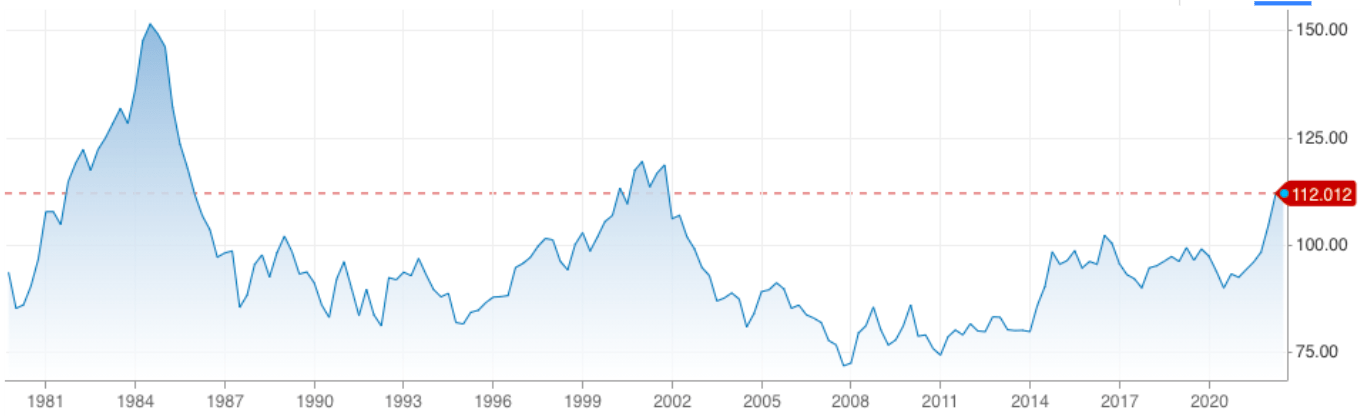
DXY U.S. Dollar Index (CNBC)
4) The National Debt
The United States has effectively borrowed from its future to fund this boom. All of the money printing by the federal reserve has resulted in record government debt to GDP:
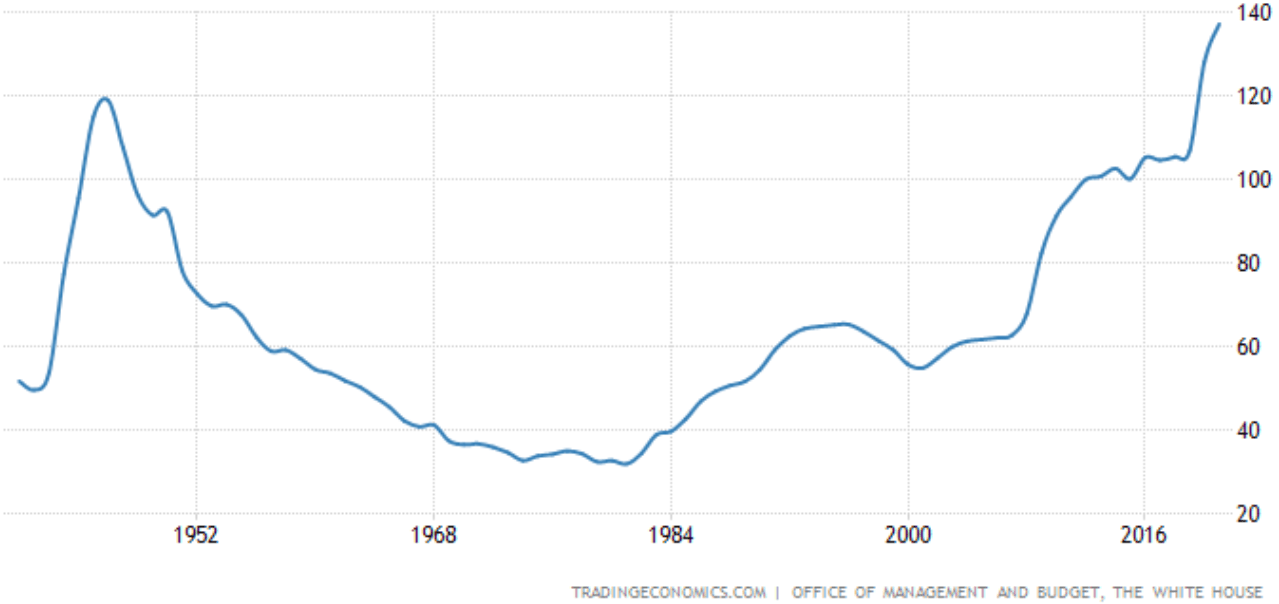
U.S. Government Debt To GDP (Trading Economics)
This debt will have to be paid back with personal and corporate tax. We could see corporate tax rates increase over the years as a result.
More women joined the workforce in the 1940’s, which resulted in a huge increase in productivity, allowing the government to pay down its debts. It remains to be seen how the country will deal with its enormous debt pile this time around.
Long-term Returns
S&P 500 earnings have grown at 6.5% per annum since 1980. But, as you can see, that was on the back of a very accommodative fed, globalization, and peak profit margins. We’re afraid the future will not be as good as the past in this case. S&P 500 earnings hit a major peak in 2000 and again in 2007. Both times, earnings over the following 10 years barely grew at all, averaging growth of just 2.5% per annum. This may be another one of those, and we now believe our prior estimates in the article S&P 500: A Warning To All Investors may have been too bullish.
- Our 2032 price target for VTI is $255 per share, implying returns of just 5% per annum.
This is the result of growing the current EPS ($10.96) at 4.5% per annum, reaching EPS of $17 per share in 2032. We’ve applied a terminal multiple of 15x. This is simply our base-case scenario.
Conclusion
American equities have more problems ahead than investors currently realize. Namely, the cyclicality of earnings, dependence on globalization, a peaking U.S. dollar, and the national debt. Michael Burry has indicated that value’s about to “take off for years” while VTI’s market darlings decline. The VTI implications of this are low returns, in relation to both bonds and inflation over the next ten years. We’d pivot to global investing and deep value. If this is a late 2000 moment, these asset classes could be about to take off as Burry depicts. Until next time, happy investing.
Be the first to comment