


J Studios
In my most recent articles, I’ve pointed out the challenges faced by ETFs whose main focus is their dividends now that we are entering an era of high inflation and rising rates. The comments I received in response to these articles make it clear how strong investor belief is that dividend growth in and of itself is a factor that will lead to outperformance for reasons that go beyond their supplying investors with income.
Most ETFs that use dividend growth as a criteria for selecting stocks also use other parameters to screen the stocks they hold, which give them a strong value tilt. Many also limit how many stocks they hold so that they only hold the best performing dividend growth stocks. These ETFs also may make big changes to their holdings when they are reconstituted every year. These additional selection factors make it very hard to know the extent to which dividend growth itself contributes to the performance of the stocks in these dividend growth ETFs.
That makes it worth taking another look at the Vanguard Dividend Appreciation ETF (NYSEARCA:VIG). When I last looked at it, for an article published two years ago, I Don’t Appreciate this Dividend Appreciation ETF, it appeared to be as close to a pure dividend growth ETF as you will find. It required that a company have a 10-year history of dividend growth, but it did not apply sophisticated value screens to further select stocks.
In September 2020 it held 212 stocks which were far more than was held by several other popular dividend growth ETFs and funds, like the Schwab U.S. Dividend Equity ETF (SCHD), which holds approximately 100 stocks, the S&P 500 Dividend Aristocrats ETF (NOBL) which currently holds 64 stocks, or the actively managed Vanguard Dividend Growth Fund (VDIGX), which now only holds 42 stocks. VIG does hold far fewer than the iShares Core Dividend Growth ETF (DGRO) which currently holds 414 stocks, but it requires twice as long a dividend growth history than does DGRO.
My goal in this article is to explore whether, now that we are in an inflationary environment with rising rates after 40 years of steadily declining rates, VIG’s pure dividend growth focus still has value. In particular, I wanted to see whether it might make it a better investment than the Vanguard S&P 500 ETF (NYSEARCA:VOO), which would be my preferred investment except for its heavy concentration in its top-10 tech-heavy growth stocks.
How Are VOO And VIG Different?
VOO’s Index Is Tracked By Other Popular ETFs And Mutual Funds
The Vanguard S&P 500 ETF holds all the stocks that make up the S&P 500 index (SP500), which is the index financial media use to track the performance of “The Market” as a whole. That same index is tracked by several other very popular ETFs including the SPDR S&P 500 ETF Trust (SPY), the iShares Core S&P 500 ETF (IVV) and quite a few other Mutual Funds. The differences between the performance of these various ETFs and funds is minimal, and where it is present, it is usually due to differences in the expense ratios these ETFs and funds charge and to the skill of their managers in making sure their product mirrors the underlying index.
The S&P 500’s holdings are very closely followed by the financial press as a stock’s price will be influenced by it being added or deleted from that index. So when you buy the Vanguard S&P 500 ETF you know exactly what you will be getting and where your money is being invested.
How Stocks Are Selected For The S&P 500
The S&P 500 is a market cap weighted index that holds approximately 500 large cap stocks, each of which must have a history of a five quarters of profitability in order to be considered for membership. The actual stocks included in the index are a subset chosen from all stocks that are eligible by a human committee. Its goal is to make sure the index holds stocks that are representative of all the sectors that make up the U.S. stock market. It includes REITs which many other ETFs, including VIG, exclude.
The principles by which the S&P 500 index operates have not changed in decades. The only change I have noticed as long as I have followed it is that the definition of “Large Cap” it uses in its selection criteria has grown along with the median market caps of its holdings.
VIG Tracks A Custom Index Sponsored By Vanguard – Which Has Experienced Big Changes
The Vanguard Dividend Appreciation ETF has always tracked a custom index that is tracked by no other security except for the Vanguard Dividend Appreciation Index Fund, (VDADX) a mutual fund that is just another share class of VIG. These indexes are commissioned by Vanguard and as we will see, their formula for picking stocks can and does change, probably in response to lagging performance results compared to that of their ETF’s competitors.
The first thing I noticed when I went back to research VIG was that it now holds 289 stocks, which is a lot more than the 212 stocks it held two years ago.
Then I noticed that Vanguard changed the index that VIG follows in September of 2021 . Back in September of 2020, it followed the NASDAQ US Dividend Achievers Select Index. It has now switched to the S&P U.S. Dividend Growers Index. Vanguard tells us in a footnote in tiny print that VIG’s benchmark index changed on September 19, 2021. You can read the entire, document Vanguard released to institutional holders explaining this change here. That document compares the characteristics of each index, and suggests they are very similar. A slightly more informative discussion of why Vanguard made the change is available in this press release. It quotes a Vanguard executive as saying,
As part of our ongoing due diligence process, Vanguard determined that new benchmarks would best enable our Dividend Appreciation funds to perform in line with their investment objectives.
The information Nasdaq gave us about the previous index, as reported in my September 2000 article, was that it selected stocks of companies that had raised their dividends for at least 10 years, excluded REITs, and applied proprietary eligibility standards. It was a “modified market capitalization weighted index” in which the total price of the shares held was multiplied by a divisor of some sort to come up with the cap weighting. No stock could make up more than 4% of the total value of the ETF.
The Press Release flags the biggest change to VIG’s index. It tells us,
- Buffered yield screens intended to minimize excessive turnover. At each annual rebalance, all dividend-paying stocks in the investible universe are ranked in order of dividend yield with the highest-yielding at the top. A stock will not be eligible for first-time admission to the index if its dividend yield is in the top 25%. During subsequent rebalances, any stock already in the index may remain unless its yield is in the top 15%.
When I looked up the new index at S&P Global, the company that provides that index, also it tells us in the Methodology Document for the index that,
- Real Estate Investment Trust Industry (REITs), are excluded.
- Constituents are float-adjusted market capitalization (FMC) weighted.
- Holdings are subject to a single constituent weight cap of 4%.
- The index is reconstituted each March and updated quarterly.
This sounds to me as if the VIG’s actual mission has changed to some extent, as there was no elimination of high yield stocks in the earlier index, though we can’t know for sure since we don’t know what the proprietary criteria were for the older Nasdaq Dividend Achievers index.
The elimination of the top 25% highest-yielding stocks is something of a head scratcher. Vanguard’s new, dumbed down site redesign appears to have eliminated the section that used to be found in the Portfolio section that went a bit more deeply into the ETF’s investment strategy so we can only guess.
I note that the iShares Core Dividend Growth ETF (DGRO)’s index also excludes stocks with higher than average yields, though in their case, they only eliminate the top 10% highest yielding stocks from its holdings, not the Top 25, and as mentioned before, they only require a 5-year history of dividend growth. Perhaps the thinking is that high yields are a sign that a company is in trouble. Whatever the case, it means that these ETFs missed out on the huge growth of the oil company stocks that are what have rescued some other dividend ETFs during the past year.
You Don’t Invest In Either VOO Or VIG For Income
VIG’s holdings’ dividends might be growing, but Seeking Alpha tells us its trailing 12-month yield is currently 1.94%. Vanguard tells us its SEC yield is even lower at 1.89%. This makes it clear that investors buying into VIG are buying into the idea that Dividend Growth is a factor that will lead to outperformance rather than seeking higher income than they can get from other dividend investing styles.
VOO’s trailing twelve month income is even lower, at 1.57% and its SEC yield is the same 1.57% according to Vanguard, but VOO also includes the non-dividend-paying Growth stocks, and the high-yield dividend stocks that are screened out of VIG.
With Vanguard’s Fixed Income page telling us that 5-year treasuries currently yielding 3.36% and money market funds paying from 2.20 – 2.22% as of 9/2/2022, retirees seeking income can easily buy risk-free income with yields considerably higher than those of both VIG and VOO. Those fixed income alternatives provide income without the worry your invested principal might decline along with the broader market leaving you with less capital at a time when you are suddenly faced with a large, unexpected expense that requires more cash than your dividend income supplies.
How Have VIG And VOO Performed?
Does the price appreciation of VIG Make up for its low dividend and its exclusion of all stocks that either don’t grow dividends or whose growing dividends are in the top 25% or 15% for existing constituents? Let’s take a look at its performance and see.
VIG and Vanguard 500 Index Fund Total Return Since VIG Inception
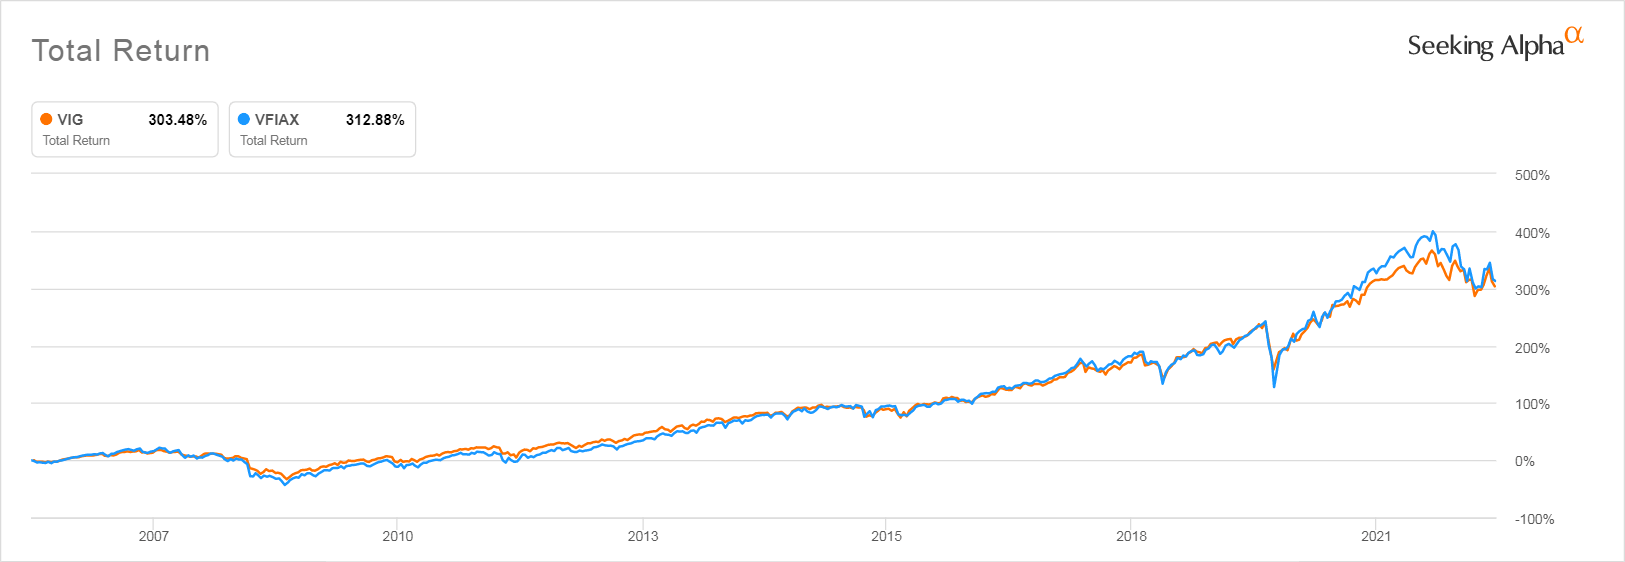
Seeking Alpha
As you can see, VIG has underperformed the Vanguard S&P 500 index fund by 9.4% over the last 16 years, since its inception in 2006, though the S&P 500 fund outperformed VIG by a much greater amount during the COVID-19 period.
So far, VIG’s price has not dropped quite as much as VOO during the period of rising inflation that has taken down the S&P 500 so dramatically since the beginning of 2022. But it’s price has dropped, and since its dividends are so mediocre, that drop is more painful to investors than it would be if their dividend income was more gratifying. The chart below compares VIG’s total return with that of VOO since the beginning of January 2022.
VIG and VOO Total Return YTD
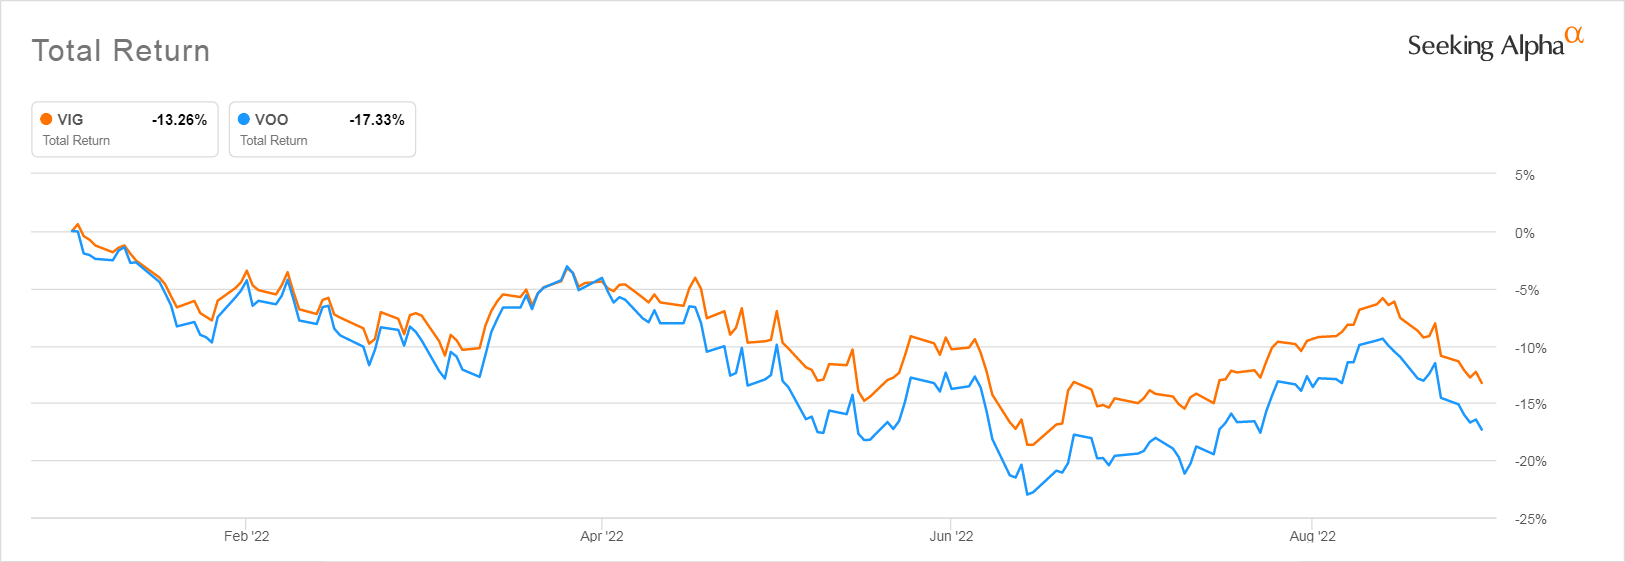
Seeking Alpha
If you look back at the long-term graph above, you will see that even with that slightly better performance during the bear market, investors who held VOO prior to the COVID-19 lockdowns are still ahead of those in VIG because of the greater price growth VOO experienced during the COVID-19 period. The net sum of their earlier growth and subsequent losses provide a return higher than VIG’s.
That suggests that investors in VIG, though they did okay with their investment, did not see the kind of impressive long-term performance advantage that would make you think that its way of defining dividend growth provided investors with an advantage.
But, keep in mind that until September of 2021, VIG was tracking a different index, so it may be a mistake to draw any conclusions about future performance from its performance before September, 2021.
VIG Has Not Traded Through A Period Of Sustained Inflation While VOO Has
Even discounting the change in the index methodologies that VIG underwent last September, investors who study charts of past performance have to remember that they can be very misleading when you look at dividend-focused ETFs. That’s because these ETFs were only trading in a non-inflationary market environment where advisors and well-respected pundits like Burton Malkiel, author of the investing classic, A Random Walk Down Wall Street, were advising retirees to invest in dividend stocks as an alternative to the low yielding bonds and CDs that in the past had supplied them with adequate retirement income.
This led to a huge boom in dividend stocks in general and especially dividend growth stocks. Their surge in popularity drove up their prices, which explains much of total return investors received from VIG.
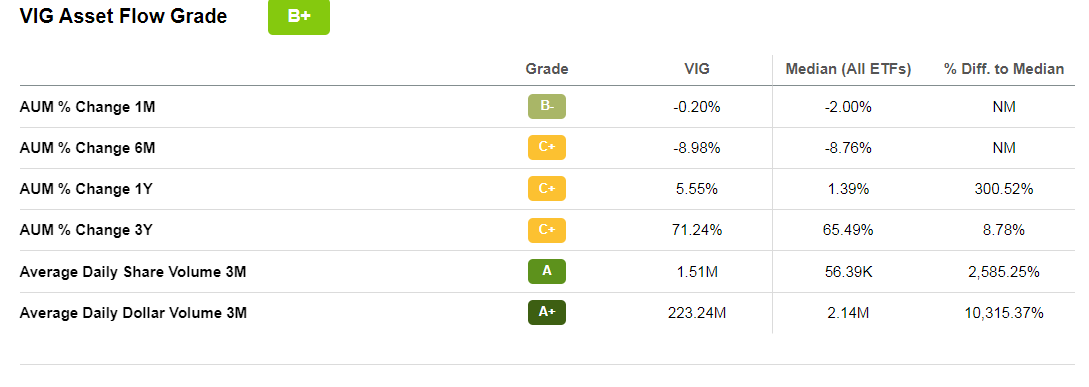
Now that investors are able to get substantial yields from fixed income, the appeal of an investment whose price can drop over 13% in a few months has waned. As you can see from the table below, in recent months assets have started flowing out of VIG at a rate that is slightly higher than that of other ETFs.
Seeking Alpha
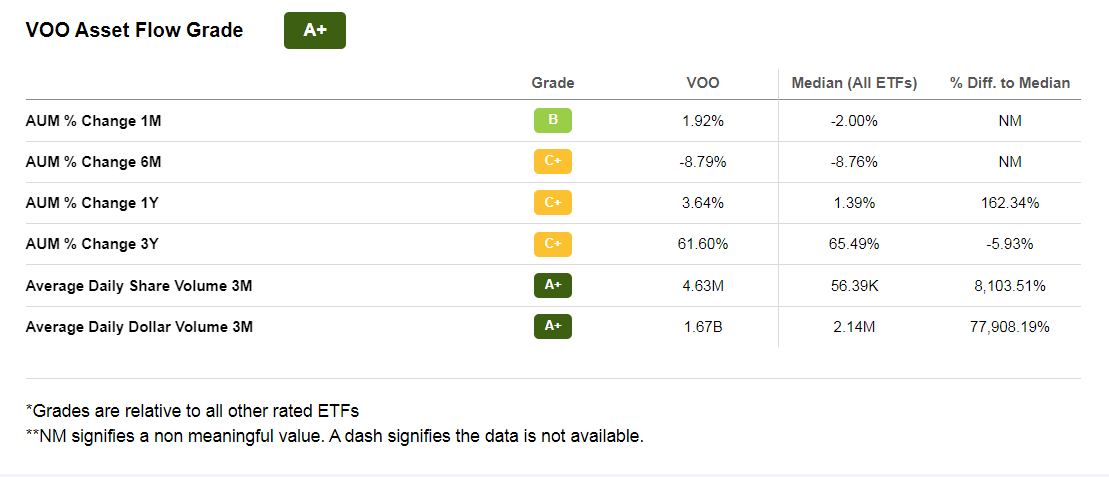
VOO’s Asset Flow, despite its price dropping further than has VIG’s, is better.
Seeking Alpha
Compared to Other Dividend ETFs VIG’s Recent Performance Lags
Below you can see how VIG has performed compared to competing dividend growth ETFs, albeit these ETFs use additional screening mechanisms.
Dividend Growth ETFs in Descending Order of Performance YTD
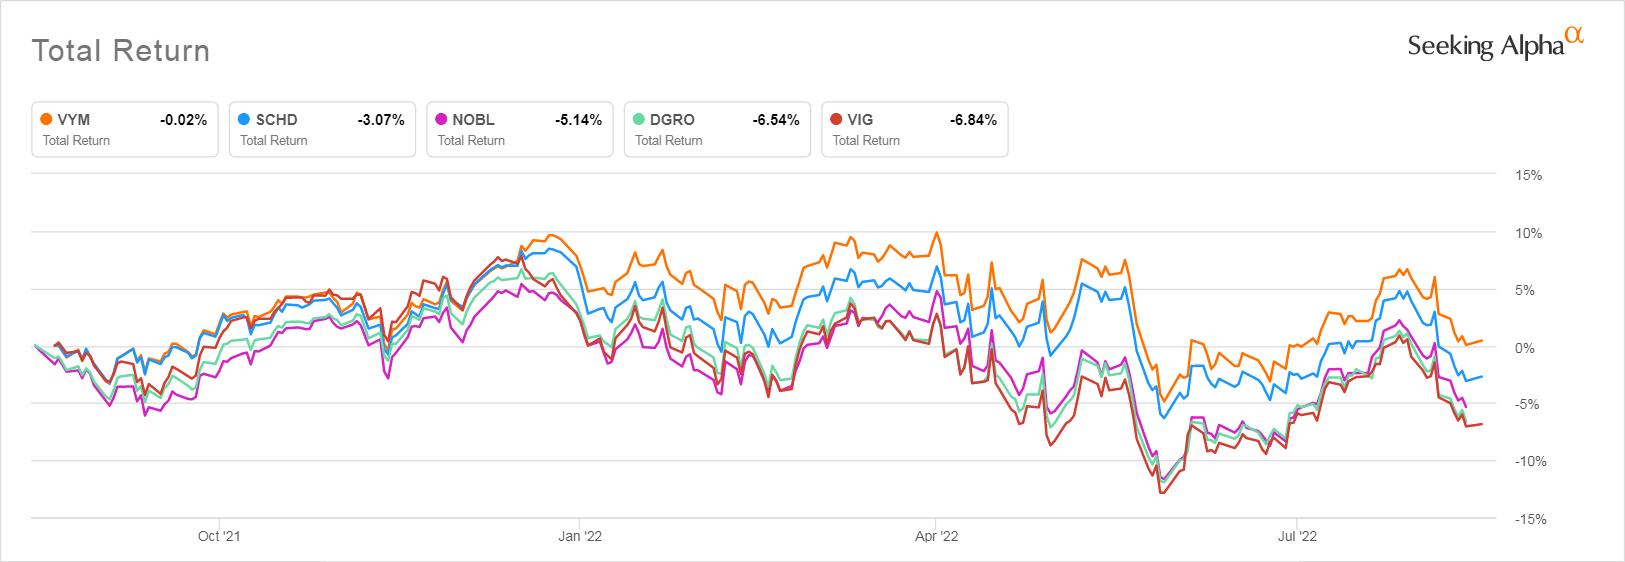
Seeking Alpha
As you can see, the Vanguard High Dividend Yield ETF (VYM) which holds the stocks VIG eliminates and has no requirement that stocks have a dividend growth history has outperformed all the other ETFs significantly in this prolonged inflationary period. the SCHD which applies other valuation metrics in its selection process comes next, The Dividend Aristocrat ETF which requires a 25-year long dividend growth history comes next , but DGRO, which only requires a 5-year history of dividend growth, as compared to VIG’s 10-year history, outperforms VIG. This calls into question the value of a 10-year long history of dividend growth when those 10 years only cover the boom years of dividend growth investing.
If Investors See The Fed Sticking To Stated Policy, Dividend ETFs Will Lose Their Appeal To Income Seekers
It is very clear from the over 100 comments I received in an earlier article that pointed out the potential impact of rising rates on dividend ETFs that most investors who flocked to dividend-focused ETFs during the period of low rates are still convinced that the Federal Reserve will swiftly back down from its stated policy. They expect to see the Fed lower rates within the next year. This flies in the face of the Fed members’ repeated statements that they will raise rates until inflation comes down to their target rate of 2% and will hold rates at higher levels even after inflation abates. Their reason for stating this is that they want to avoid the mistakes that were made by the Federal Reserve in the inflationary 1970s when it was too quick to moderate rates and hence saw inflation renew and eventually surge into the mid double digits.
If the Fed does stick to its policy and the Fed rate rises from its current 2.33% to 4% as voting Fed member Loretta Mester described it doing in a talk on August 31, 2022, dividend investors who don’t see rising rates as a threat to their income investments may be shaken out of their complacency.
VOO And VIG Key Metrics
Finally, to assess whether VIG’s concentration on dividend growth stocks has led to it holding better quality stocks, we need to compare the valuation metrics Vanguard gives us. We have the usual problem with Vanguard, which is that because some of its ETFs including its Dividend Appreciation ETF, are share classes of a larger mutual fund, Vanguard does not have to report its holdings or valuation metrics daily the way other ETFs have to, but can report them with a delay that may be anywhere from a month to six weeks.
That is why the most recent metrics we have from Vanguard for both VIG and VOO are dated as of July 31, 2022, a month ago, when the market was experiencing a bear market rally. This was also before numerous important consumer facing dividend achiever companies which play a big role in VIG reported their earnings. Those companies including The Home Depot (HD), Walmart (WMT), Target (TGT), and Lowe’s (LOW). These four stocks alone make up 5.96% of the total value of VIG, and there are many more holdings that play smaller roles in the ETF that also had not reported by July 31.
Vanguard also reports the metrics for VOO as of July 31, 2022, however in the case of VOO, because it tracks the S&P 500 and the S&P 500’s metrics are reported daily on SPY’s product page, we can get a better feeling for its actual valuation now. But for the sake of comparing apples to apples, let’s look first at how VIG’s fundamentals compared with those of VOO as of July 31.
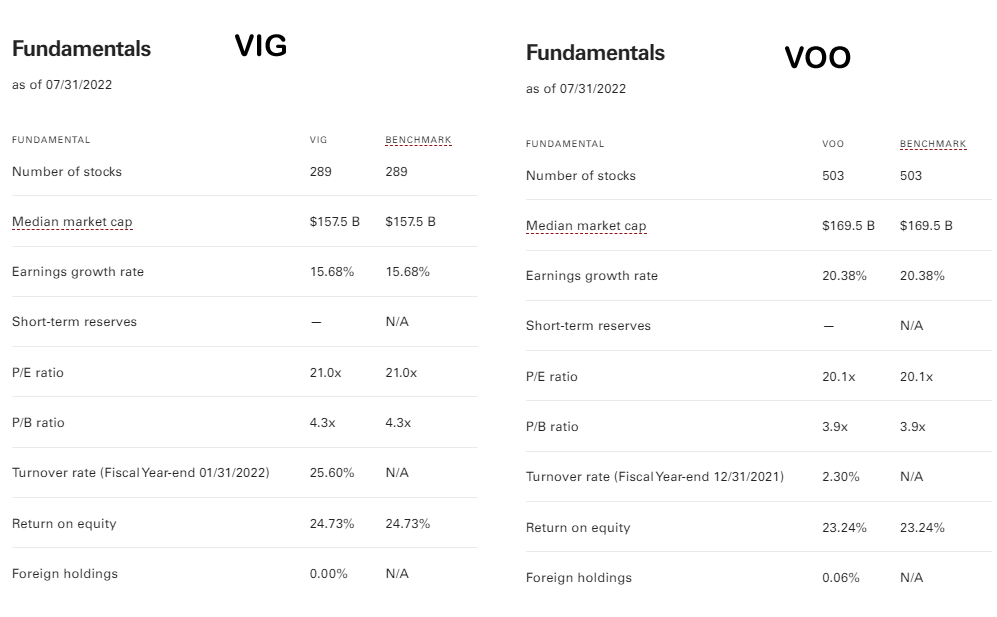
advisors.vanguard.com
Immediately we see that dividend growth has not selected stocks with better valuations. The earnings growth rate overall for VIG’s stocks at 15.68% is far lower than the 20.38% growth rate of VOO’s stocks, but the Price/Earnings ratio of VIG’s stocks at the end of July was actually higher than VOO’s. Even though VOO holds all those growth stocks that are not found in VIG. This is a sign of the extent to which the dividend growth fad of the past decade has distorted the prices of mature dividend-paying stocks, giving them valuations that are hard to defend even for robustly growing growth stocks.
You can also see VIG’s very high turnover rate for the year ending 1/31/2022. Fully a quarter of VIG’s stocks were dropped. This is very likely the result of the change in indexes and perhaps of applying that cull of stocks whose dividends were in the top 25% or 15% ranked by yield. If that is the case, it would suggest that this criterion is new and was not part of the proprietary formula not disclosed by the earlier NASDAQ index.
On the positive side, the return on equity of VIG’s stocks is slightly better than that of the Vanguard S&P 500’s. The median market cap of VIG’s stocks is also slightly lower than that of VOO’s, probably because it doesn’t hold the FAANG stocks that dominate VOO, several of which have multi-trillion dollar market caps. But VIG’s median market cap of $157.5 Billion does not suggest that Mid- or Small-Cap funds play any significant role in VIG’s performance. Not when you remember that the definition of Large Cap starts somewhere around a market cap of only $10 Billion.
Are VOO And VIG Good Long-Term Investments?
We have information about how the S&P 500 performed during the inflationary 1970s and early 1980s. I have gone into this deeply in a previous article, and won’t repeat that information here, but the point made there is that the P/E ratio of the S&P 500 before and during the period following the 1974 oil shock which kicked off the Great Inflation never rose above 11.68. That is just slightly more than half of what it is now. So we have no data about how a highly valued S&P 500 priced for perfection will behave in a sustained inflationary period.
What we do know is that the S&P 500 is theme-agnostic. If oil stocks are where they money is, as was the case in the early 1970s, oil stocks will rise to its top holdings. If consumer stocks become popular as they did in the early 1990s, they will dominate, and if, as is currently the case, tech stocks dominate, they will contribute the most to its earnings. That means that over a long period of time, S&P 500 investors, like those holding VOO, are likely to do better than those investors who put their money into any one specific subset of stocks.
We don’t have any data at all that could tell us how VIG would perform in a period when Federal Reserve rates are closer to what they were in the decades after Paul Volcker brought the high inflation of the 1970s to a halt. Those of us who were adults in those days remember when a 6% mortgage seemed like an impossible dream and how excited we were when mortgage rates dropped to “only” 10% in 1986. I was still getting 10% on a CD as late as 1989 and 7% in the 1990s. Mind you, with brief pauses the stock market was booming throughout this period.
High rates do not kill healthy businesses, despite what you hear from some politically-motivated quasi-news sites. What high rates will do is rid the market of companies that have only been able to survive through imprudent borrowing at very low rates, who used borrowed money to fund buybacks to juice otherwise anemic company earnings or who paid dividends with borrowed money instead of using that money to improve their products and services. Companies like that should be eliminated from a healthy marketplace.
Given that we don’t see compelling evidence that VIG’s methodology gives it a true value advantage that makes it a better buy than VOO, I would buy VOO right now when investing new money in the stock market. In fact, I have started to build a very small position in VOO as insurance against yet another period of market irrationality, but I am not investing any money I might need within the next 20 years.
Overall, I still think both ETFs are very likely to continue to correct and to enter a prolonged bear market period where valuations will come back into focus and present far better buying opportunities for investors looking to deploy new money. And of course, there is no question that VOO is far more likely to rebound when the next growth cycle begins.
Be the first to comment