

Lemon_tm
During the last few weeks, I have been able to find some decent winners for Seeking Alpha readers, both inside and outside the VBR articles. This week’s biggest gainer appeared after I posted a story on CVD Equipment (CVV) here, a device maker for nanomaterials used to build high-speed EV charging devices. Plus, my favorite solar name ReneSola (SOL), mentioned in February here, popped higher on the surprise Democratic climate deal to fund new incentives for green energy. Heavy volume buying backing up the price advance is leading me to add it this week to the official VBR roster. Another renewable energy winner could be Broadwind Energy (BWEN), a maker of steel windmill bases, mentioned in last week’s VBR effort here.
Other big gainers in early August, mainly on positive earnings releases and news events, include Green Brick Partners (GRBK), Sanmina (SANM), Immatics N.V. (IMTX), Ormat Technologies (ORA). Still others have seen wild swings, both up and down in price lately with little overall progress. The whole list of companies mentioned, 25 going into this week equally weighted from the point of selection, has performed slightly better than the S&P 500 average gain (+0.5%), while slightly underperforming the better Russell 2000 index advance (-1.5%).
Repeating for your information, several articles back I talked about a clear “missed opportunity” was deciding to ignore the Target Health (TH) VBR buy signal around $7.61 per share. With the stock at $14 today, all my inclusive performance calculations since the initial June 25th Volume Breakout Report would be outperforming the major U.S. indexes by several percentage points. The lesson learned is to not be shy about buying and holding winners under obvious volume accumulation.
In my research, the best time to own stocks breaking out with volume buying is the next 6-8 weeks, at least in terms of market outperformance. Of course, a number of winners will morph into really big winners 6-12 months down the road, while many others will fade into a more normal rangebound pattern, and a few will reverse into losing selections. Another point to make is the relative performance of newer lists in July has been quite strong, a function of improving market prices overall, and smaller-cap equity outperformance vs. larger-sized blue chips. The latest five weeks of VBR picks have outperformed most U.S. index gains, with an equally weighted +1.5% group advance vs. the S&P 500.
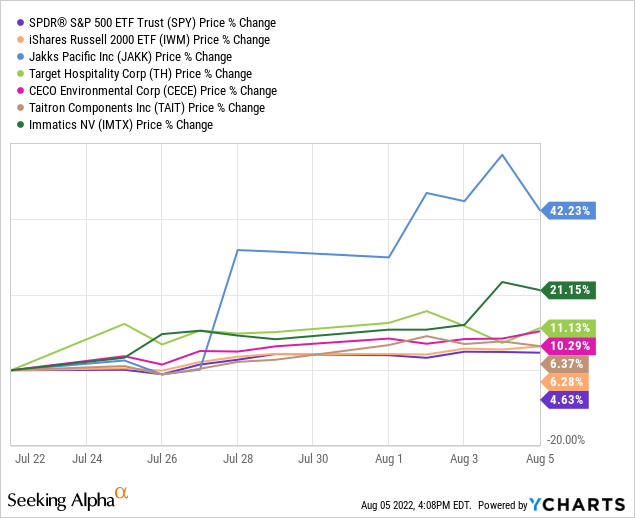
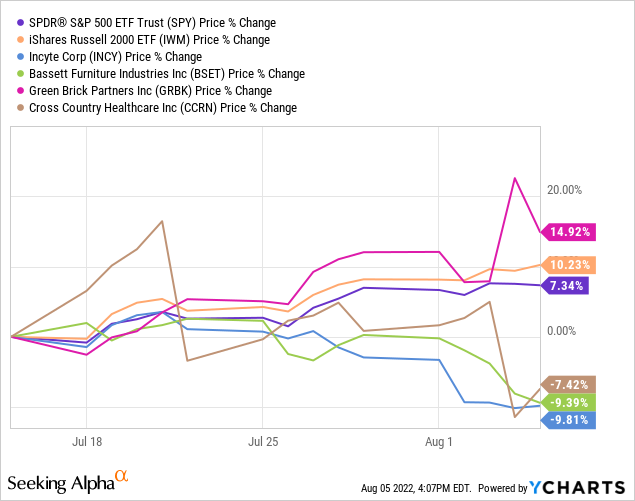
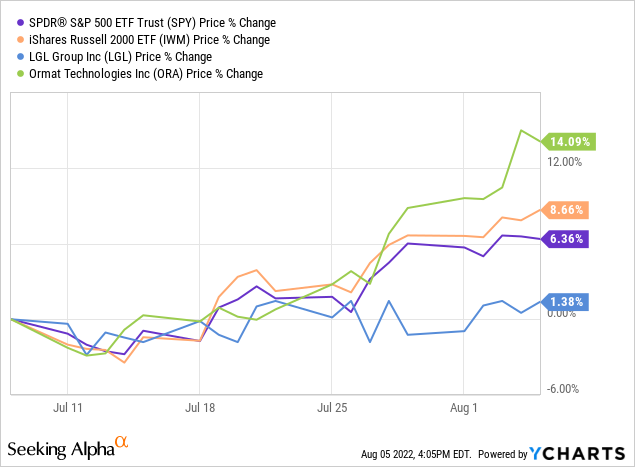
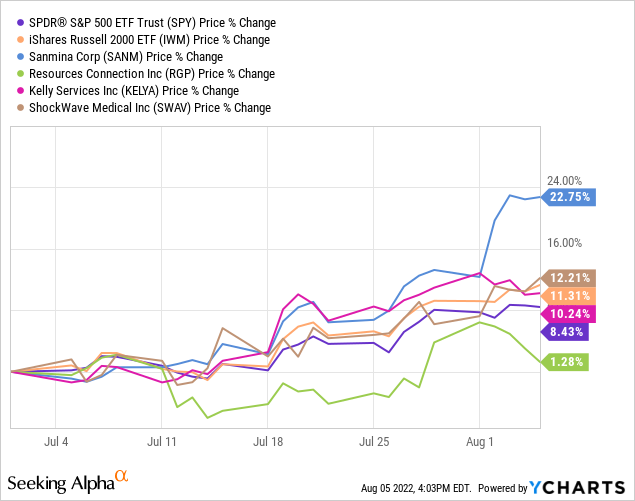
As fate would have it (blind luck actually), the first VBR list from six weeks ago has been the worst group to own for short-term performance. Going forward, I think my plan for reporting on past picks will include a rolling time frame of the last five weeks. Like I have done in previous articles, I believe the best way to track performance is a visual graph comparison vs. the SPDR S&P 500 ETF (SPY) and iShares Russell 2000 ETF (IWM). You can review the most recent 20 picks below.
YCharts, VBR Picks from July 29th YCharts, VBR Picks from July 22nd YCharts, VBR Picks from July 15th YCharts, VBR Picks from July 8th YCharts, VBR Picks from July 1st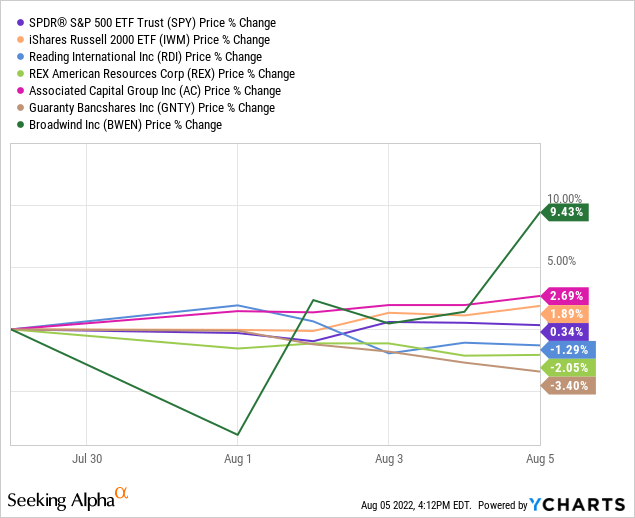
New VBR Buy Signals
ReneSola Ltd.
My favorite idea to leverage the upturn globally in solar farm installations is ReneSola (SOL). Management has been very picky only to enter contracts where it can earn a profit, so growth has been slow in materializing. But two events in 2022 may completely change its investment outlook and turbocharge growth in the near future. First, the Russian invasion of Ukraine has Europe reconsidering how fast it can build out sustainable green energy, cutting its dependence on Russian oil/gas supplies. Second, the announcement of a climate change deal by Democrats in late July will likely bring plenty of new solar farm construction starting next year. Guess what? ReneSola focuses its existing operations on Europe and the U.S. The company is sitting in the right spot to develop and build solar farms ASAP.
Measured against a market cap around $430 million at $7 per share, SOL held $223 million in cash and $308 million in total current assets at the end of March. With just $76 million in total liabilities, the company is set to fund rapid growth without the need for outside capital or extra borrowed funds.
StockCharts.com, 1 Year, Daily Values – SOL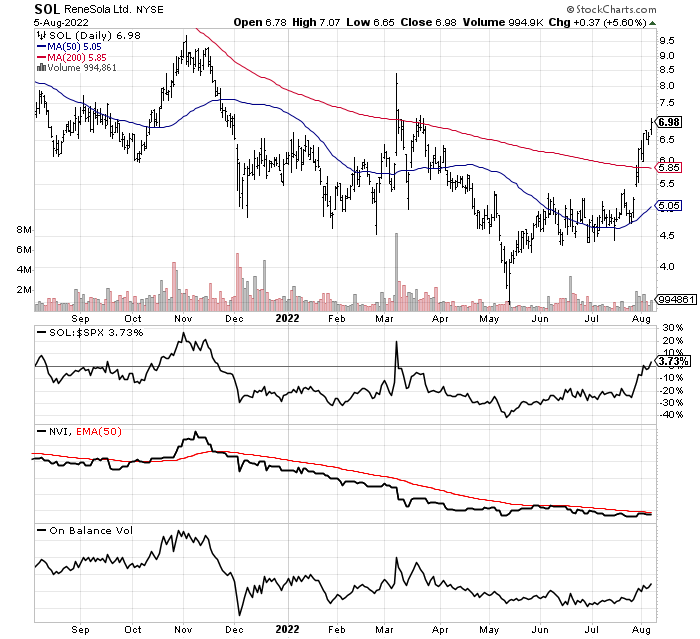
Canadian Solar
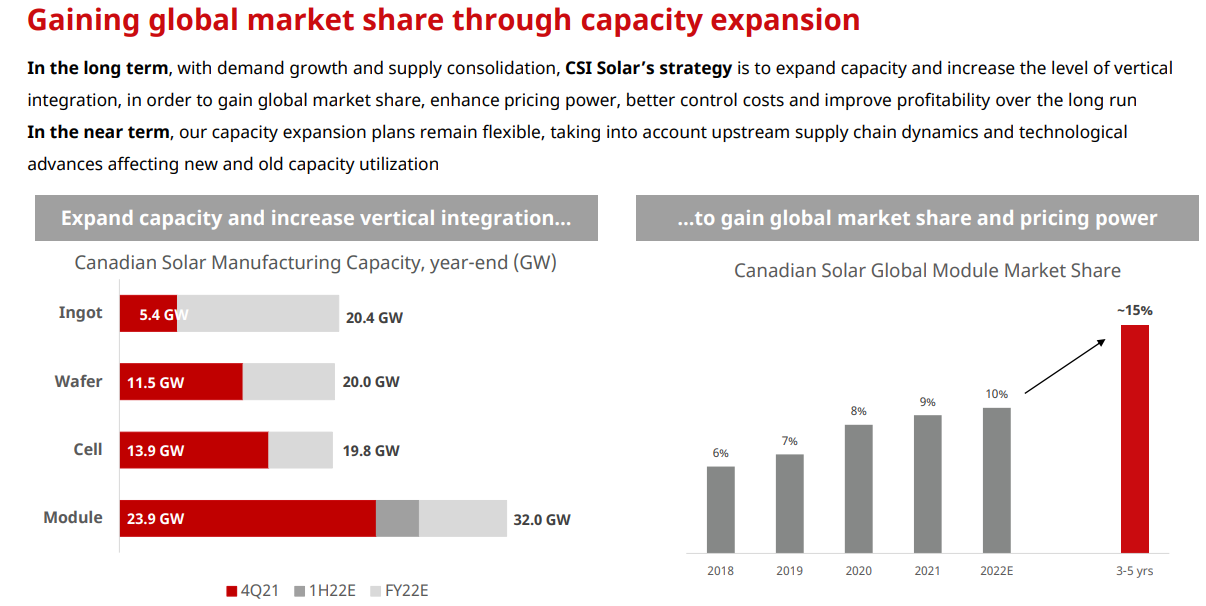
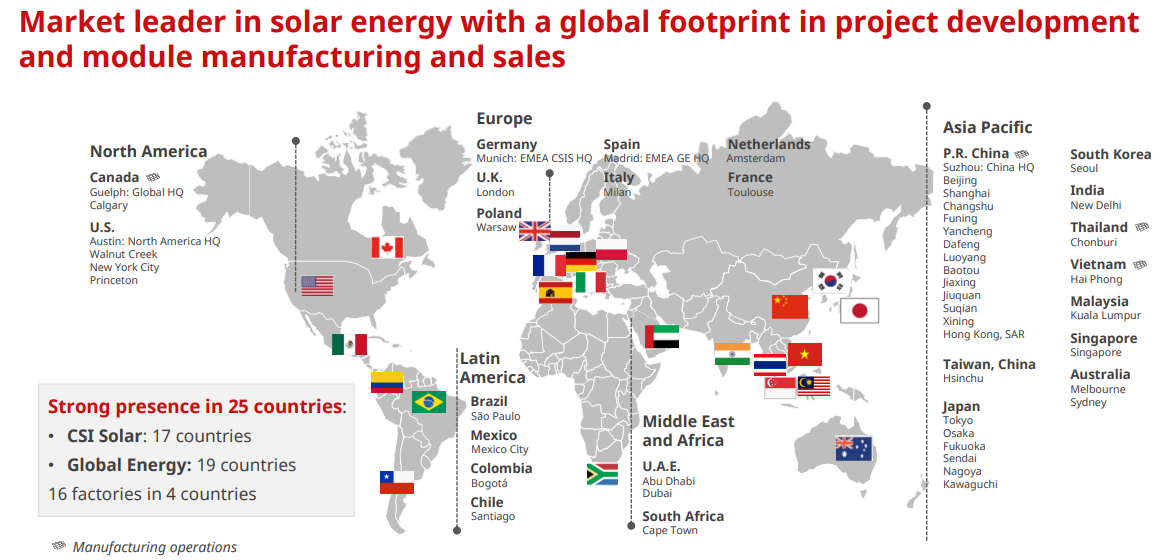
Another solar selection, which may be ready to run higher is Canadian Solar (NASDAQ:CSIQ). The company is based in Canada, with most of its production assets in Asia. It is one of the largest solar panel and supplies manufacturers in the world (10% global share of module market) with nearly $6 billion in sales on a trailing 12-month count. Current assets are about the same as total liabilities, which is a conservative setup financially for a capital-intensive ramping production business. Over the last 24 months, management has invested heavily in new capacity. So, CSIQ is ready and able to increase production quickly if U.S. and European demand takes off. Today’s $39 share quote is not much of a premium to its tangible book value around $27 per share. Canadian Solar is also rapidly developing a battery storage business with sales from this unit growing from almost no revenue in 2020 to a projected 8% of company sales in 2023. Battery storage for daytime solar and wind power generation is in dire need, with industry forecast growth curves well above already stellar solar panel rates.
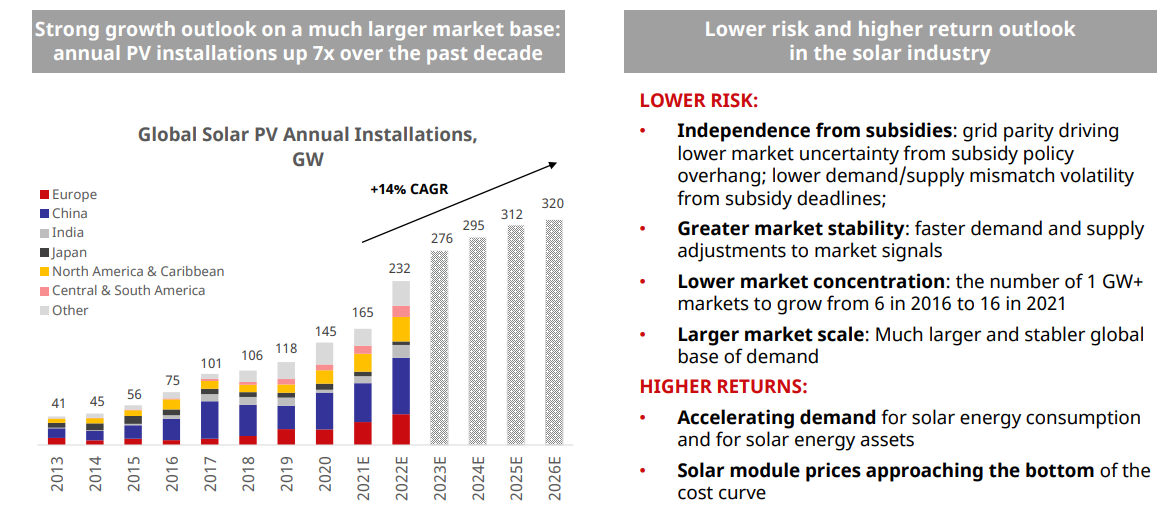
June 2022 Investor Presentation June 2022 Investor Presentation June 2022 Investor Presentation June 2022 Investor Presentation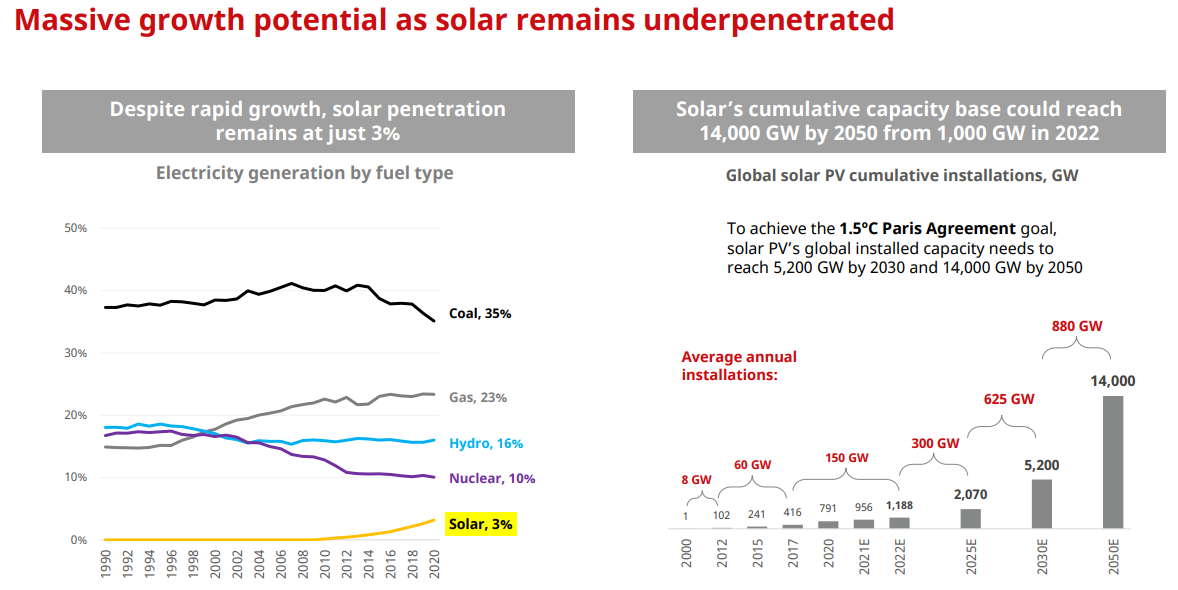
On basic revenue and underlying net asset values, Canadian Solar is trading slightly under 15-year average multiples. If sales and income growth move into overdrive, the stock price will have plenty of fundamental support for a nice move higher.
YCharts, CSIQ Price to Sales and Tangible Book Value, 15 Years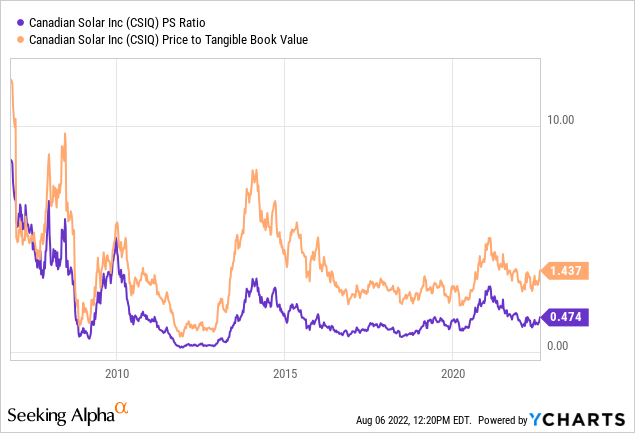
Looking at enterprise values (to level the analysis playing field), Canadian Solar stands out as a solid buy idea, assuming profit margins and sales are set to improve. Versus the largest solar-related companies on the planet, CSIQ is currently trading near the bottom ratio for EV to Revenues. Weaker earnings and final margins since 2018 are the reason.
YCharts, Solar Industry EV to Revenues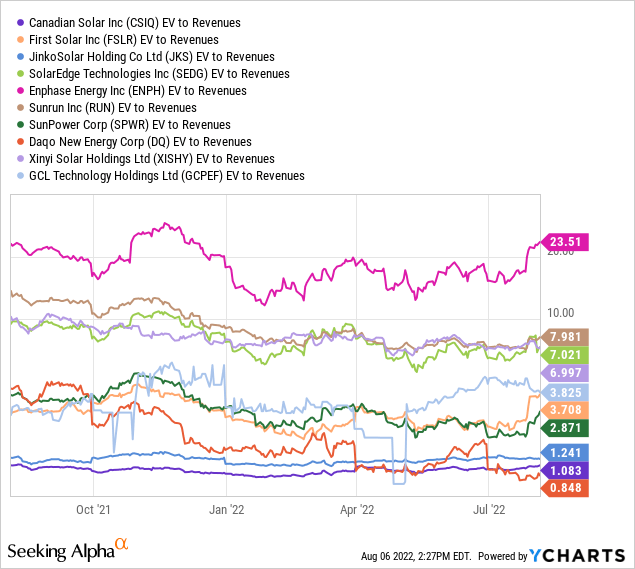
Before extra incentives by governments in Europe and the U.S. are devised for new solar power installations, CSIQ was expected to show a nice rebound in earnings this year, with even stronger results projected for next year. In all likelihood, current 2023-24 financial forecasts for operations will prove on the low side of reality. Rising production volumes and selling prices on heightened demand next year mean Canadian Solar could be just starting a multi-year advance in its stock price. A 10-year average 4% profit margin on $8 billion in sales during 2023 would be the same as $3.70 EPS.
Seeking Alpha, Analyst Estimates, August 5th, 2022 – CSIQ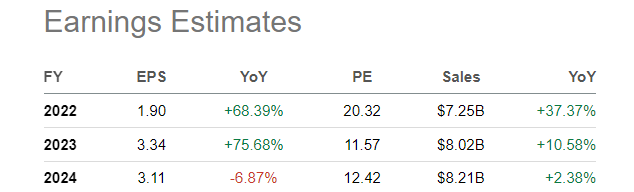
Canadian Solar is more of a blue-chip choice vs. the ReneSola small-cap leverage idea. On longer-term charts, CSIQ has been a regular gainer for investors. The 5-year chart below highlights a steady uptrend, with an outperformance calculation of +39% vs. the S&P 500 for price change.
StockCharts.com, 5 Years, Daily Values – CSIQ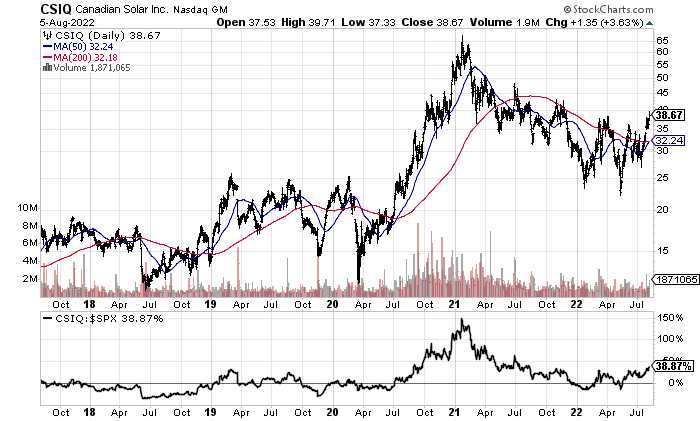
Reviewing the 1-year chart below, On Balance Volume has been in a solid upswing over the whole period. The Negative Volume Index turned positive in May, reversing a clear downtrend. The NVI turnaround was a clue that buying on weakness and less overhead supply was becoming the new normal backdrop. All that was needed for a supply/demand imbalance in share trading was a catalyst. It appears the surprise U.S. climate spending agreement between Democrats in Congress and President Biden could be a huge game changer for Canadian Solar’s fortunes, with nearly 30% of Q1 2022 sales in North America.
StockCharts.com, 1 Year, Daily Values – CSIQ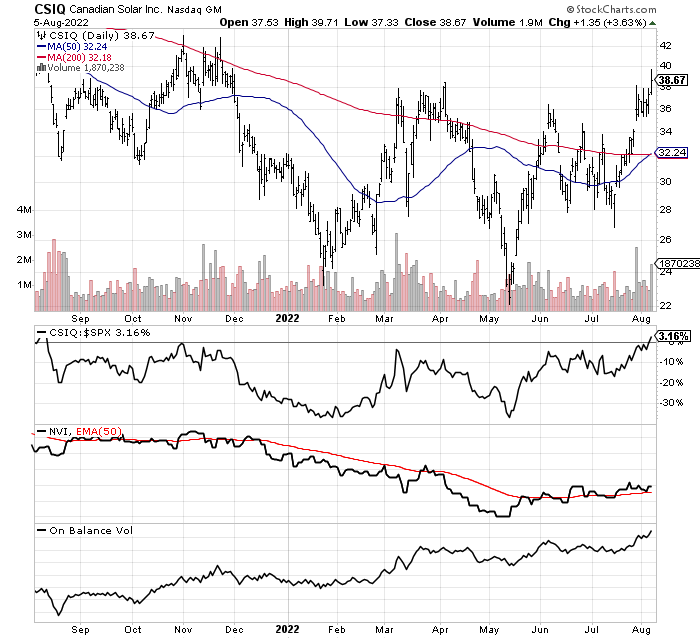
CVD Equipment
I mentioned CVD Equipment several days ago, as a possible high-growth play on EV charging station development across the globe. Total orders for its supplies and equipment are being fueled by a new machine that converts carbon into an important ingredient to help speed charging for electric vehicles. First half bookings at the company are up +73% over last year.
Company Website, August 3rd, 2022
With a liquid $4.20 in tangible book value listed during March, on top of zero debt and $13 million cash, a major turn higher in operating sales and profitability will likely flow directly into an improved stock quote. Price last week was also selling at half its enterprise value to sales ratio of a few years ago, leaving plenty of upside as sales will likely double in 2023 on new orders made in early 2022.
StockCharts.com, 1 Year, Daily Values – CVV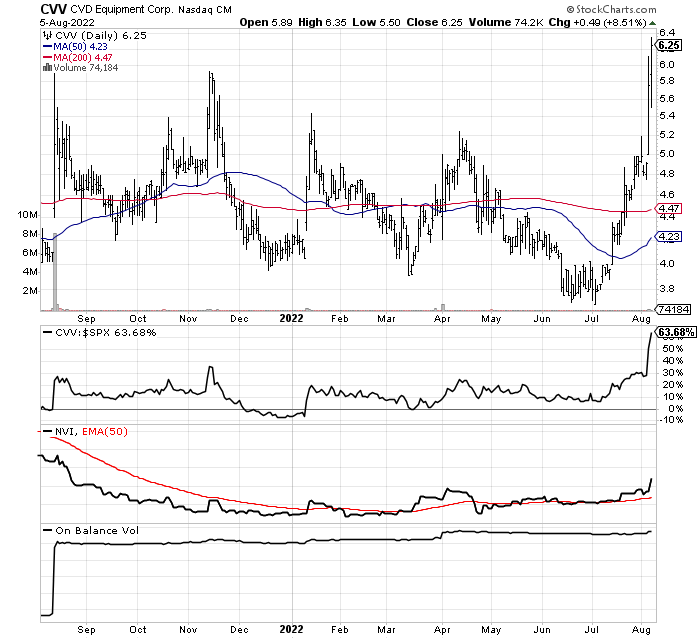
Neurocrine Biosciences
With strong sales of its main product just reported, Neurocrine Biosciences (NBIX) is both a defensive and growth play in the pharmaceutical business. On Friday, Tardive dyskinesia therapy Ingrezza sales amounted to $350M. For 2022, the company raised its sales outlook for the drug into a range of $1.35-$1.40 billion. Representing about 90% of revenue, the bump in sales led directly to volume buying in the stock. With 8 promising drugs under development, and $1.1 billion in cash and current assets vs. $170 million in debt and $582 million in total liabilities, this conservative balance sheet, growth-focused name is worthy of your research time. Below is table of future estimated non-GAAP cash EPS and total sales growth by the end of 2024.
Seeking Alpha, Analyst Estimates, August 5th, 2022 – NBIX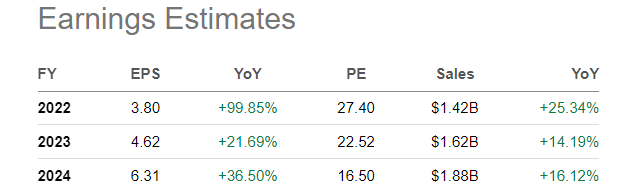
StockCharts.com, 1 Year, Daily Values – NBIX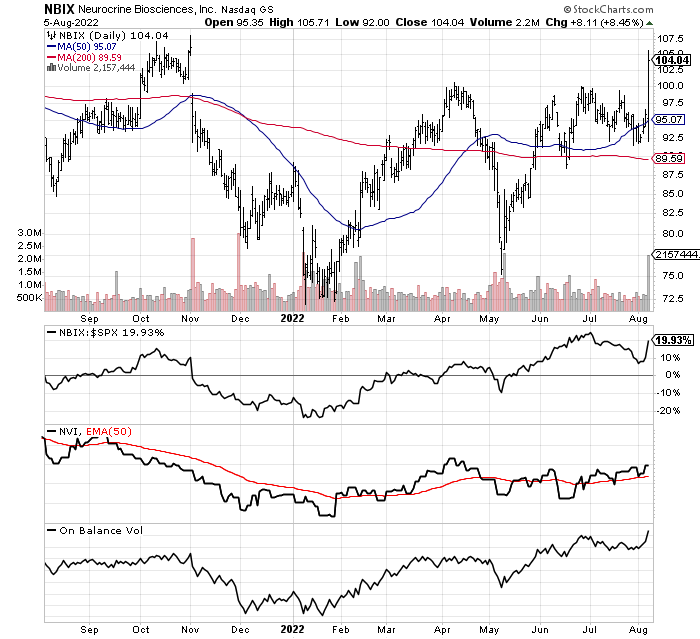
Blucora
The maker of TaxAct accounting and tax software for consumers/businesses, plus wealth management software for brokerages, insurance providers and investment advisors, Blucora (BCOR) has struggled to generate a profit in 2020-21. However, steady gains in revenue, alongside better focus on cost and competitive pressures from companies like H&R Block (HRB) and Intuit (INTU) have Wall Street analysts projecting a rebound for income into 2023. When Blucora generated $2 per share in free cash flow during 2018, the stock traded for $40 a share. Analysts are looking for even higher cash generation numbers in 2023-24, as you can review on the table below. Trusting the positive trading chart, with exaggerated volume buying in the stock since January is important in this investment. BCOR reached a 2-year high on Friday.
Seeking Alpha, Analyst Estimates, August 5th, 2022 – BCOR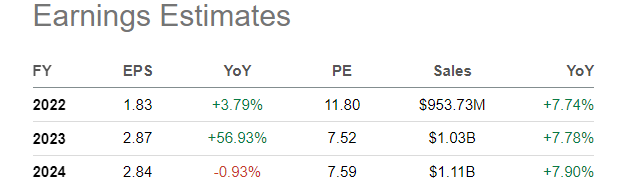
StockCharts.com, 1 Year, Daily Values – BCOR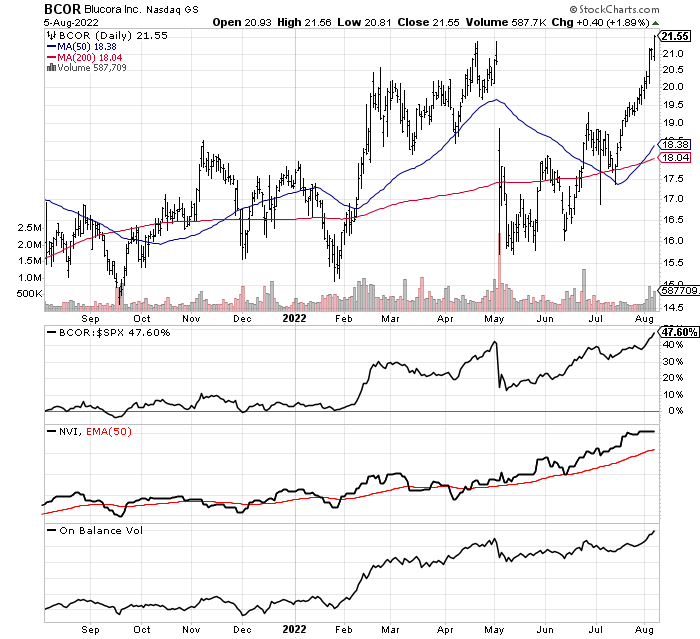
Final Thoughts
The last couple of weeks have opened up a number of intelligent buy ideas using my momentum-based formulas. During bull markets and sharp rebounds on Wall Street, smaller capitalization stocks tend to perform best. The flip side of the coin is a return to bear market selling could keep many of my picks under wraps.
You can find a good explanation of what kind of equity gains are possible using my research in the July 9th Volume Breakout Report here. I use daily computer sorts of thousands of stocks to find picks with high-volume buying inside rising price trends. As many as 15 momentum indicators (part of my proprietary screening formulas) and a review of company financials are other components of Volume Breakout Report selections.
I suggest readers take the time to do further research into any of the VBR choices that appeal to you, a function of your risk appetite or sector exposure needs in portfolio construction. Please understand small-cap picks should be a limited portion of portfolio design. Holding a diversified number of stocks (at least 20-30) is the prudent risk-adjusted way to play them. Volatile price swings are part of the investing process for smaller companies on Wall Street. Consider using preset stop-loss sell orders to reduce downside potential in individual names. Depending on your risk tolerance, 10% to 30% stop levels are recommended.
Thanks for reading. Please consider this article a first step in your due diligence process. Consulting with a registered and experienced investment advisor is recommended before making any trade.
Be the first to comment