

DNY59
Backdrop
The key factors driving the bear market of 2022 have been inflation, the Fed’s reactions to inflation, market beliefs about the near-term trajectory of those reactions and the relationship between yields and stock prices. For a quick look at how yields and stock prices ought to be related, I recommend reading this old article: A Note on Durations & Margins An additional factor, which could actually turn out to be like the submerged part of an iceberg, unseen by most but accounting for the majority of the mass, is QT and its impact on money supply (see:Here’s Looking At You QT).
Figure 1: Yield Curve EOY 2021, 9/1/22 and current
Yield Curves (Bloomberg)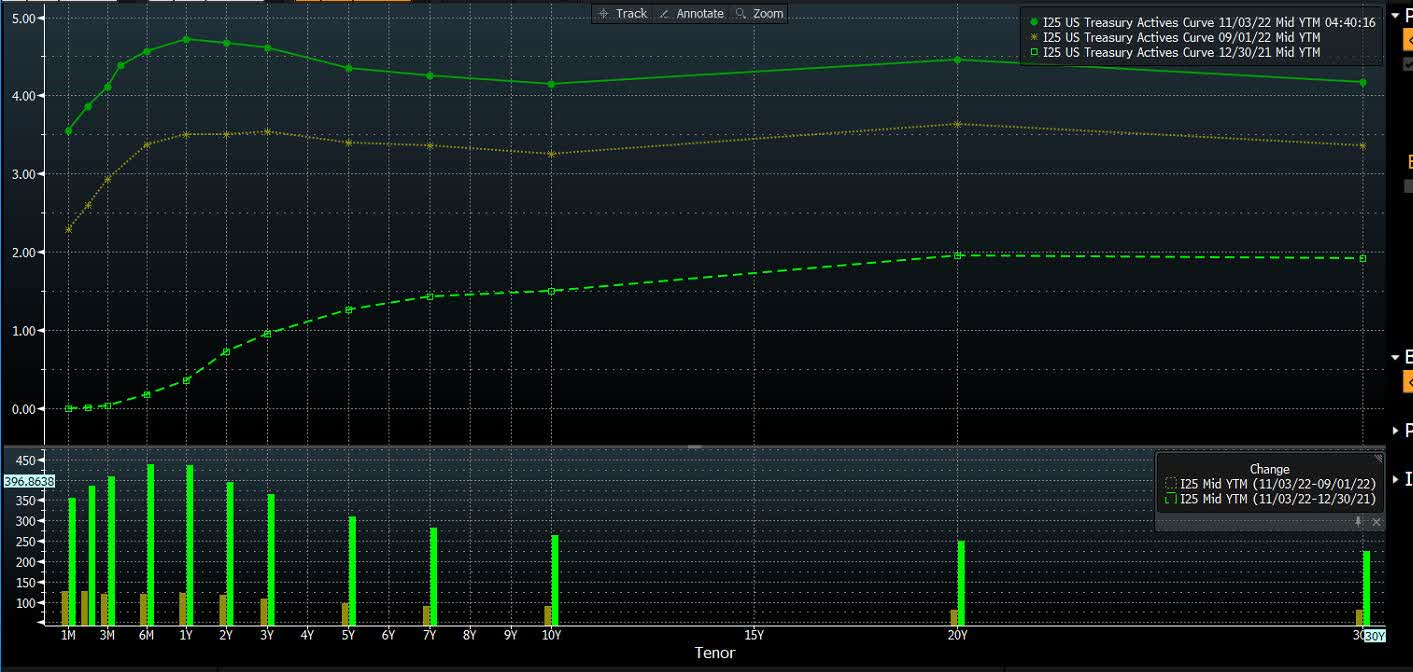
The first figure shows the treasury curve before the bear market began, how it rose through the start of Q4 and where it is today after the most recent Fed meeting. The next figure shows where we are in the QT process:
QT Progression (Federal Reserve)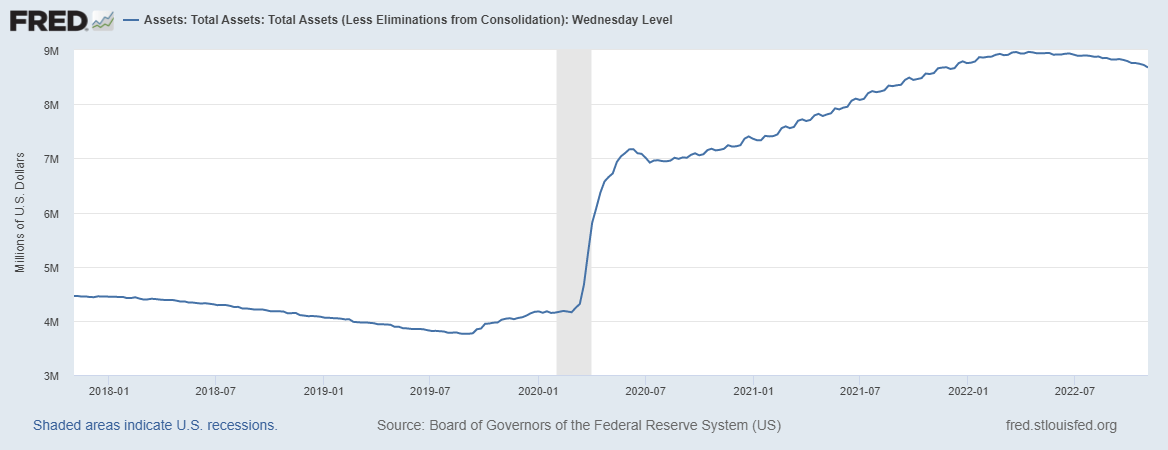
Since Sept 28th, for example, the balance sheet has shrunk from 8.795 trillion to 8.676 trillion, for a 119 billion dollar reduction. This roughly accounts for about a 500 billion dollar contribution to the drop in equity market values (for details on this relationship, see: QT Article).
At this current rate of QT, it would take approximately 17 months to return to mid-2020 levels of money supply, and about 4 years to return to pre-pandemic levels unadjusted for anything else. However, since CPI is about 15% higher than pre-pandemic, and the government is still running about a 1.4 trillion per year deficit, the base level of money supply consistent with “normal” asset prices and real economy inflation may now be closer to 6 trillion than 4, which would take a bit over 3 years from start to finish.
Inflation (Bloomberg)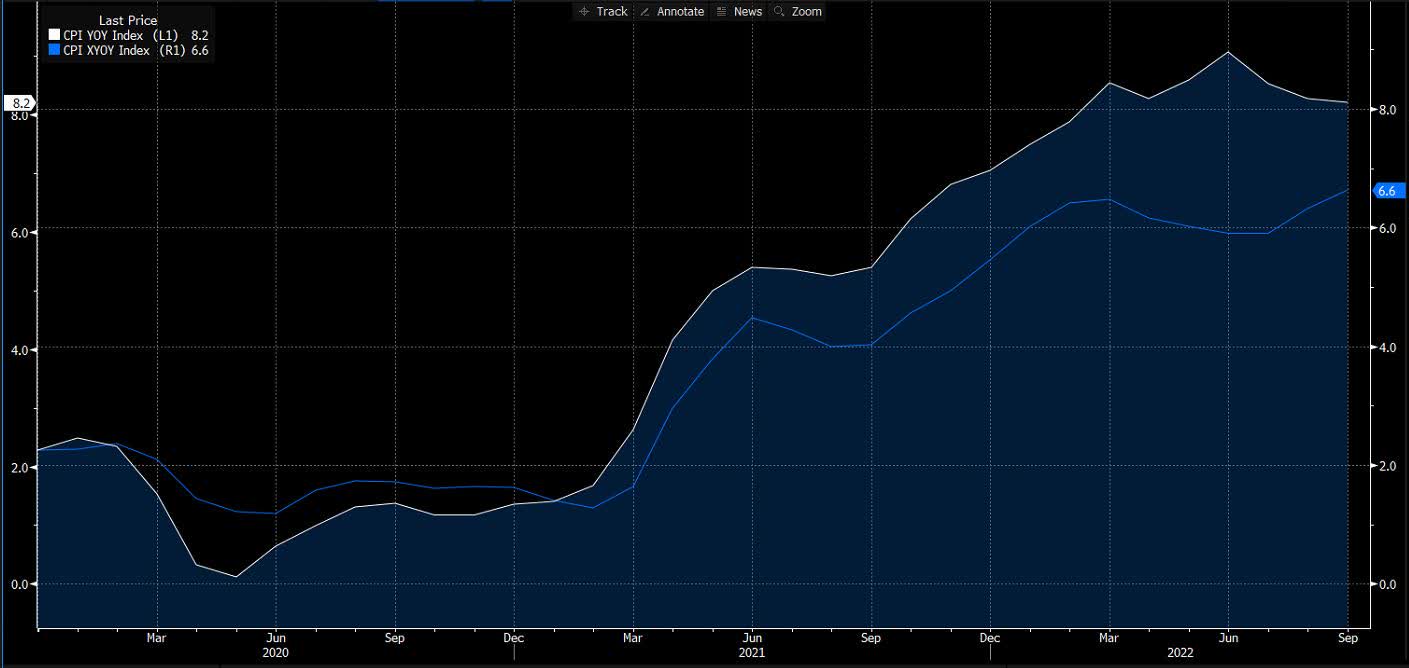
The third graph shows what instigated the change from bunny rabbit Powell to Volker-lite Powell: the initial fire of inflation was lit by supply chain shortages meeting a consumer bolstered by stimulus money who had been deprived of normal spending channels through all of 2020. In early 2021 goods, food and gasoline (all excluded from core inflation, the blue line) spiked. The printed money that had made its way via PPP, checks from the government, tax credits and inability to travel, eat out etc. turned this initial fire into a rather strong blaze by Q3 2021. Further fuel was added by the war in Europe, with a reduction in energy and materials supply due to still increasing sanctions against the aggressor nation. This is partly the cause of the second rise in the core, from the 4% level to the 6% level. Additional causes likely include: household formation, which had been depressed during lockdowns, suddenly picked up, increasing housing and rental demand, while supply was unable to grow to keep up (again, supply chains) combined with extremely low mortgage rates. The lagged way in which lease increases (which occur throughout the year) enter the CPI and the onset of inflation psychology taking hold are other potential causal factors.
Theory Of Inflation
Because inflation is tied to Fed actions and interest rates, and interest rates drive half of equity valuation (with margins and earnings the other half) it is essential to have an accurate theory of inflation in order to position investments appropriately in the current situation. Unfortunately, inflation is an extremely complex phenomenon that is not particularly well understood even by many mainstream economists. The fact that the media labels economists by their political persuasion is an enormous tell. When we compare the ideas of various physicists regarding the utility of string theory, is it a matter of politics, or ability to describe reality that matters? Similarly, when we compared models of how fast Covid might spread and how many deaths in the US might result, were the politics of the various epidemiologists ever an issue?
The politicization of a topic within a discipline in a pretty good sign to me that when I make decisions that matter to me where that topic is an important driver, I should probably ignore practitioners of that discipline almost entirely, and rely on people with a strong data, statistics and science background who have spent time reading the economics literature and performed independent analysis of that data outside the politicized bounds of economics and its still primitive models (which mostly do not account for human psychology in any direct manner at all – behavioral economics has not yet met macroeconomics).
My conversations with such people, reading the detailed writings of Larry Summers, and my own independent research and “common sense intuition” have led me to the following hypotheses about inflation that inform my investment positioning.
(1)Milton Friedman was generally right about the monetary roots of inflation (inflation is always and everywhere a monetary phenomenon), but he did not have the pandemic data set. Monetary policy always supplies the fuel but how hot the fire burns can also be impacted by supply-side factors as well as how exactly the printed money circulates.
(2)Earlier iterations of QE did not impact the real economy (CPI stayed low) but did impact asset valuations (Shiller PE entered a new regime) because the printed money mostly stayed within the financial system.
(3)The response to the pandemic combined monetary and fiscal policy. The money printed by the first was sent to the public via the second.
(4)The particular forms of fiscal policy are also important as to how much inflation we got and will continue to get, and for how long. Money sent to businesses can, via the investment channel, actually reduce inflation by increasing supply – especially money sent to goods producing businesses. Money sent to higher income consumers will tend to cause less inflation because more of it gets saved, unless inflation lasts a long time. Then even higher income consumers must reduce their rate of savings just to keep up their lifestyle and that money sitting in banks or brokerage accounts begins to circulate. Money sent to the bottom 60% of the income distribution will almost immediately get spent.
(5)Printed money, once spent, doesn’t disappear from the system. It merely moves between different people’s accounts. There are only two ways for the amount of printed money to re-normalize: (the good way) the Fed sells or rolls off bonds it bought, and cancels the money it receives from the monetary system & (the bad way) all prices in the economy adjust upward to re-normalize nominal GDP to money.
These are all qualitative observations. A couple of quantitative hypotheses on inflation are:
(6)If the Fed did not reduce the money supply via QT at all, we would require between a 50% and 75% cumulative increase in the inflation level for re-normalization to occur over approximately 5-7 years of inflation running over 8%. The probability of runaway inflation would be significant in this scenario but the Federal debt to GDP ratio would improve dramatically.
(7)With the current rate of QT, it will take approximately 2-4 years for core inflation to fall below 3% in the absence of a severe recession which includes at least a 2% increase in the unemployment rate. Steeper rates of QT (e.g., 1.5-2 trillion per year, involving sales of both MBS and Treasuries) would be more consistent with this occurring in shorter periods, with a soft landing for the real economy but a much harder landing for financial assets.
Investment Implications
Strategic
S&P500 & Nasdaq (Bloomberg)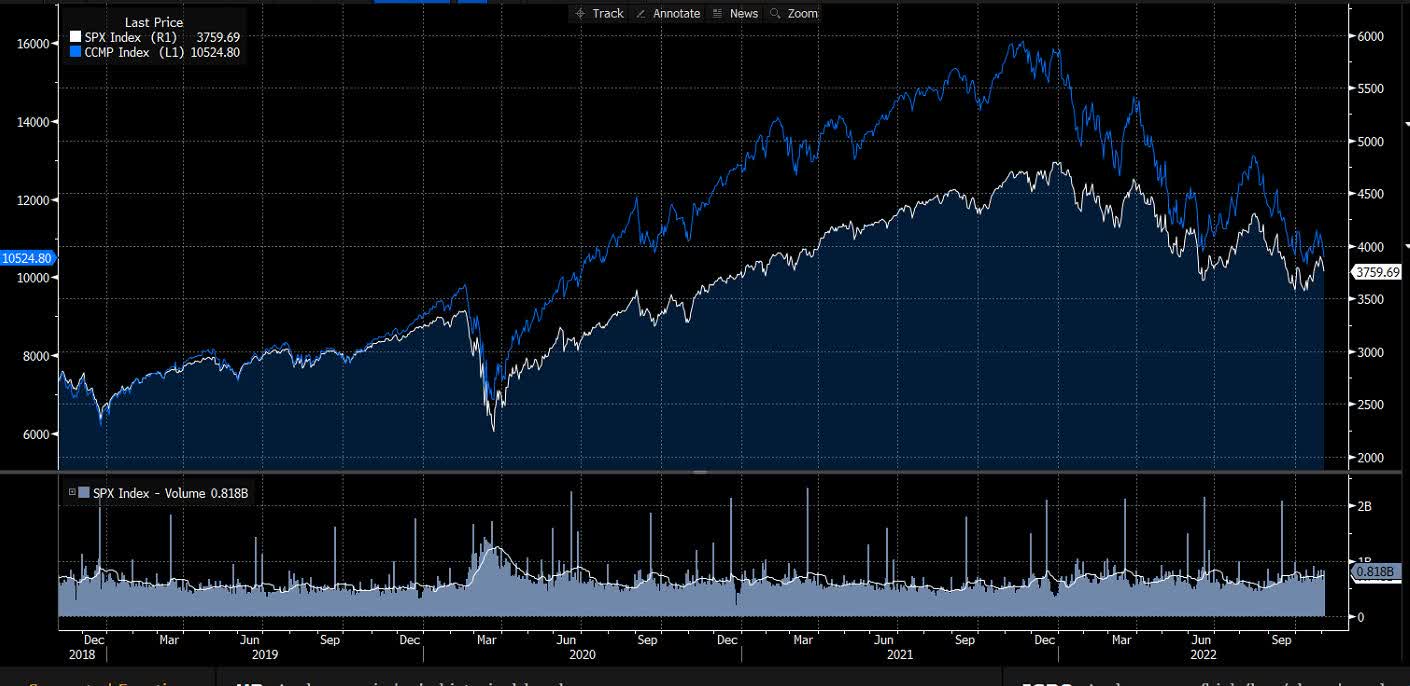
Stocks have corrected to about 10% above pre-pandemic levels (11% for SPX, 7% for the Nasdaq), which were not particularly cheap. However, pre-pandemic, before we realized the pandemic would reach us, they were also not priced for a recession.
Market Cap/GDP (Gurufocus)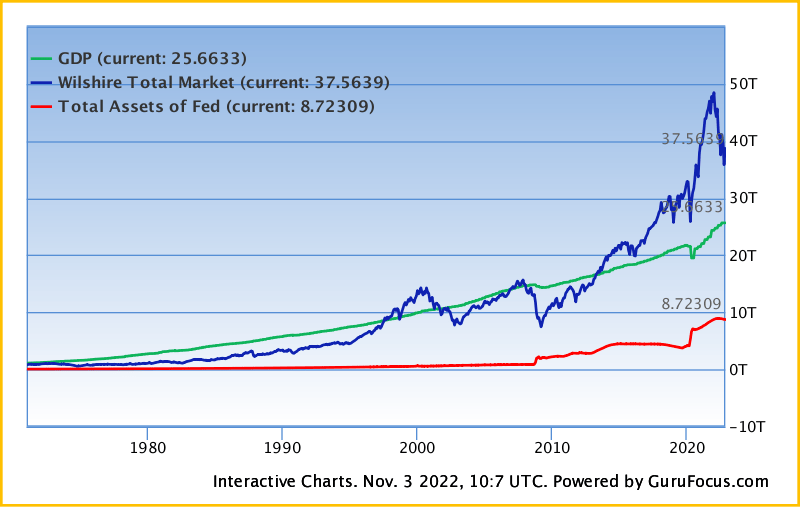
If we look at the Buffett ratio (which has been below one at the bottoms of prior bubbles) we are still about 48% above “fair” value. I would note that the Buffett ratio can correct through two mechanisms, a reduction in the numerator (stocks dropping) and an increase in nominal GDP (which includes inflation). At the current rate of inflation with 2% real growth, for example, re-normalization could occur in 3-3.5 years without any drop in stocks.
Shiller PE Ratio (Guru Focus)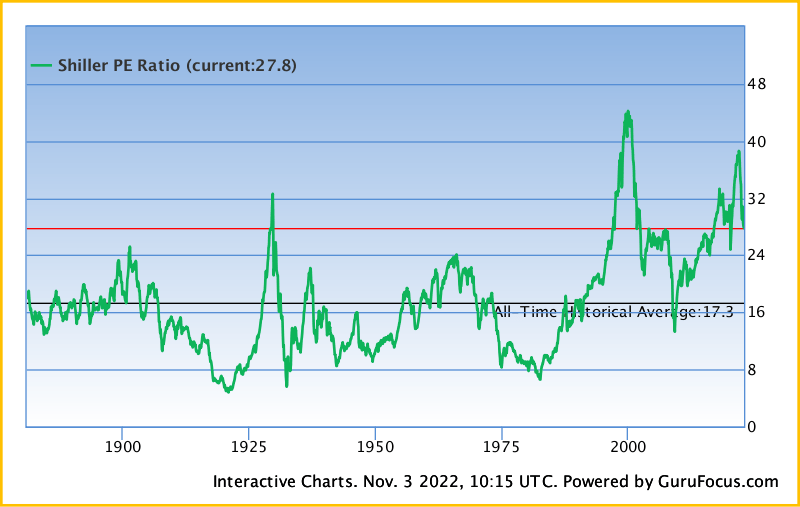
If we look at Shiller PE, we have now returned to just 7% above the recent (20-year average) which includes two bubbles (the great bubble of 2000 and the pandemic QE bubble) but are 60% over the average of the entire series (going back to the late 1800s).
You can use either of these ratios with the assumption that over 10 years they will return to “normal” to produce estimates for how stocks in aggregate will do from current levels. If your definition of normal is “average level of the last 20 years” then you get 5% per year for stocks with the Shiller PE. On the other hand, if your definition of normal is the long-term average for the Shiller PE, you’re looking at 1.5% per year. Finally, if you think at some point we may actually go below average (like we did in 2009 and every other bear market bottom except the 2000 bear) then you’re looking at negative returns over 10 years. Likewise, using the Buffett ratio, if you use a 20-year look back, you can expect 2.5% from stocks over the next 10 years. However, this forecast turns negative if you use a 40-year look back. The difference between the two is all about margins – corporate margins have been at a historical high for about a decade – so by using the Shiller, we are assuming they stay high, and corporations continue to keep the higher share of revenue that they have over the recent decade rather than mean-reverting to historically normal margins. Given the labor market dynamics we currently have, and the strength of the populist wings of both major parties, I would lean towards betting on mean-reversion right now.
Tactical
My sense is that the 5th inning of this bear market just began with the conclusion of yesterday’s Fed meeting. In shifting from strategic outlook to tactics, it is important to begin to account for market psychology. The spike in stocks when the statement was released and until Powell made clear what it really meant was evidence that bubble psychology has not yet fully dissipated. My definition of when the 5th inning begins is when the reality of a real earnings recession followed by a real economy recession, with margin contraction and potential financial contagion (bankruptcies and volatility exposing hidden leverage within the financial system) begin to gain an upper hand over declining levels of woolly thinking backed by frothy emotions.
At this stage, I believe it is appropriate to shift focus from analyzing the psychology of markets and fundamentals in equal measure to weighting fundamentals more heavily (because the emotional component is slowly being suffocated to death). Key events to look out for over the next two quarters will be significant changes in inflation measures, rises in unemployment or drops in the JOLTs numbers (which indicate fewer openings and lessening wage pressure). We also need to be on the look-out for the wage-rent spiral taking hold – currently leading rental renewals have slowed from double-digit increases to the low single digit range. However, people whose leases were signed a year ago are still seeing those 12% spikes in rent when they renew. With a tight job market, it is very plausible that those renters will be asking for raises to keep up with those leases, and moving to other jobs if they are not granted. This is why quits, unemployment filings and JOLTs are all important.
Potential scenarios include inflation coming down over 2-3 years (especially if the war in Europe is resolved by next summer) but with a near-term spike in oil prices (SPR withdrawals slowing and Russian oil price cap dynamics which are set to impact by December) vs the war continuing longer and inflation becoming imbedded if some event causes the Fed to back off from QE. While the regulated financial system and the US consumer are both in much better shape than in 2008-9 from a balance sheet point of view, the unregulated shadow system grew a lot in new ways (crypto, NFT, lots of fintechs, CLOs which bundled loads of speculative) with potential hidden leverage in many pockets. If any of these sectors was able to link up with the regulated parts of the system, the Fed may be forced to act if failures cascade into the regulated parts of the system. Hopefully, though, they have learned that blanket QE is not the best way to deal with such threats and will use more targeted facilities to deal with contagion risk specific to the particular firms impacted (more TARP, less QE).
My specific recommendations at this stage:
(1)Continue to Overweight 2-4 year TIPS
(2)Continue to Build exposure to energy and materials during significant market drops for additional inflation protection. Those appear to be the only sectors where the income benefit of inflation outweighs the discounting effect from higher rates enough that they still do well over 3-10 year periods of high inflation. This includes refiners. China re-opening would strengthen this dynamic.
(3)Overweight near-cash, in the form of rolling 1-3 month bills.
I expect all of these to outperform stocks in general over this cycle.
(4)This is the time to build a list and check it twice. Think about hydrogen & nuclear for the de-carbonization secular trend. Consider agriculture, water, healthcare – all the boring sectors investors who like shiny things have ignored for a long time. Many of these have already fallen to fair value and some trade below it. When cash is tight, all those essential things will still be essential while many digital “essentials” will become recognized for the discretionary spending that they were (except for during the pandemic lockdowns when they truly were essential).
(5)Remember that dollar cost averaging (DCA) is always better than trying to call bottoms, whether you buy individual stocks, sector ETFs or mass market index ETFs. No one really knows whether “normal” will be 20-year historical averages or 40, and how much we will shoot below any given average as manic froth psychology can rapidly shift to depressive psychology.
(6)For those shorting, SQQQ remains the simplest vehicle for most but should be used tactically. The same comment about DCA applies.
SQQQ this year (Bloomberg)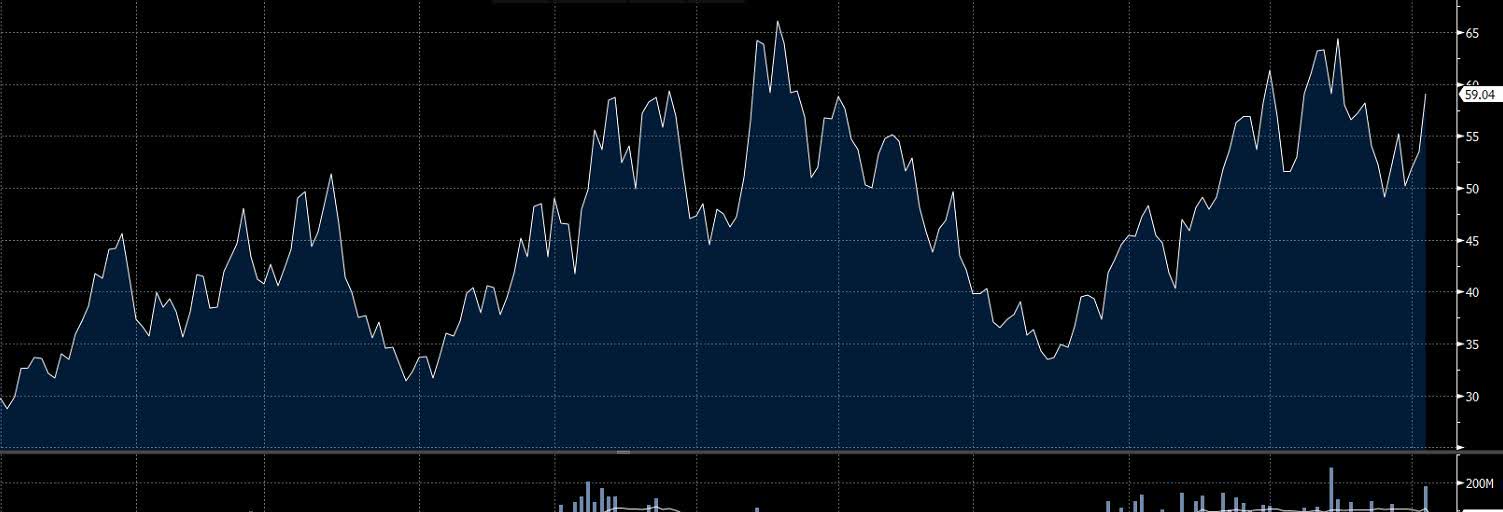
For example, selling calls (which day traders seem to love the weekly version of looking at the volume) is a good way to get out. The best day to sell covered call is after a really bad money, though you might not get hit. The fifth inning is when shorting goes from being a no-brainer to a dessert. Don’t get too greedy with dessert.
Be the first to comment