

Mongkol Onnuan
The S&P 500 EPS revisions look grim. Here’s the data:
- The forward 4-quarter estimate (FFQE) fell to $226.72 from last week’s $229.54 for a sequential decline of -1.23% only slightly better than last week’s sequential decline of -1.32%.
- The PE ratio this week ended at 16.6x versus last week’s 17x print.
- The S&P 500 earnings yield ended the week at 6.01% vs last week’s 5.88%.
- The Q3 ’22 bottom-up EPS estimate finally made it above $55 per share, ending the week at $55.97.
Here’s the “rate-of-change” data for the forward EPS curve:
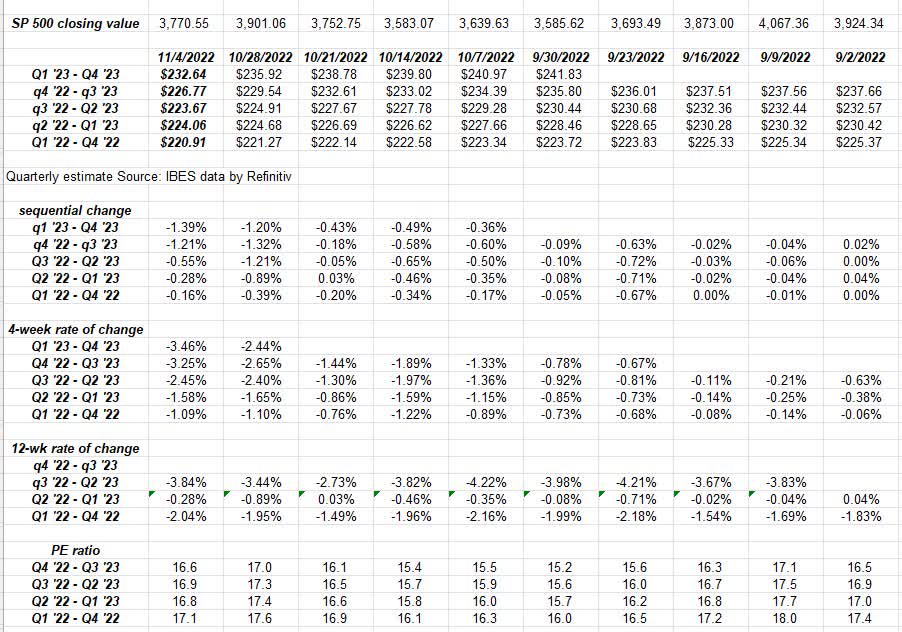
The sequential negative revisions eased up a little while the 4-week negative rate of change accelerated as it moves lower.
Looking at expected sector growth rates for 2022 and 2023:
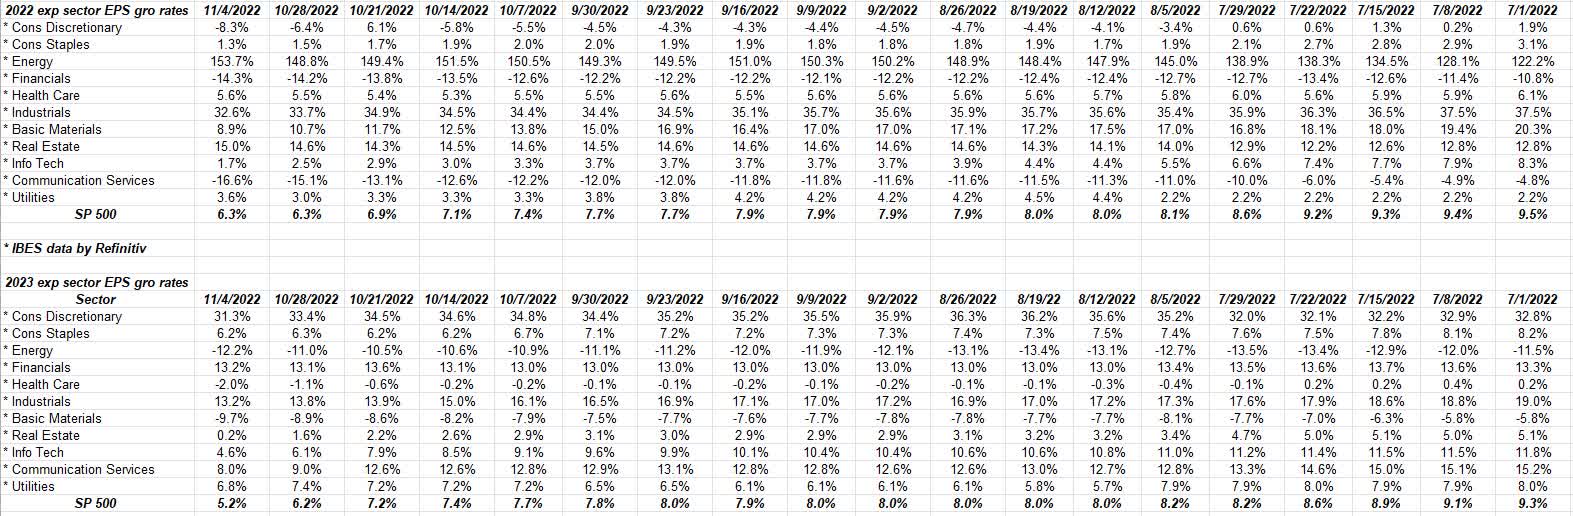
2023’s expected S&P 500 growth rate of 5.2% was 9.3% on July 1 so 2023’s expected EPS has already been cut almost in half.
2022’s expected S&P 500 EPS growth rate was 9.5% and is now 6.3% thus 2022’s full-year EPS growth rate has been reduced by 1/3rd.
You can see the pressure is really on 2023 EPS.
Summary/conclusion: There is always a difference between the stock price action and the data. The real weakness has been in the mega-cap names, particularly and surprisingly Apple (AAPL) since Q3 ’22 earnings (or Apple’s fiscal Q4).
Let’s ask a hypothetical question: If you had no other research to look at every week, and just looked at S&P 500 earnings estimates, would it make sense for the S&P 500 to be down -19.85% as of Thursday night’s close on just this trend in S&P 500 earnings since the summer?
You’d likely say “probably not” and in fact you’d be right, since most of the S&P 500 action has been “PE compression” this year thanks to Treasury yields.
Ed Yardeni came about 6 weeks ago and said he thought that S&P 500 EPS for full-year 2022 would be around $215 per share. As of tonight, the Refinitiv estimate is $220.91, which is down from $223.72 on 9/30/22 and $228.86 on July 1 ’22.
The PE though – at least for the forward estimate – bottomed in mid-October ’22 near 15.4x and is up to 16.6x as of tonight, 11/4/22.
It’s navel-gazing for sure, but we are actually starting to see a little PE expansion in the S&P 500 again.
And it could be nothing too.
Take all this with a grain of salt. Past performance is no guarantee of future results and none of this content might be updated. The trend in 2023’s S&P 500 EPS is negative meaning expected 2023 EPS growth has fallen from 8% 10 weeks ago to 5% today. Not 2008-like drops, but still worth noting. When S&P 500 earnings revisions and trends are like this, the market trades like it has a piano on its back.
October CPI inflation data gets released this Thursday, November 10th. It’s still all that matters. If the 10-year Treasury yield trades above the 10/21/22 high of 4.33%, then there is probably more downside ahead for the S&P 500.
Thanks for reading.
Editor’s Note: The summary bullets for this article were chosen by Seeking Alpha editors.
Be the first to comment