

jimfeng
By Robert Hughes
Refinitiv Datastream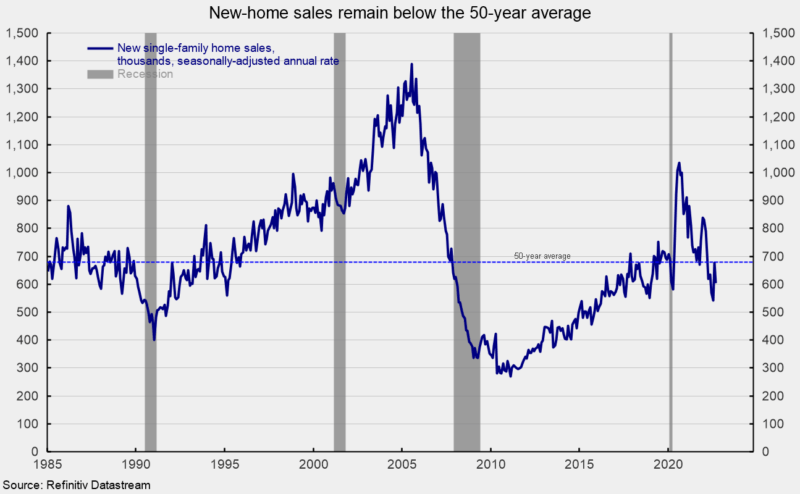
Sales of new single-family homes fell back in September, decreasing 10.9 percent to 603,000 at a seasonally-adjusted annual rate from a 677,000 pace in August. The September drop was the seventh decrease in the last nine months, leaving sales down 28.1 percent from the December 2021 level and 41.8 percent from the August 2020 post-recession peak. September sales are below the 50-year average selling rate (see the first chart).
In September, sales of new single-family homes were down in two of the four regions. Sales in the Northeast, the smallest region by volume, rose 56.0 percent, and sales in the Midwest rose 4.3 percent for the month. However, sales in the South, the largest by volume, fell 20.2 percent while sales in the West creased 0.7 percent. Over the last 12 months, sales were down in two of the four regions, led by a 30.4 percent fall in the West and a 19.3 percent decline in the South. Gains from a year ago were seen in the Northeast (25.8 percent) and in the Midwest (10.6 percent).
Refinitiv Datastream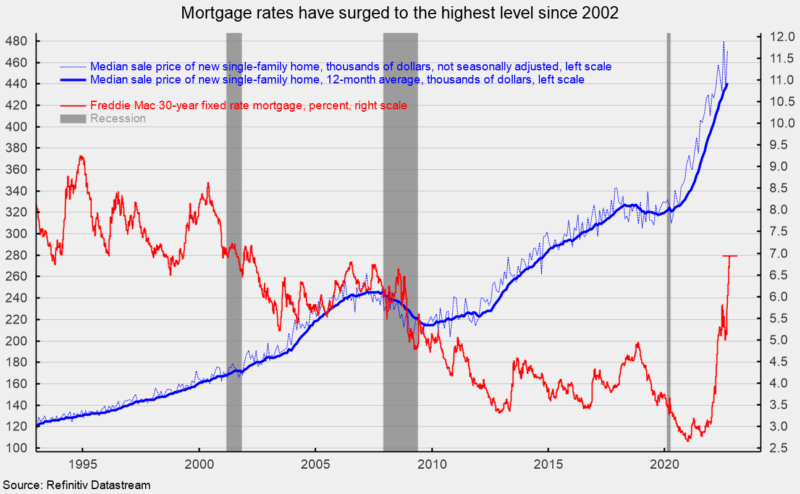
The median sales price of a new single-family home was $470,600 (see the second chart), up from $435,800 in August (not seasonally adjusted), putting the 12-month average price at a record high $441,000 (see the second chart). Meanwhile, 30-year fixed-rate mortgages were 6.94 percent in late October (and 6.29 percent in late September), up sharply from a low of 2.65 percent in January 2021. The combination of high prices and rising mortgage rates reduces affordability and squeezes buyers out of the market.
Refinitiv Datastream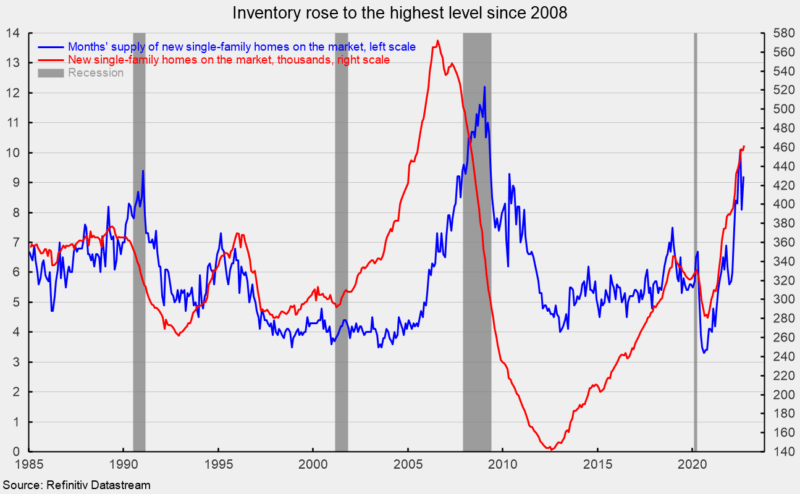
The total inventory of new single-family homes for sale rose 1.1 percent to 462,000 in September, the highest since March 2008. That puts the months’ supply (inventory times 12 divided by the annual selling rate) at 9.2, up 13.6 percent from August, and 50.8 percent above the year-ago level. Inventory and the months’ supply remain very high by historical comparison (see the third chart). The high level of prices, elevated inventory, and surge in mortgage rates should continue to weigh on housing activity in the coming months and quarters. However, the median time on the market for a new home remained very low in September, coming in at 1.5 months versus 1.8 in August.
Meanwhile, the National Association of Home Builders’ Housing Market Index, a measure of homebuilder sentiment, fell again in October, coming in at 38 versus 46 in September. That is the tenth consecutive drop and the third consecutive month below the neutral 50 threshold. The index is down sharply from recent highs of 84 in December 2021 and 90 in November 2020. All three components of the Housing Market Index fell again in October. The expected single-family sales index dropped to 35 from 46 in the prior month, the current single-family sales index was down to 45 from 54 in September, and the traffic of prospective buyers index sank again, hitting 25 from 31 in the prior month. All three components of the Housing Market Index fell again in September. The expected single-family sales index dropped to 46 from 47 in the prior month, the current single-family sales index was down to 54 from 57 in September, and the traffic of prospective buyers index sank again, hitting 31 from 32 in the prior month.
Editor’s Note: The summary bullets for this article were chosen by Seeking Alpha editors.
Be the first to comment