

wildpixel
A holiday lift for stocks on light volume drew the S&P 500 (SP500) closer to its long-term moving average. Energy, basic materials, and technology names led the sector charge, but retailers were the true standouts. Investors are hoping that today’s release of the Fed’s minutes from its last meeting on November 1-2 will reveal a softer tone from officials in their battle with inflation. In recent days, some officials have finally started to acknowledge that the short-term rate increases to date work with a lag and that the committee does not want to overtighten to the extent that a recession results. This is breathing life into the soft landing scenario again, which is still my base case.
Finviz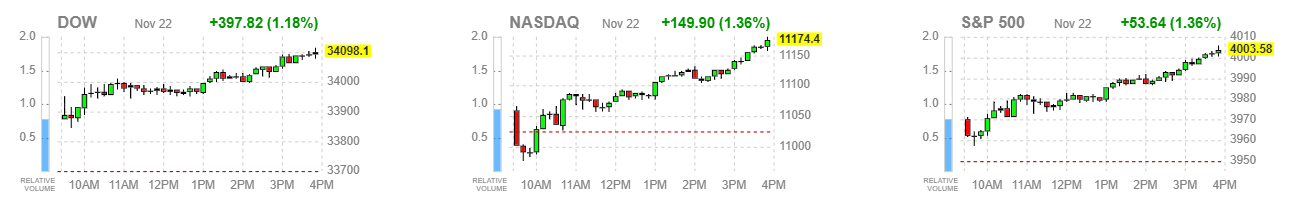
Last week, I asserted that Target’s (TGT) earnings shortfall was more a function of poor management than weakening consumer spending trends. This week’s earnings reports are proving that to be true, as several retailers and apparel manufacturers reported stellar results yesterday, from Urban Outfitters (URBN) to Burlington Stores (BURL) to Abercrombie & Fitch (ANF). Best Buy (BBY) and DICK’s Sporting Goods (DKS) also rose double-digits on strong reports. Consumers may be cost-conscious for obvious reasons, but that does not mean they are unwilling or unable to spend, as seen in this latest batch of results. This is because excess savings, wage increases, and near-full employment are offsetting an inflation rate that most realize has peaked.
Seeking Alpha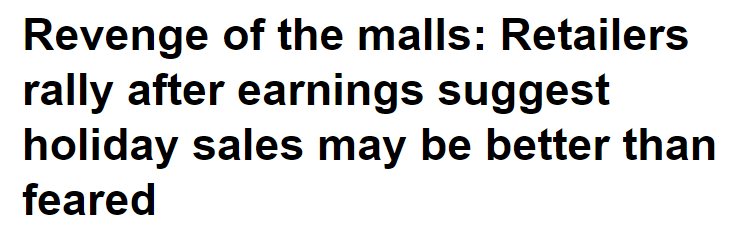
I do not expect the Fed’s meeting minutes from three weeks ago to inspire any confidence, because the meeting occurred prior to the better-than-expected CPI and PPI reports we received for October. Fed officials were still focused on tempering any enthusiasm for risk assets with extremely hawkish rhetoric. While this is yesterday’s news, the minutes may reverse some of yesterday’s gains. The Fed is likely to continue talking tough until we arrive at the December meeting, which is when I expect a definitive shift in tone.
While I am still hopeful for a year-end rally, based on post-midterm historical performance, I do see one technical factor that gives me pause. I hate to pause, but this is a concern I have to share. The CBOE Volatility Index is a measurement of the stock market’s expectation of volatility based on S&P 500 index options. Higher levels of expected volatility coincide with higher levels of fear, which also coincide with lower levels for the index. Lower levels of volatility imply complacency or less concern, which also coincide with higher index levels. This year, the S&P 500 index has consistently bottomed when the Volatility Index approaches 35, and it has consistently peaked when it falls below 20. While not there yet, the index has fallen to 21, which suggests limited upside. Still, a powerful rally over the coming weeks could push the VIX down to the upper teens, which is where it started at the beginning of the year.
StockCharts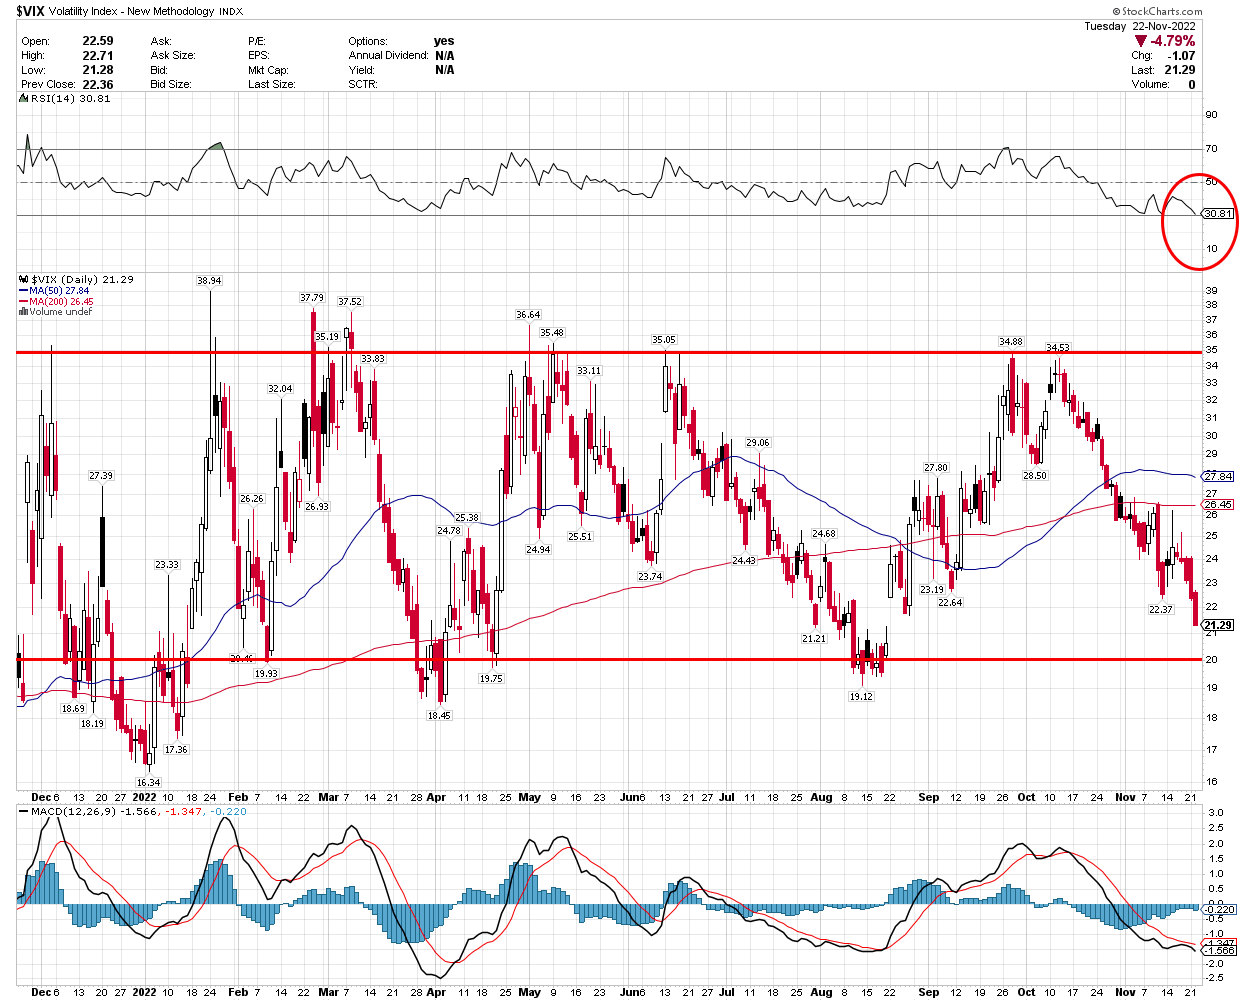
Additionally, the relative strength index (RSI) at the top of the chart is approaching 30. This measurement oscillates between 70 (overbought) and 30 (oversold), and it is also approaching a level where it has bottomed this year. Using 2022 as a guide, we are approaching levels where a meaningful pullback in the index is becoming more likely. My hope is that it is lower at the beginning of next year from much higher levels.
Happy Thanksgiving, I’ll be back with commentary on Friday.
Lots of services offer investment ideas, but few offer a comprehensive top-down investment strategy that helps you tactically shift your asset allocation between offense and defense. That is how The Portfolio Architect compliments other services that focus on the bottom-ups security analysis of REITs, CEFs, ETFs, dividend-paying stocks and other securities.
Be the first to comment