

sankai
All Eyes Are on Semiconductors
Semiconductors is one of the industries that attract the most attention from investors and decision-makers alike.
On one hand, chips have become an essential part of every innovative product that comes to the market, ranging from a mobile phone to an electric car. Shortage of chips immediately translates into severe delays along the supply-chain, hurting manufacturing, production and delivery times of a long list of products.
Bloomberg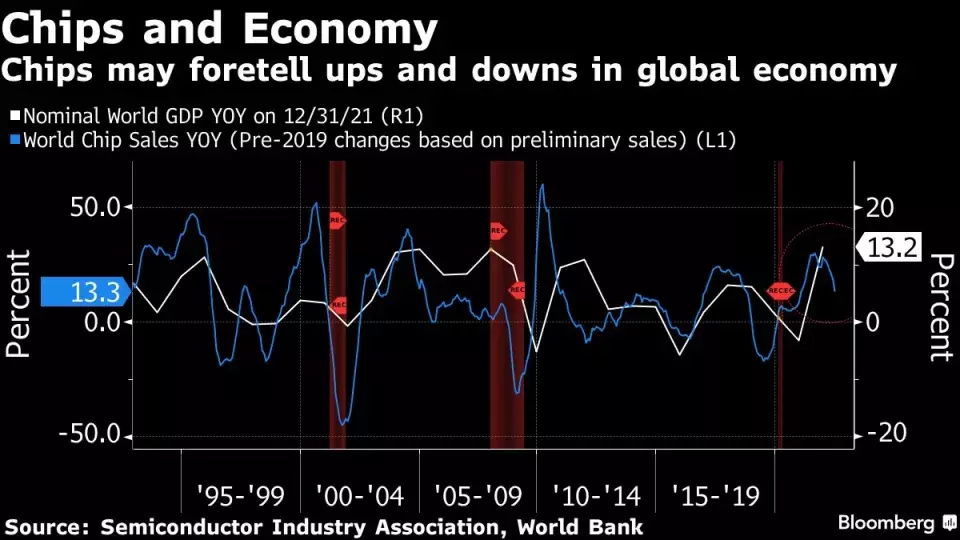
On the other hand, if knowledge is power – innovation and cutting-edge technology are superpowers that everybody wishes to keep close to himself. In a world that is dominated by two major, very different, empires – the US and China – it’s no wonder that each of these nations is trying to be ahead of the game, taking the lead, and preventing the other party from making (too much) progress.
Bloomberg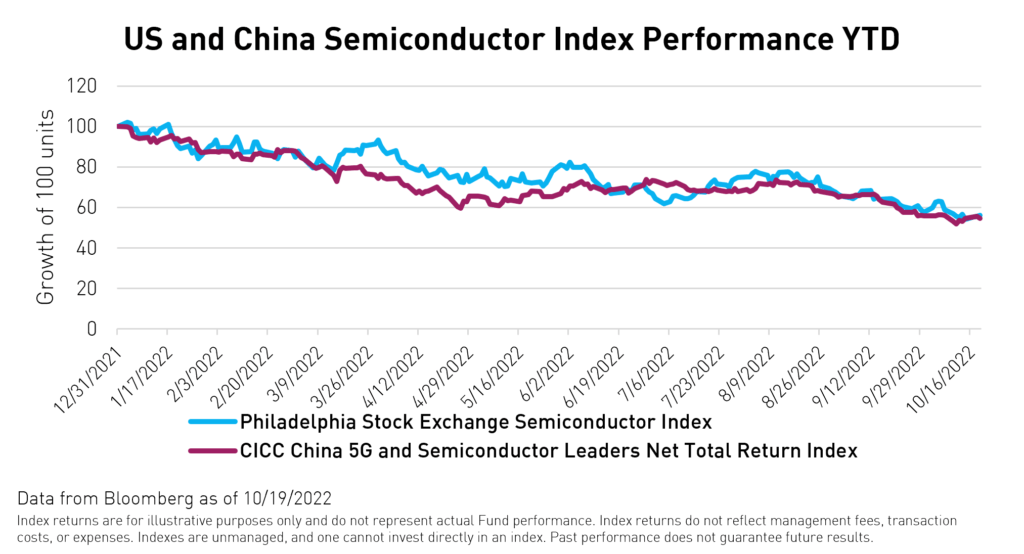
As such, it’s no wonder that semiconductors have become one of the most closely-watched and closely-supervised/regulated industries, functioning as a barometer for both the economic as well as the political playing fields.
Bloomberg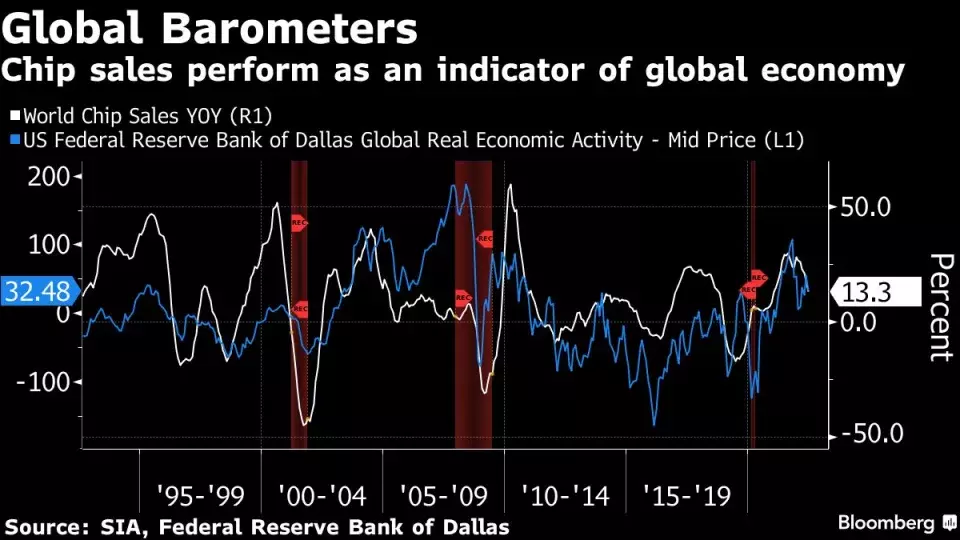
In order to get an idea how important this industry is, here’s what Citadel’s Ken Griffin said last week:
Let’s be very clear. If we lose access to Taiwanese semiconductors, the hit to US GDP is probably on an order of magnitude of 5% to 10%. It’s an immediate Great Depression.
That’s impressive and scary at the same time.
Putting the Chips on Chips
A lot of money is being invested in growing chip-making capacities and the US is doing some great efforts (over the past year) to bring back/build at home as much production capabilities as possible.
Similarly, a lot of money is moving into relevant securities, and more and more semiconductor ETFs are joining the chip-frenzy.
There are currently 9 semiconductor ETFs (with AuM of at least $50M). Here they are from the largest to the smallest:
- VanEck Semiconductor ETF (NASDAQ:SMH)
- iShares Semiconductor ETF (SOXX)
- Direxion Daily Semiconductor Bull 3X ETF (SOXL) >>> We’re short SOXL as part of our Funds Macro Portfolio (“FMP”)’s hedging strategy.
- SPDR S&P Semiconductor ETF (XSD)
- Direxion Daily Semiconductor Bear 3X ETF (SOXS)
- Invesco Dynamic Semiconductors ETF (PSI)
- ProShares Ultra Semiconductors (USD)
- First Trust Nasdaq Semiconductor ETF (FTXL)
- Invesco PHLX Semiconductor ETF (NASDAQ:SOXQ)
In-spite of the very rough patch these ETFs are going through over the past year, they still manage over $20B in AuM, out of which nearly 90% (~$18B) is concentrated in the top-3 ETFs.
Y-Charts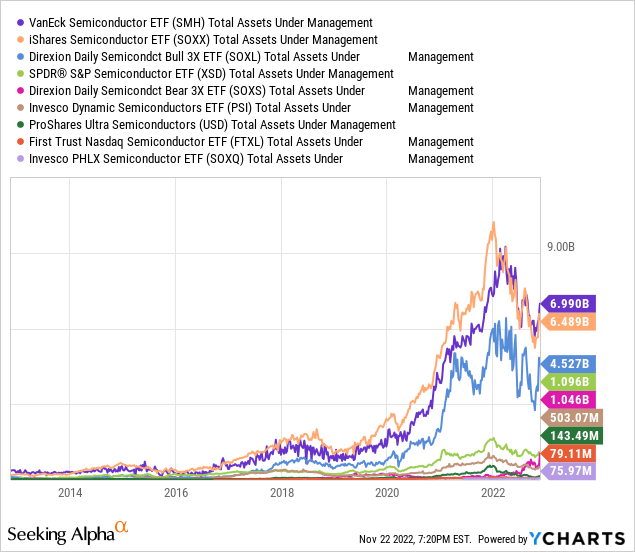
To give you a better idea how tremendous the AuM growth has been, ten years ago the total AuM across the (then-) active semiconductor ETFs was ~$800M.
Putting it differently, over the past decade, AuM have grown over 25x!!!
Was it worth it? You bet!
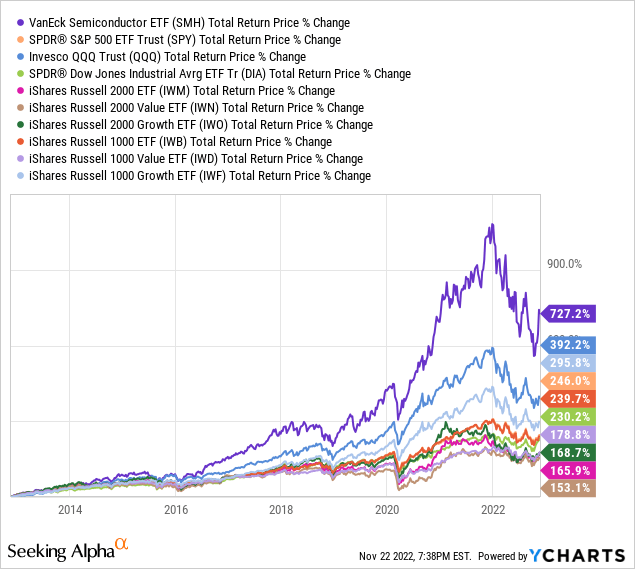
When comparing the performance over the past decade of the largest semiconductor ETF (SMH) to all types of indices – the former is outperforming by a very wide margin.
Blue chips or big tech, large-caps or small-caps, value or growth – it doesn’t matter what type of index you put against it, SMH is coming on top, with very little competition (as of day 1).
So is it wise to put all the chips on chips? That’s a different question that must take risk into account.
When Accounting for Risk, Chips’ Lead is Narrower
Let’s look at the volatility of all semiconductor ETFs compared to the volatility of the main indices’ most popular ETFs: SPDR S&P 500 ETF Trust (SPY), Invesco QQQ Trust (QQQ), and SPDR Dow Jones Industrial Average ETF Tr (DIA).
As you can see, the average current volatility of a semiconductor ETF is close to 50%, significantly higher than blue chips (DIA’s 20%), large-caps (SPY’s 27%) and even big tech (QQQ’s 36%)
[Note that the volatility of the leveraged instruments is obviously inflated by the leverage they employ; SOXL and SOXS are 3x-leveraged and USD is 2x-leveraged USD and so their respective volatility is 3x or 2x as high as a non-leveraged instrument]
Y-Charts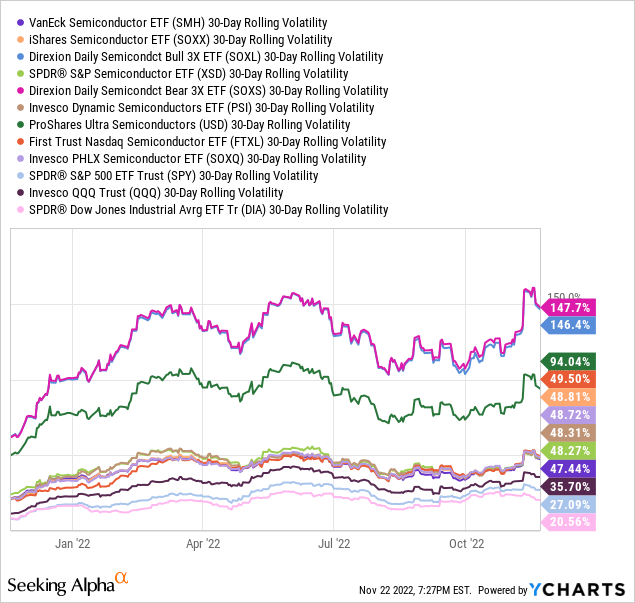
If we assume that current volatility is a good measure for the past decade (an extremely loosen assumption), while applying a very basic/simplistic model, we can say that these are the adjusted (for risk) returns over the past decade:
| Total Return | Volatility | TR/Vol | |
| SMH | 727.2% | 47.44% | 15.33 |
| SPY | 246.0% | 27.09% | 9.08 |
| QQQ | 392.2% | 35.70% | 10.99 |
| DIA | 230.2% | 20.56% | 11.20 |
True, SMH is still looking like the best investment (over the past 10 years), however the outperformance isn’t as impressive as it is when we measure it (solely) based on the absolute return, while ignoring the risk factor.
If we apply the exact same methodology, but this time using the performance over shorter periods – the results are quite different.
[Note that when we use shorter periods, especially (for example) the past year – the assumption regarding volatility is becoming stronger/more reasonable.]
- Between Mar. 23, 2020 (market bottom) to Dec. 27, 2021 (market peak):
– Absolute total returns:
Y-Charts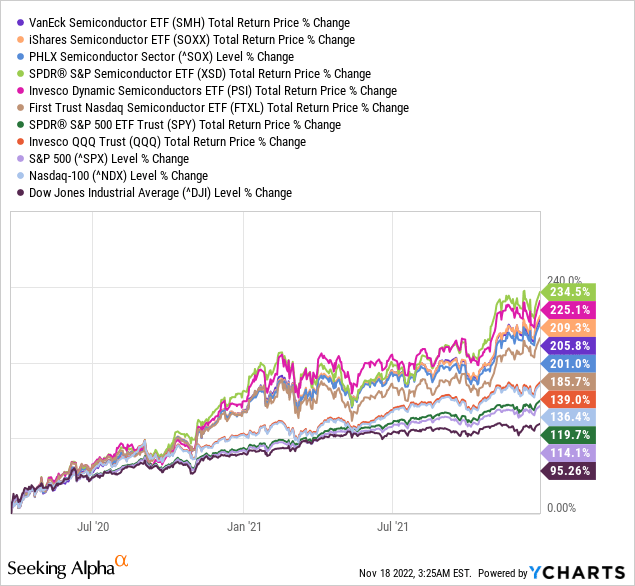
– Risk-adjusted returns:
| Total Return | Volatility | TR/Vol | |
| SMH | 205.8% | 47.44% | 4.34 |
| SPY | 119.7% | 27.09% | 4.42 |
| QQQ | 139.0% | 35.70% | 3.89 |
As you can see, although SMH delivered a significantly higher total return, SPY had actually performed better (than SMH and QQQ) on a risk-adjusted basis.
- Here are the returns since Dec. 27, 2021
– Absolute total returns:
Y-Charts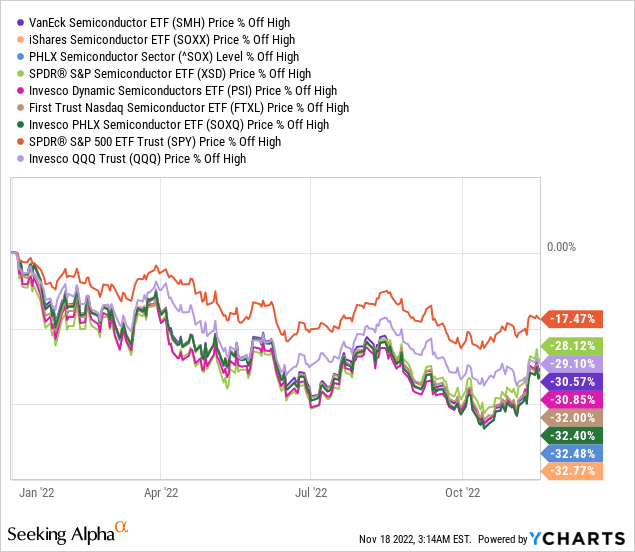
– Risk-adjusted returns:
| Total Return | Volatility | TR/Vol | |
| SMH | -30.57% | 47.44% | -0.64 |
| SPY | -17.47% | 27.09% | -0.64 |
| QQQ | -29.10% | 35.70% | -0.82 |
As you can see, although SMH has delivered the worst total return, it has performed in-line with SPY (and better than QQQ) on a risk-adjusted basis.
From the Largest to the Smallest
So far we have focused on the largest semiconductor ETF (SMH), but perhaps we would be better off using the smallest (SOXQ)?
SOXQ inception date is June 9, 2021 so it has been around for less than 18 months, and it currently manages only ~$76M in AuM.
Unlike SMH, which seeks to track the performance of the MVIS US Listed Semiconductor 25 Index, SOXQ seeks to track the performance of the PHLX Semiconductor Sector Index, the leading semiconductor index (“^SOX”).
So far in 2022, SOXQ has performed in line with ^SOX (slight outperformance for the former) but it has underperformed SMH by ~1.8%.
Y-Charts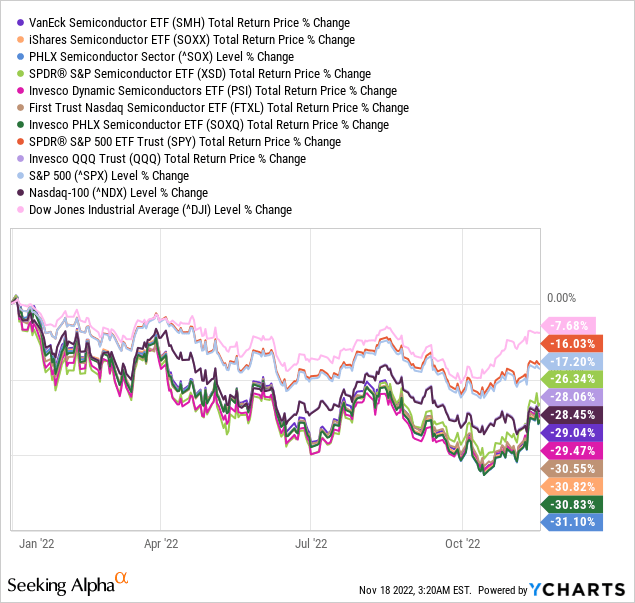
Since early October ^SOX is showing signs of recovery.
Bloomberg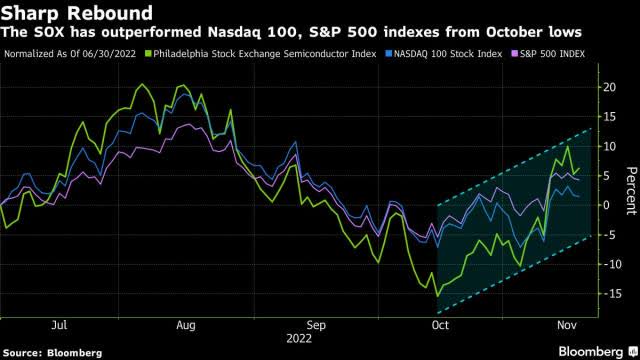
Nonetheless, that isn’t yet assisting SOXQ to outperform SMH.
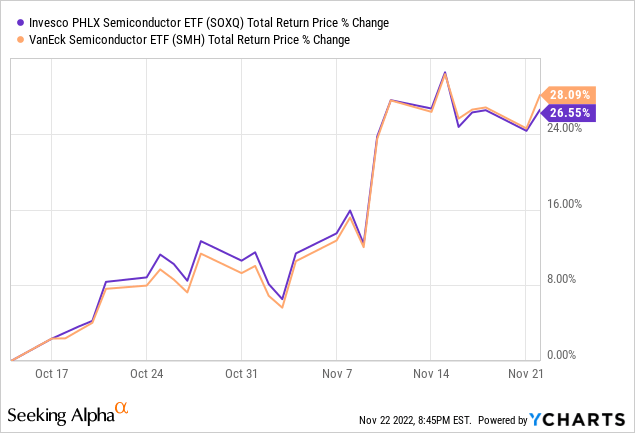
As it looks (at least to us), there’s no edge for SOXQ.
Not only is this ETF significantly smaller and younger than SMH, but it’s also lagging (even if slightly).
What are the main differences that are behind this underperformance?
SOXQ vs SMH
In order to answer this question, we’ve prepared the following tables (based on publicly available data):
| TICKER | COMPANY | SMH – WEIGHT | SOXQ – WEIGHT |
| ASML | ASML Holding NV | 11.20% | 4.63% |
| NVDA | Nvidia Corp | 10.88% | 8.41% |
| TSM | Taiwan Semiconductor Manufacturing Co Ltd ADR | 9.70% | 3.80% |
| TXN | Texas Instruments Inc | 8.19% | 8.38% |
| AVGO | Broadcom Inc | 7.89% | 8.18% |
| QCOM | Qualcomm Inc | 7.05% | 7.28% |
| AMD | Advanced Micro Devices Inc | 6.39% | 6.83% |
| INTC | Intel Corp | 6.27% | 3.69% |
| AMAT | Applied Materials Inc | 4.20% | 4.42% |
| ADI | Analog Devices Inc | 3.99% | 4.24% |
| LRCX | Lam Research Corp | 3.27% | 4.15% |
| MU | Micron Technology Inc | 3.03% | 4.15% |
| KLAC | KLA Corp | 2.56% | 4.29% |
| SNPS | Synopsys Inc | 2.20% | |
| NXPI | NXP Semiconductors NV | 2.06% | 4.04% |
| CDNS | Cadence Design Systems Inc | 1.92% | |
| MCHP | Microchip Technology Inc | 1.88% | 3.79% |
| MRVL | Marvell Technology Inc | 1.61% | 3.36% |
| ON | ON Semiconductor Corp | 1.35% | 2.84% |
| STM | STMicroelectronics NV | 1.31% | |
| MPWR | Monolithic Power Systems Inc | 0.82% | 1.63% |
| SWKS | Skyworks Solutions Inc | 0.74% | 1.38% |
| TER | Teradyne Inc | 0.67% | 1.34% |
| ENTG | Entegris Inc | 0.44% | 1.01% |
| OLED | Universal Display Corp | 0.25% | |
| GFS | GLOBALFOUNDRIES Inc | 3.23% | |
| WOLF | Wolfspeed Inc | 1.02% | |
| QRVO | Qorvo Inc | 0.89% | |
| LSCC | Lattice Semiconductor Corp | 0.84% | |
| NOVT | Novanta Inc | 0.53% | |
| COHR | Coherent Corp | 0.46% | |
| IPGP | IPG Photonics Corp | 0.43% | |
| SYNA | Synaptics Inc | 0.37% | |
| AZTA | Azenta Inc | 0.41% |
- Difference* between the holdings of the two ETFs
[*In absolute terms]
| TICKER | COMPANY | DIFFERENCE* |
| ASML | ASML Holding NV | 6.57% |
| TSM | Taiwan Semiconductor Manufacturing Co Ltd ADR | 5.90% |
| GFS | GLOBALFOUNDRIES Inc | 3.23% |
| INTC | Intel Corp | 2.58% |
| NVDA | Nvidia Corp | 2.47% |
| SNPS | Synopsys Inc | 2.20% |
| NXPI | NXP Semiconductors NV | 1.98% |
| CDNS | Cadence Design Systems Inc | 1.92% |
| MCHP | Microchip Technology Inc | 1.91% |
| MRVL | Marvell Technology Inc | 1.75% |
| KLAC | KLA Corp | 1.73% |
| ON | ON Semiconductor Corp | 1.49% |
| STM | STMicroelectronics Nv | 1.31% |
| MU | Micron Technology Inc | 1.12% |
| WOLF | Wolfspeed Inc | 1.02% |
| QRVO | Qorvo Inc | 0.89% |
| LRCX | Lam Research Corp | 0.88% |
| LSCC | Lattice Semiconductor Corp | 0.84% |
| MPWR | Monolithic Power Systems Inc | 0.81% |
| TER | Teradyne Inc | 0.67% |
| SWKS | Skyworks Solutions Inc | 0.64% |
| ENTG | Entegris Inc | 0.57% |
| NOVT | Novanta Inc | 0.53% |
| COHR | Coherent Corp | 0.46% |
| AMD | Advanced Micro Devices Inc | 0.44% |
| IPGP | IPG Photonics Corp | 0.43% |
| AZTA | Azenta Inc | 0.41% |
| SYNA | Synaptics Inc | 0.37% |
| AVGO | Broadcom Inc | 0.29% |
| OLED | Universal Display Corp | 0.25% |
| ADI | Analog Devices Inc | 0.25% |
| QCOM | Qualcomm Inc | 0.23% |
| AMAT | Applied Materials Inc | 0.22% |
| TXN | Texas Instruments Inc | 0.19% |
Main Conclusions/Differences:
1) SMH (25 holdings) is more concentrated than SOXQ (30 holdings).
SMH’s top-5/top-8 holdings are accounting for 47.9%/67.6% of the fund’s AuM. Contrary to that, SOXQ’s top-5/top-8 holdings are accounting for only 39.1%/52.4% of the fund’s AuM.
2) While SOXQ is focusing on the US market, SMH is offering a greater global exposure, mostly through its largest (ASML) and 3rd-largest (TSM) holdings.
While SOXQ has 8.43% exposure (in total) to these two names, SMH puts 20.9% in these non-US names.
3) SMH also likes NVDA and INTC much better than SOXQ, allocating about 2.5% more to each of these positions.
4) Total Expense Ratio: SMH = 0.35%; SOXQ = 0.19%
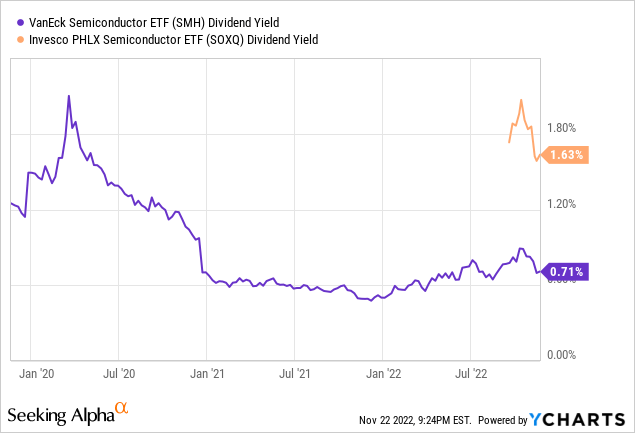
5) 12 Month Distribution Rate: SMH = 0.71%, SOXQ = 1.67%
Takeaways
Recent trends within the semiconductor industry draw a pretty gloomy outlook for the world’s economy.
Global chip sales Y/Y growth rate is slowing dramatically and rapidly, suggesting that a recession might be upon us in the foreseeable future.
Bloomberg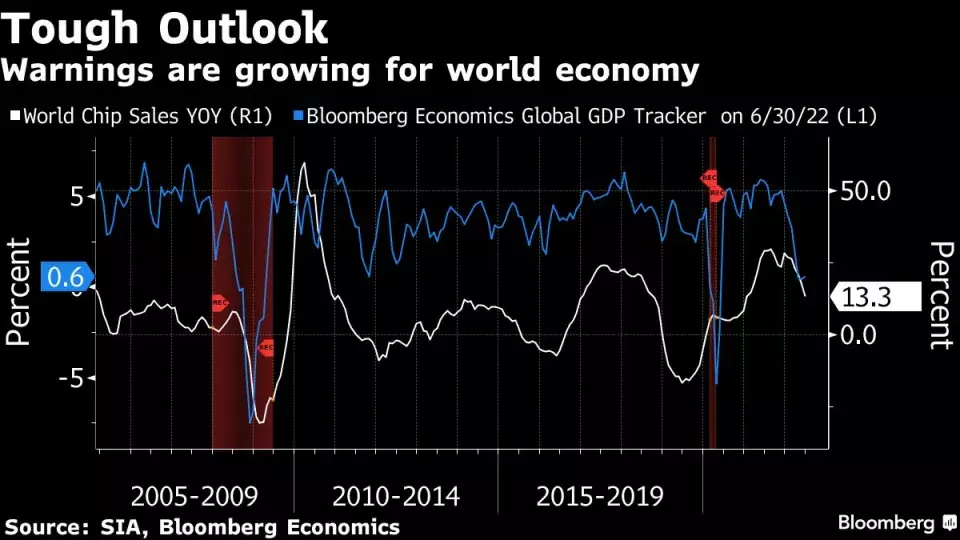
As a matter of fact, the most recent data is already putting global semiconductor sales at negative Y/Y territory, something that coincided with previous severe economic downturns.
WSTS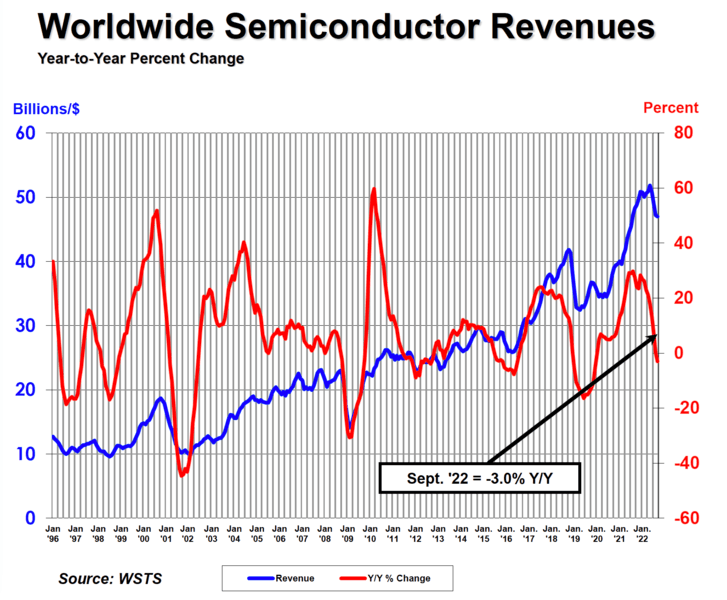
Do we want to own semis when the risk of a global recession is so high? Probably not.
Nonetheless, if history is any guide – semiconductors will rise from the ashes as soon as a new economic cycle begins.
As a matter of fact, the time to buy semis will be a few months before a new economic cycle begins.
Trading Academy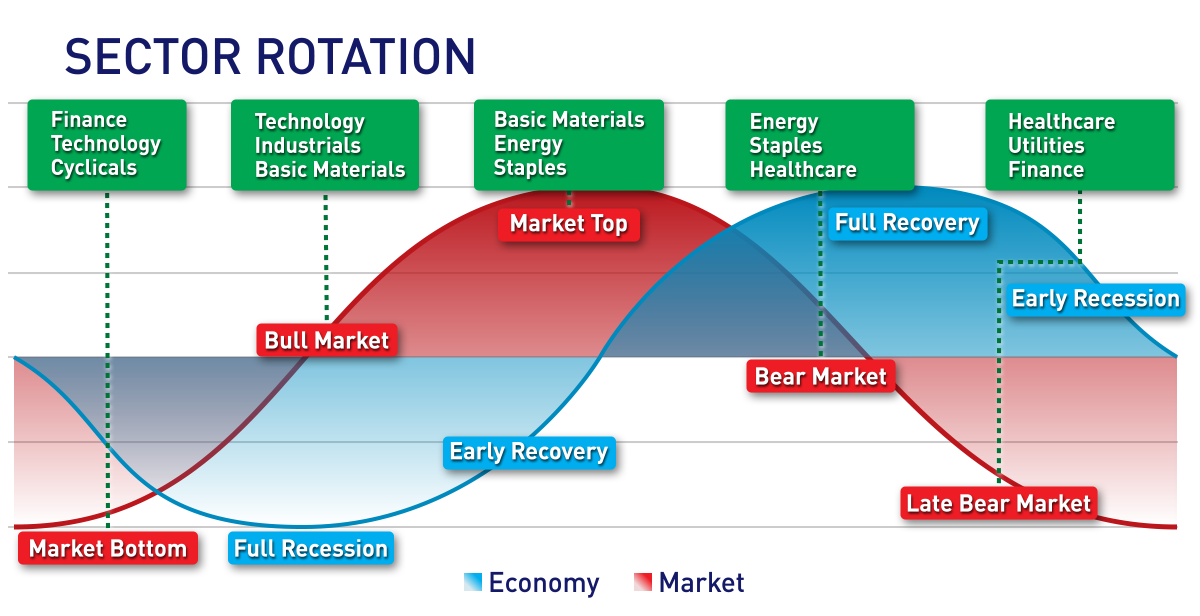
As for the fight between SMH and SOXQ, it doesn’t look as if there’s a clear winner. In any case, we’re big believers in “Macro trumps Micro”, i.e. if you get the theme/timing right – the exact instrument you use is less important.
Therefore, we believe it’s way more important to know the landscape and get yourself familiar with the area you’re about to cross than the specific/exact vehicle/instrument you intend to ride through it.
Be the first to comment