

bloodua/iStock via Getty Images
Introduction
The Top Dividend Growth stock model expands on my doctoral research analysis on multiple discriminant analysis (MDA) adding new complexities with these top picks. Research shows that the highest frequency of large price breakout moves are found among small cap stocks with low trading volumes offering no dividends and delivering higher than average risk levels.
The challenge with the Top Dividend & Growth model is to deliver a combination toward optimal total return with characteristics that typically reduce the frequency and magnitude of price breakouts, but deliver more reliable growth factors for higher profitability longer term.
Market Conditions
The first half of 2022 delivered the worst start to the stock market since 1970 and 2022 continues with the worst returns since 2008. These terrible market results going back 52 years and longer have pared much of the strong initial gains in the prior portfolios. The best approach is to follow the Momentum Gauges® as members have done to avoid all major downturns. Following the gauges for all of the Growth & Dividend portfolios have preserved high positive returns in the current 10-month downturn.
DJIA -20.95%, S&P 500 -24.77%, Nasdaq -32.40%, Russell 2000 -25.86%
FinViz.com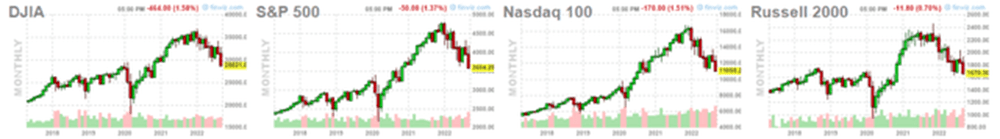
As we start October, the Momentum Gauges® are all negative including the monthly gauges negative 10 out of the last 11 months from November. The Fed is doubling the quantitative tightening (QT) policy to reduce balance sheet liquidity. These are adverse market conditions as detailed in my recent video and prior videos throughout 2022 and caution is highly recommended.
VMBreakouts.com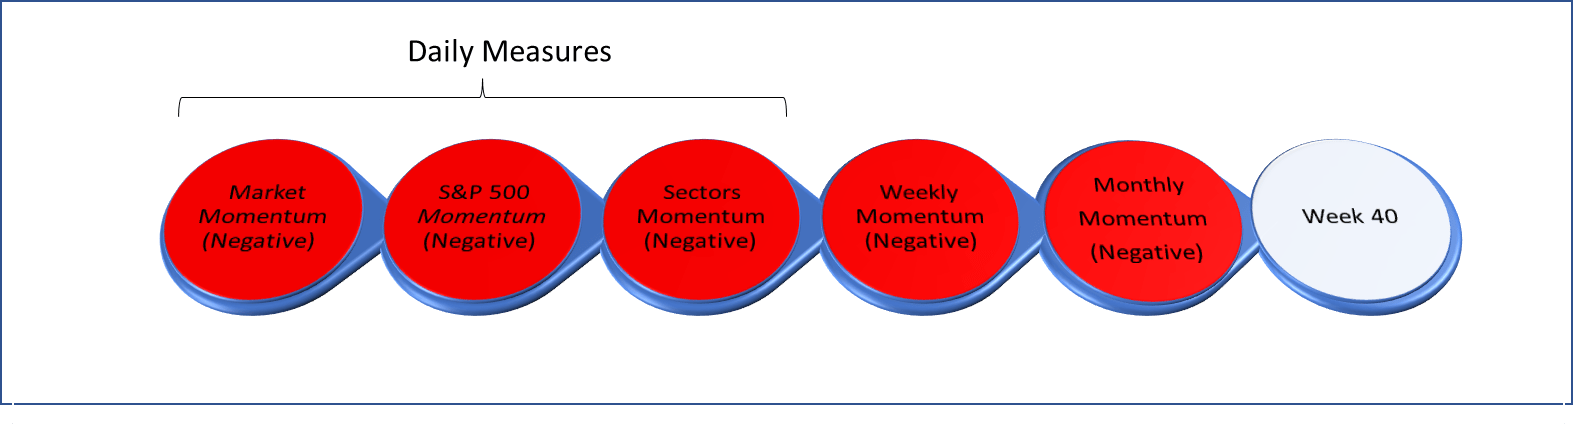
The October 2021 Growth & Dividend 1-year portfolio is down -4.01% with strongest gains in Canadian Natural Resources (CNQ) +27.45% and BP p.l.c. (BP) +4.46%. The 2-year October portfolio is up +3.65% with strongest gains in Allstate Corp. (ALL) +32.28% and HP Inc. (HPQ) +31.23%.
FinViz.com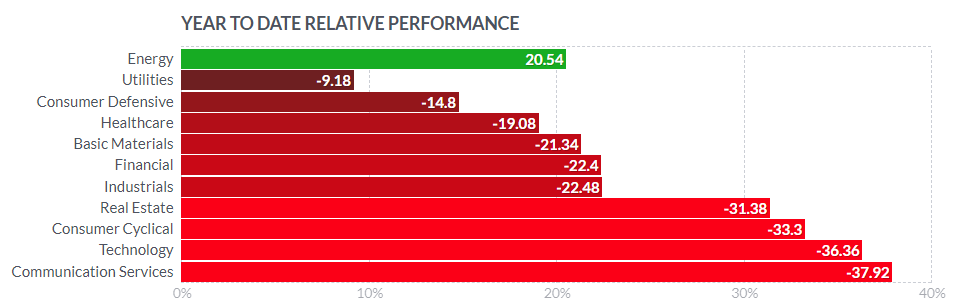
Year to date only the Energy sector remains positive and most prior Growth & Dividend picks are heavily in the Energy sector. Any of the prior portfolios not in Energy stocks have been hard hit.
Selection criteria continues to be adjusted towards commodity stocks and less volatile growth candidates as market conditions remain very negative especially in the Communications and Technology sector. The Monthly Momentum Gauges continue negative as we begin October. It is best to wait for conditions to improve again and at least have the daily gauges positive again, but these selections will continue to focus on the strongest of mega cap dividend stocks.
app.VMBreakouts.com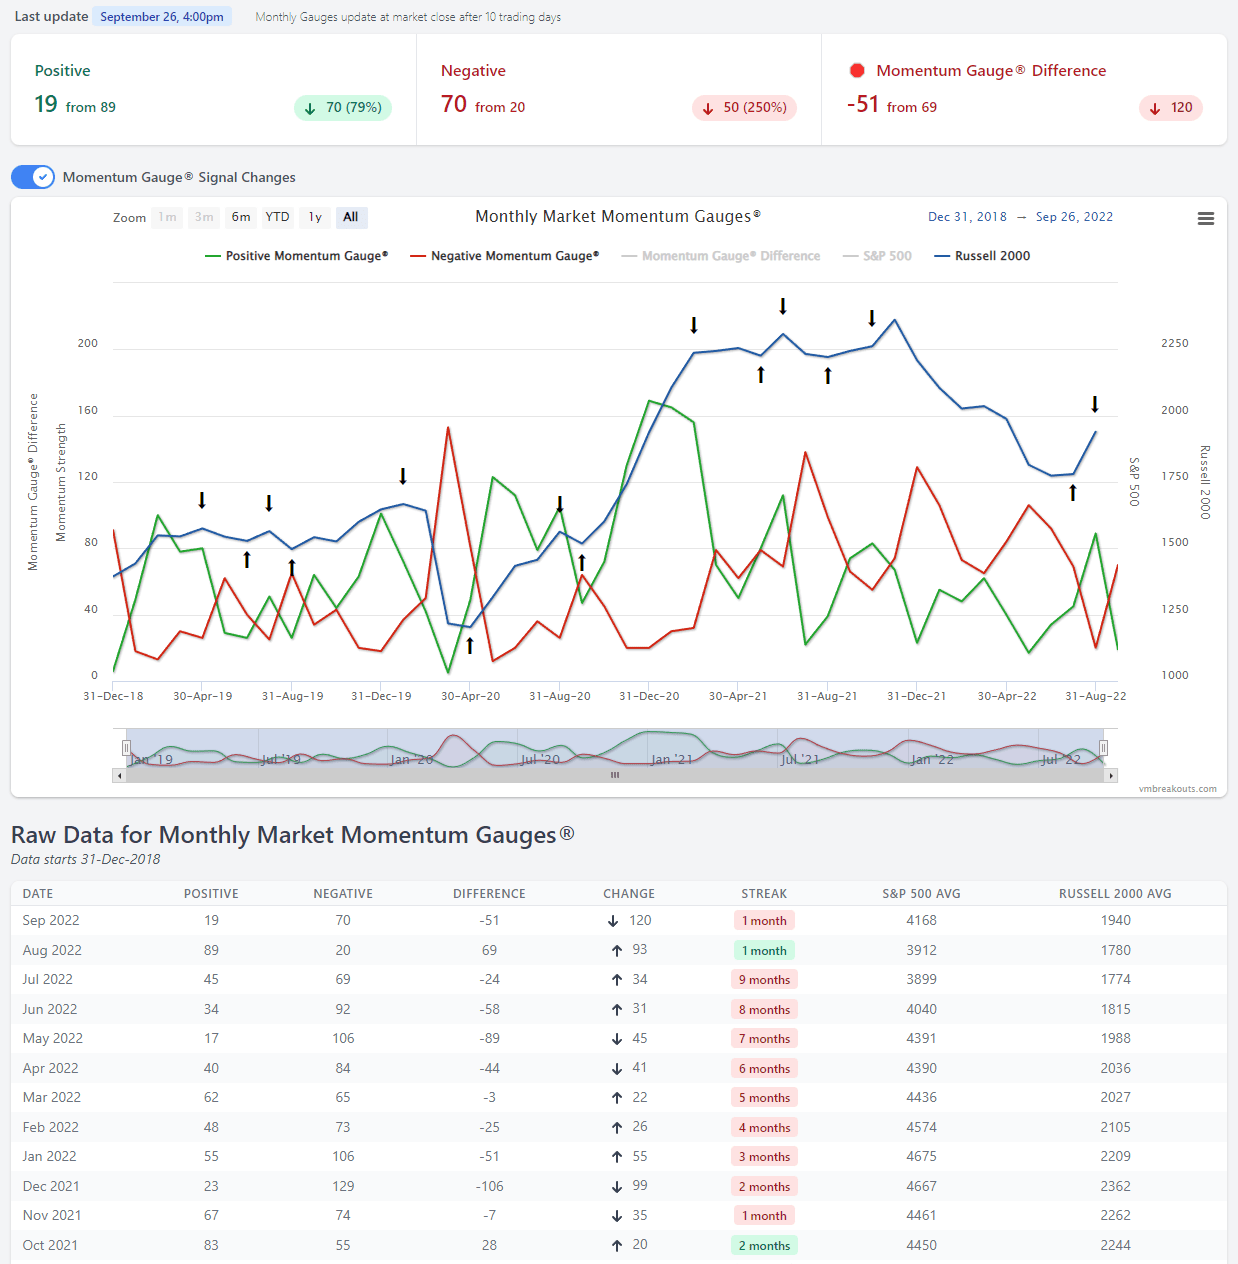
Readers are free to buy/hold for the one-year measurement period of each portfolio, hold longer, or update your Growth & Dividend portfolios with newer monthly selections. You can consider the January portfolio as the main annual selection, but you also get 11 monthly bonus selections to consider throughout the year. The list of top performing MDA Growth & Dividend stocks is in the table near the end of the article.
Each monthly selection portfolio consists of 5 stocks above a minimum $10 billion market cap, $2/share price, 500k average daily volume and a minimum 2% dividend yield. The population of this unique mega cap segment is approximately 330 stocks out of over 7,800 stocks across the US stock exchanges. While these stocks represent less than 5% of available stocks, their market cap exceeds $19 trillion out of the approximately $33 trillion (57.6%) of the US stock exchanges. Efforts are made to optimize total returns on the key MDA price growth factors (fundamental, technical, sentiment) for the best results under these large cap constraints with high priorities for dividend growth and dividend yield.
2 Top Growth & Dividend Stocks For October 2022
Score Overview of the Growth & Dividend Stocks for October
StockRover.com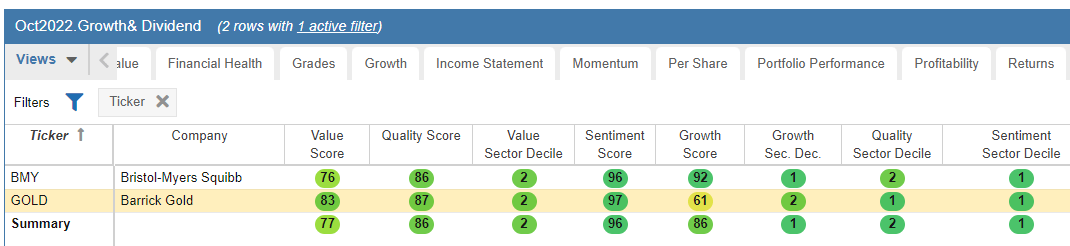
Dividend Calendar
StockRover.com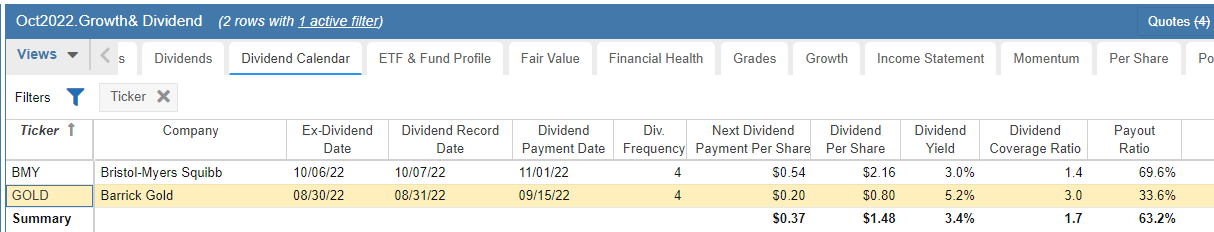
The factors shown above are not necessarily selection variables used in the MDA analysis and dividend algorithms for growth and strong total returns. Dividend yield for all these selections is well above 2% minimum for this portfolio and as high as 5.2%. These are among the highest dividend yielding mega cap stocks with strong growth and may attract strong net inflows if market conditions contribute toward more defensive positions. These additional financial perspectives and reports are included to enhance your investment decisions for total returns. The returns shown in all the annual measurements do not include any of these large dividend yields.
Bristol Myers Squibb
FinViz.com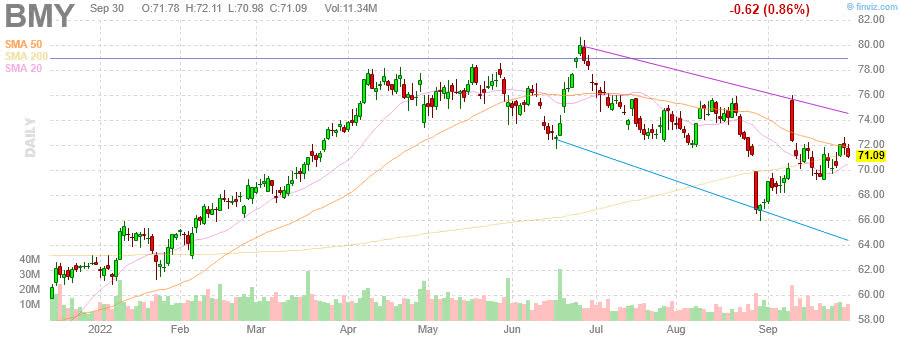
StockRover.com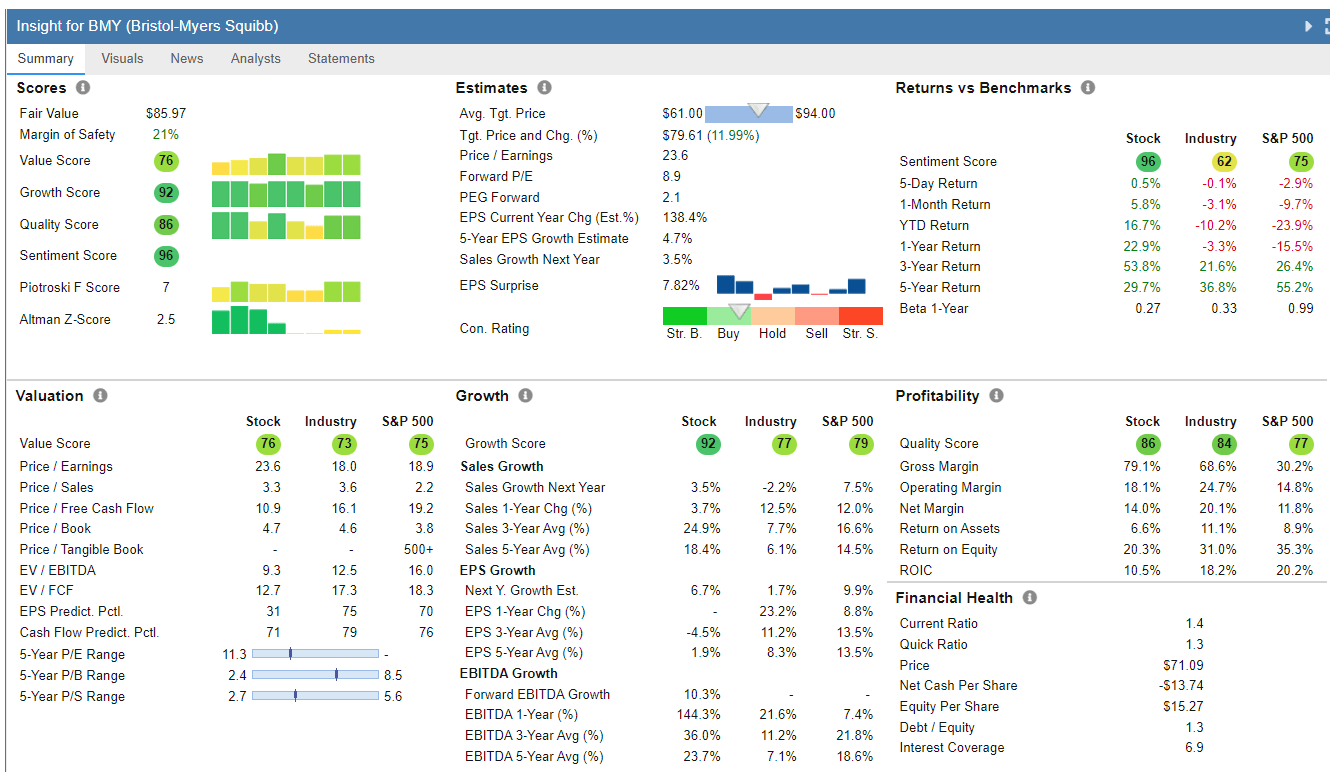
StockRover.com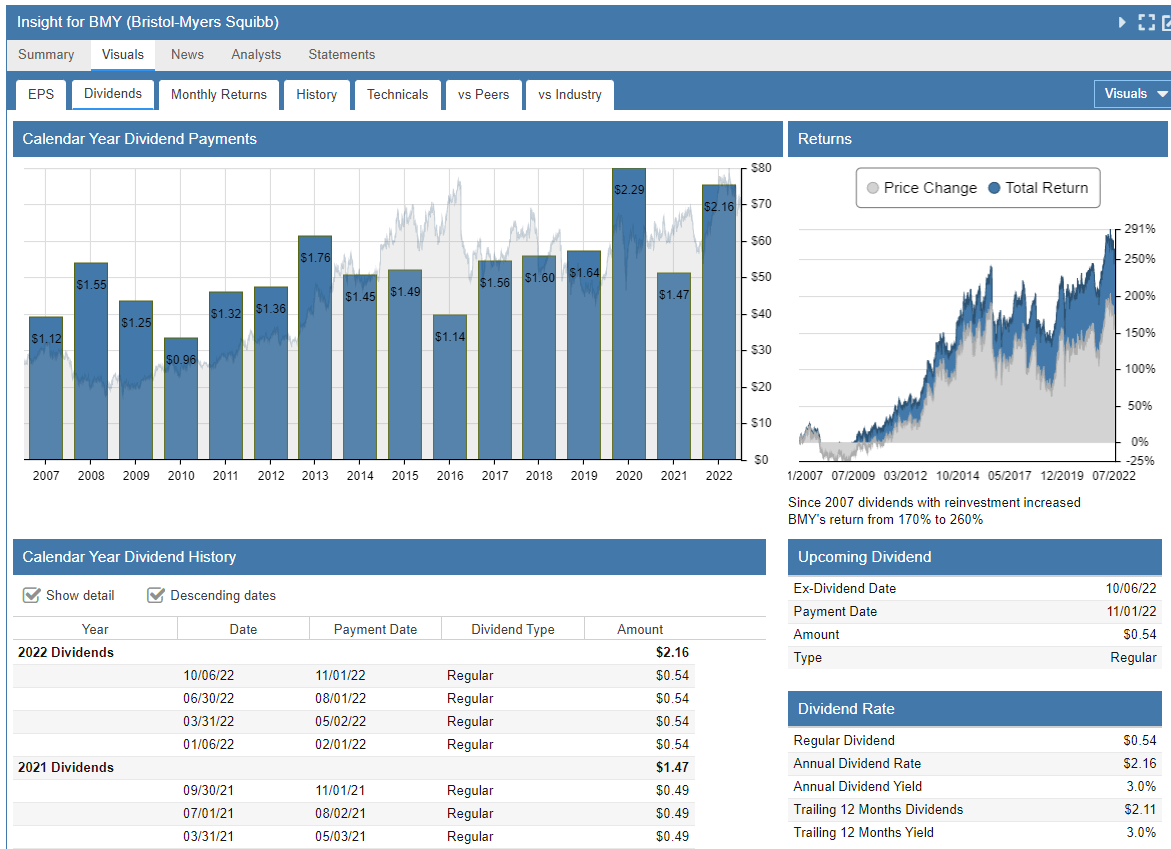
(Source: FinViz)
Bristol-Myers Squibb Company discovers, develops, licenses, manufactures, and markets biopharmaceutical products worldwide. It offers products for hematology, oncology, cardiovascular, immunology, fibrotic, neuroscience, and covid-19 diseases. The company’s products include Revlimid, an oral immunomodulatory drug for the treatment of multiple myeloma; Eliquis, an oral inhibitor for reduction in risk of stroke/systemic embolism in NVAF, and for the treatment of DVT/PE; Opdivo for anti-cancer indications; Pomalyst/Imnovid indicated for patients with multiple myeloma; and Orencia for adult patients with active RA and psoriatic arthritis.
Source: Company resources
Barrick Gold
FinViz.com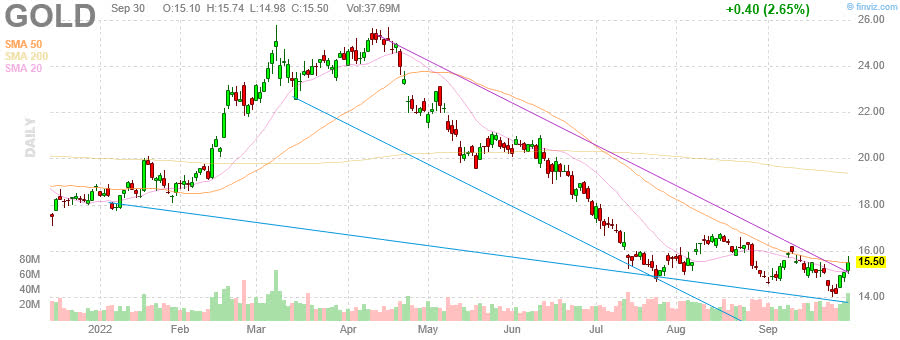
StockRover.com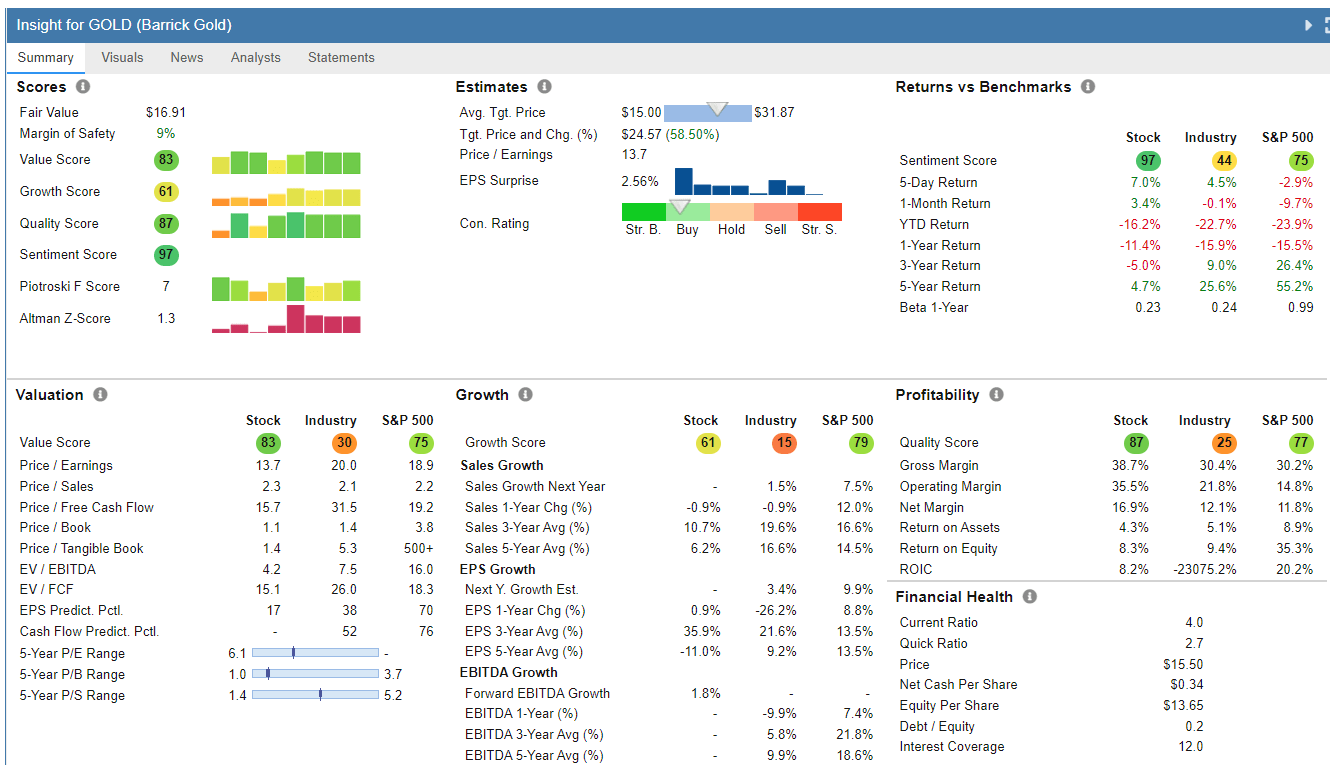
StockRover.com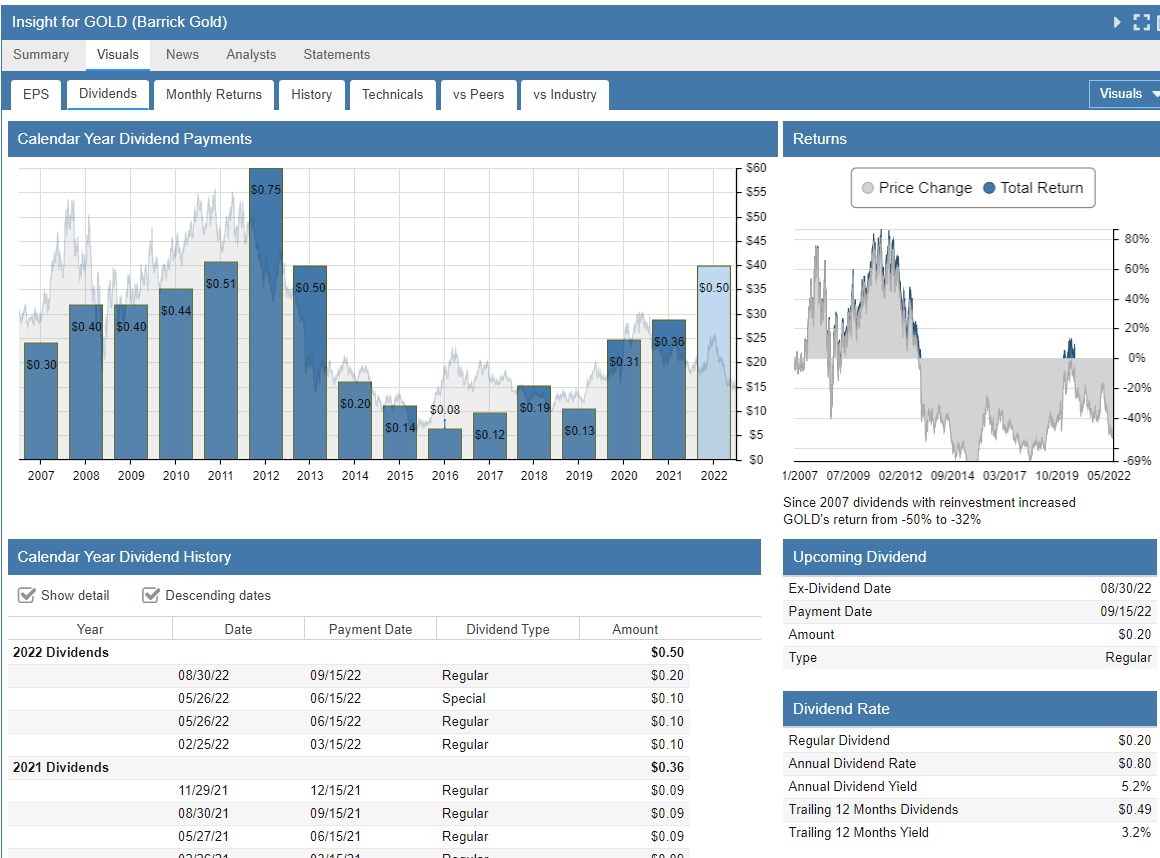
(Source: FinViz)
Barrick Gold Corporation engages in the exploration, mine development, production, and sale of gold and copper properties. It has ownership interests in producing gold mines that are located in Argentina, Canada, Cote d’Ivoire, the Democratic Republic of Congo, Dominican Republic, Mali, Tanzania, and the United States.
Source: Company resources
Prior 2-year Returns of Long Term Dividend Portfolios
These selections are down significantly but still outperforming the stock market and all the major Hedge Fund averages since inception. Returns are greatly enhanced by following the Momentum Gauge signals and avoiding major downturns. Consider the actively managed ARK Innovation fund down -60.11% YTD. Last year at this time the October 1-year portfolio was up +40.90% prior to the monthly Momentum Gauges turning negative in November 2021. The returns for all the portfolios one year ago are shown below.
VMBreakouts.com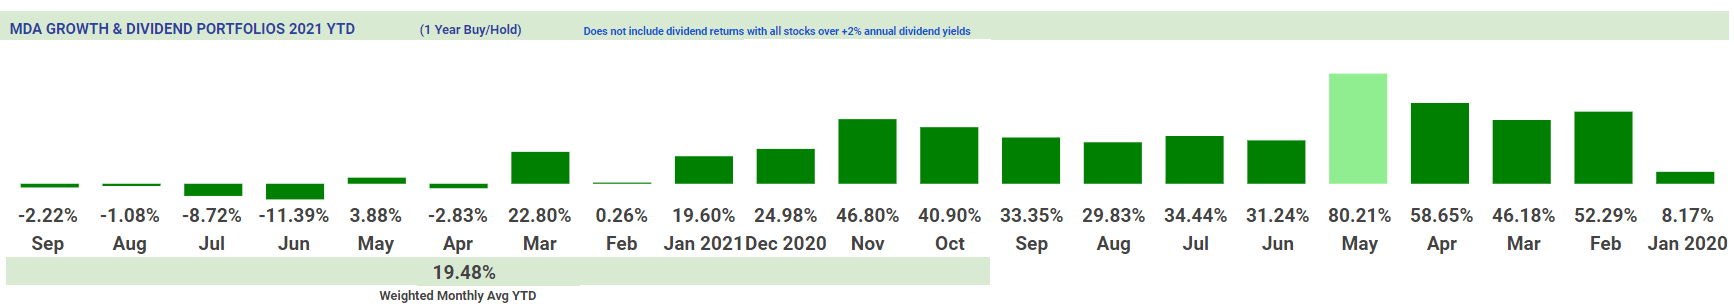
Since the Momentum Gauges® turned negative in November for these monthly portfolios the returns have declined significantly. The current 2-year returns to date are -4.05% on the MDA Growth & Dividend selection model not including any of the large % dividend total returns from all stocks:
VMBreakouts.com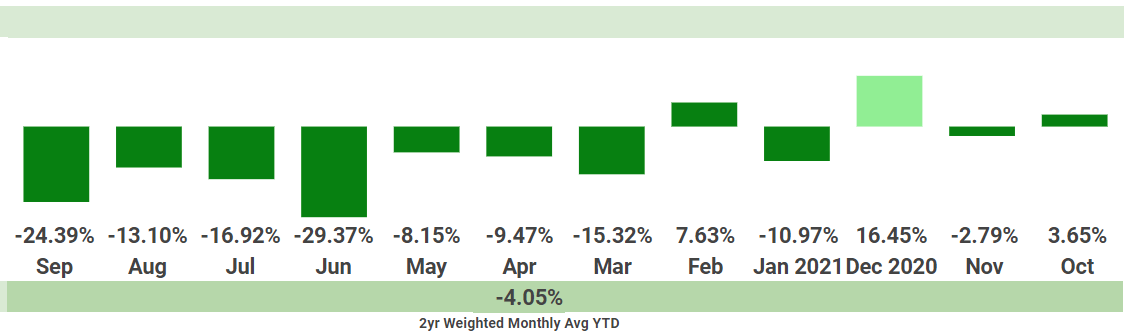
The 1-year average returns are -16.00%, down significantly from the highs through record 2022 declines YTD, but with a majority of portfolios beating the benchmark indices over the same time period. April is the worst performing portfolio and unlike any other monthly selection was comprised heavily of financial stocks with no energy stocks. The S&P 500 is down -24.77% YTD and -17.71% YoY.
VMBreakouts.com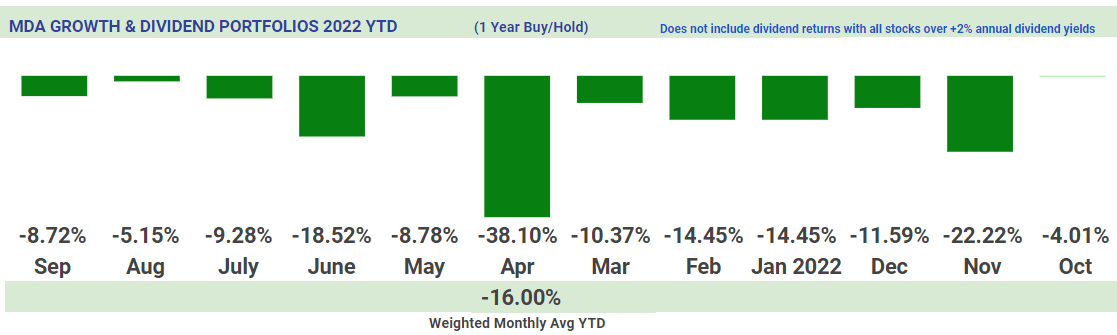
Prior Long-Term Gainers to Consider
This section is a brief review of strong prior selections that have delivered on the long-term growth forecast YTD. From the start of the year across all the long-term Growth & Dividend MDA selections, the following stocks have significantly outperformed on price alone, not including dividends. Many of these stocks are in more than one monthly selection portfolio, as high variable standard criteria often produce a small pool of strong candidates with frequent overlap.
These selections are significantly outperforming major Hedge Funds in 2022 and the hedge fund benchmarks since inception.
| Symbol | Company | Price | Return from Selection |
| (COP) | ConocoPhillips | 102.34 | 143.09% |
| (LLY) | Eli Lilly and Co. | 323.35 | 133.10% |
| LLY | Eli Lilly and Co. | 323.35 | 129.33% |
| (KLAC) | KLA Corp. | 302.63 | 110.54% |
| (INFY) | Infosys Ltd. ADR | 16.97 | 83.86% |
| (AMP) | Ameriprise Financial, Inc. | 251.95 | 79.87% |
| (MTB) | M&T Bank Corporation | 176.32 | 70.23% |
| AMP | Ameriprise Financial, Inc. | 251.95 | 67.92% |
| AMP | Ameriprise Financial, Inc. | 251.95 | 58.57% |
| (KR) | Kroger Co. | 43.75 | 55.53% |
| INFY | Infosys Ltd. ADR | 16.97 | 55.12% |
| (HPQ) | HP Inc. | 24.92 | 42.97% |
| (NVO) | Novo Nordisk A/S | 99.63 | 34.73% |
| (ALL) | Allstate Corp. | 124.53 | 32.28% |
There is overlap over the months among different portfolios finding similar high quality ratings over time.
*Returns to date on the MDA Growth & Dividend selection model do not include large dividends from each stock.
Conclusion
These stocks continue a live forward-testing of the breakout selection algorithms from my doctoral research applied to large cap, strong dividend growth stocks. None of the returns listed above include the high dividend yields as part of the performance and would further increase total returns for each stock. These monthly top Growth & Dividend stocks are intended to deliver excellent long-term total return strategies leveraging key factors in the MDA breakout models used in the small cap weekly breakout selections.
These selections are being tracked on the V&M Dashboard Spreadsheet for members and enhancements will continue to optimize dividend, growth, and higher breakout frequency variables throughout the year.
All the very best to you!!
JD Henning, PhD, MBA, CFE, CAMS
Be the first to comment