Petmal
Vistra Energy (NYSE:VST) is one of my favorite utility-esque dividend growth stocks with strong exposure to the growing green energy space as well as a unique shareholder rewards structure in which buybacks fuel dividend growth.
Let’s dive in for an overview of VST’s power generation portfolio, a cash flow assessment, and a quick look at how its buybacks fuel dividend growth. In the process, we’ll see why I find it such a compelling stock for dividend growth.
Vistra’s Rapidly Greening Utility Portfolio
VST has three main business segments:
- Power Generation through various fossil fuel and nuclear power plants
- Unregulated Retail Utilities primarily through TXU Energy in Texas and Dynegy in the Midwest
- Green Energy operations and development through Vistra Zero, mainly solar and battery storage projects
There is plenty of overlap and synergy between these three segments, making VST a hybrid utility/power producer/renewables developer.
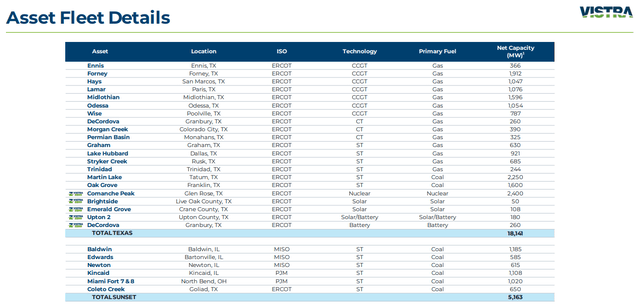
As far as VST’s power generation fleet goes, the company mostly owns gas-fired plants, but also has a handful of coal plants still in operation as well as solar facilities and one nuclear power plant – Comanche Peak in North Texas. With tax credits available for nuclear power plants from the “Inflation Reduction Act,” VST recently decided to extend the 32-year-old Comanche Peak’s operational life by another 20 years.
VST Q3 Presentation
VST Q3 Presentation
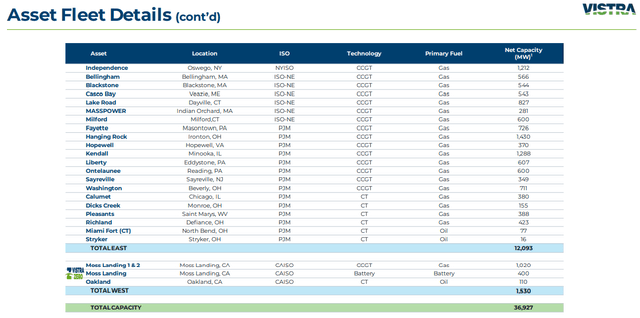
As you can see from the net capacity column on the far right above, about half of VST’s power production fleet is located in Texas. Most of the other half is located in the Midwest and Mid-Atlantic regions, with a small but growing portion in California.
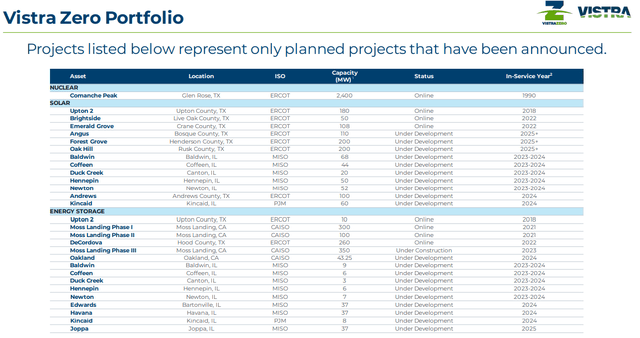
VST is pouring most of its growth spending into expansion of its Vistra Zero/renewable energy portfolio, which is expected to more than triple in size in the next three years.
VST Q3 Presentation
This renewable energy development activity is concentrated in three states: Texas, California, and Illinois.
Update On Vistra Energy
As of the first nine months of 2022, VST is performing roughly according to its guidance shared earlier in the year.
Debt levels spiked in the first half of 2022 as the company paid upfront fees to hedge energy prices for the next year or so, but VST has already reduced much of that debt. In Q3, the company paid down ~$1.4 billion in debt, and they expect to pay down another $1.1 billion by the end of the year.
As of early November, VST’s corporate-level net debt to EBITDA (using the midpoint of 2023 EBITDA guidance) sits at 3.3x.
(I’m not including margin deposits in this calculation, because margin debt for energy trading purposes isn’t included in net debt.)
Though the company’s long-term net leverage target is below 3x, I do believe they will be able to steadily work it down over the coming years, since so much hedging activity has already been completed.
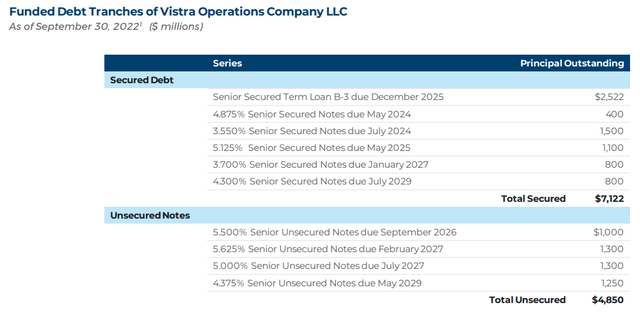
Management says they expect to perform more debt retirement from 2023 to 2026, but it is interesting to note that the company has no corporate debt maturities in 2023.
VST Q3 Presentation
In the case of a 2023 recession and weaker fundamental performance than expected, the lack of debt maturities next year will be helpful.
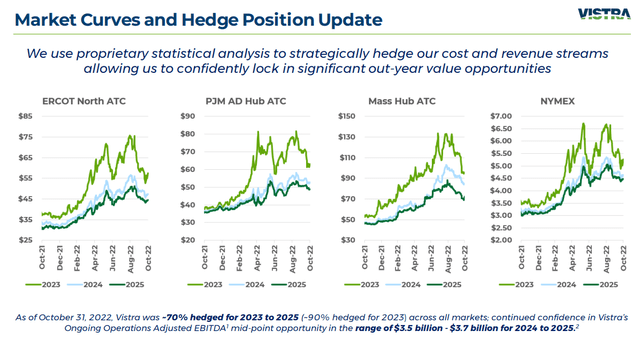
By the way, backtracking to the hedging activity for a moment, VST is now ~90% hedged through 2023 and ~70% hedged from 2023-2025.
VST Q3 Presentation
This significantly reduces the potential volatility of VST’s revenue streams and expenses, allowing for greater visibility into forward performance in the coming years.
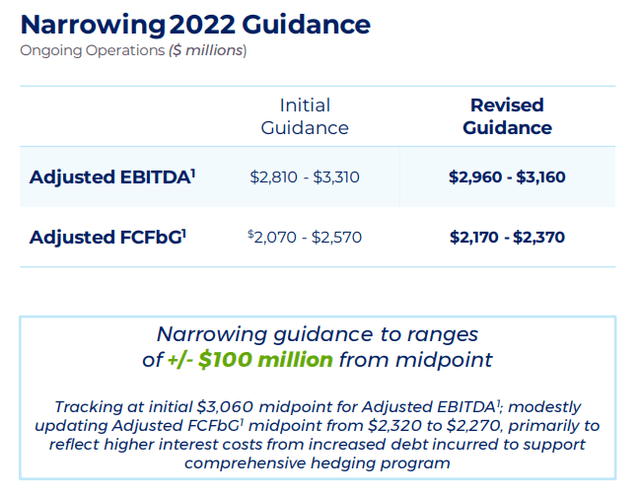
After this hedging activity, including the upfront costs, VST has narrowed its EBITDA and FCF before growth (“FCFbG”) guidance for this year around the midpoint.
VST Q3 Presentation
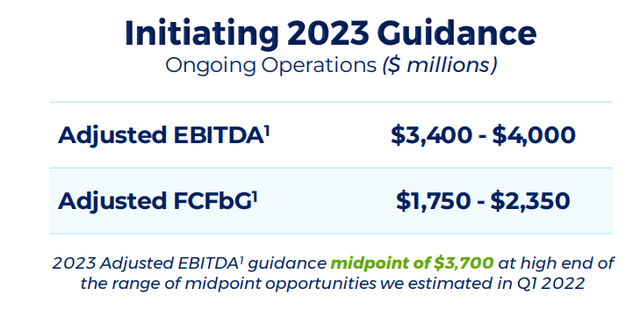
What’s more, in Q3, VST also issued initial guidance for 2023, which calls for ~21% growth in adjusted EBITDA at the midpoint and a ~10% drop in FCF.
VST Q3 Presentation
We’ll address that drop in expected FCF below, but for now I’d like to put these free cash flow numbers in context.
VST expects FCFbG of $2.27 billion at the midpoint for 2022. Comparing that to its market cap of $9.73 billion, we arrive at a FCF yield of 23.3%.
For 2023, VST expects FCFbG of $2.05 billion at the midpoint. Again comparing that to the current market cap, we arrive at a 21.1% FCF yield.
Or, if you take early closures of certain coal-fired power plants into account, the midpoint of VST’s FCF for 2023 is $1.815 billion, which would give the stock an FCF yield of 18.7%.
This is a very impressive FCF yield!
Why is FCF expected to decline next year? At first, I thought it might be due to higher interest expenses, but management has forecast interest costs to rise only 2.8% in 2023.
Instead, most of the increased expenses that accounts for the difference between projected growth in EBITDA and a projected decline in FCF comes from non-growth capex such as the purchase of environmental allowances (carbon credits). In fact, the purchase of environmental allowances is expected to jump from $75 million in 2022 to $520 million in 2023, making up most of the jump in non-growth capex YoY.
For those who are understandably upset at the early closure of coal plants still well within their useful lives, it’s helpful to keep in mind that government policy heavily favors renewables and disfavors these carbon-emitting plants. Instead of paying fees to the EPA for carbon credits, VST would prefer raking in tax credits for solar and battery storage assets.
Whether you approve of these government incentives and disincentives or not, VST is a shareholder-owned market actor, and it is management’s responsibility to respond to these incentives in a shareholder-friendly manner.
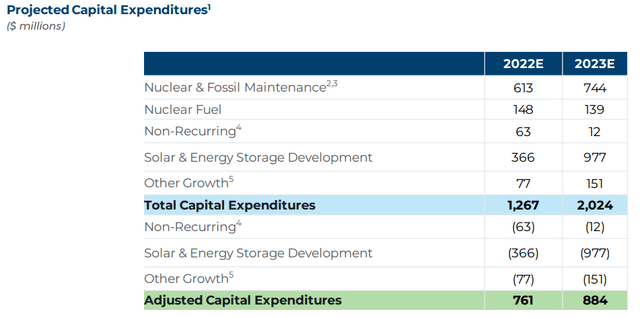
On that note, it’s unsurprising to observe that almost all of VST’s growth capital expenditures are for solar and battery storage projects.
VST Q3 Presentation
Let’s get a good idea of the amount of “growth capex” that will need to be funded with FCF for 2023.
Most Vistra Zero spending will be funded through a green preferred issued in December 2021 along with non-recourse, project-level debt, so we can remove the $977 million for that line item.
And non-recurring expenditures, such as winterizing power generation assets, isn’t really growth spending, so we can omit that.
But “other growth,” which includes growth spending at existing power generation assets, actually seems like growth capex to me, so we’ll keep that in.
Thus, true “adjusted capex” or what might need to be funded from FCF amounts to about $1.035 billion for 2023.
Now add to that the ~$1 billion in buybacks and $300 million in dividends planned for 2023 and you get $2.335 billion in total capital.
But recall that the midpoint of FCFbG guidance for 2023 (including asset closures) is $1.815 billion. We’ve got a half-billion-dollar shortfall in available cash for next year. Even if we use management’s $884 million in adjusted capex instead of $1.035 billion, then total capital needs will be ~$2.18 billion, giving a $360 million shortfall.
If my calculations are accurate or close to accurate, then something will have to give next year. Maybe it will be lower buybacks than management would like. Or maybe (more likely) VST will simply draw down on its $535 million in cash and equivalents.
Including cash reserves, VST has about $4 billion in total liquidity. Thus, this $350-$500 million cash shortfall for all of VST’s capital allocation plans for next year shouldn’t be a problem.
FCF Fuels Buybacks & Buybacks Fuel Dividend Growth
What makes VST such an interesting dividend growth play is, ironically, its aggressive buyback regime.
Normally, I prefer companies to prioritize dividend growth over buybacks, but in VST’s case, the company has chosen to pay out a fixed $300 million annually as dividends. So, buybacks reduce the number of shares outstanding, thereby decreasing the denominator and allowing dividends per share to grow.
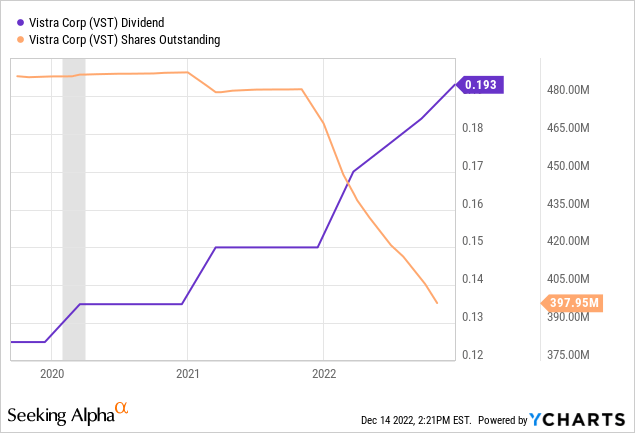
VST’s Q4 2022 dividend of $0.193 represents YoY growth of 29%.
If VST’s stock price rises meaningfully (to the point where its dividend yield dips below 3%), I’d prefer to see the company pull back on buybacks and instead prioritize deleveraging and dividend growth. But as long as the share price is rangebound and FCF is flowing in, I am happy with the current policy.
Bottom Line
VST is a well-run hybrid utility with an attractive green energy growth plan, strong and steady FCF, and a shareholder-friendly buyback/dividend growth policy.
Considering its 3.2% dividend yield and double-digit dividend growth, VST makes a compelling stock for dividend growth investors to buy on dips.


Be the first to comment