

Arturo Holmes
Innovations in the payments space can be interpreted as threats to traditional payment processors like Visa Inc. (NYSE:V). One recent entry into the payments arena is “Buy Now, Pay Later,” where consumers pay in installments without interest, though often at higher prices. Visa isn’t steering clear of the latest trend and instead is partnering with the world’s fastest-growing buy now pay later platform, Klarna, to offer a physical Visa card consumers can use anywhere to purchase items they will pay off in four installments.
One of Visa’s largest revenue streams are the fees it charges merchants to process payments through the Visa network. That source of income is being threatened by new proposed legislation that would force Visa to offer the ability for merchants to use at least one alternative network to process those payments. The bill, proposed in the U.S. Senate, aims to increase competition and lower costs for small businesses.
A threat by Amazon to stop accepting Visa credit cards for transactions in the United Kingdom was likely a strategy to force the payment processor to lower the fees it charges the giant internet retailer. Late last year, Amazon shocked customers with the announcement it would stop accepting Visa cards in January. Amazon cited “high fees” for the decision to cut ties with Visa but reversed its decision just two days before the announced cutoff date.
When considering these current stories about Visa, we need to determine which news topics will have a long-term and ongoing effect on the company and its share price. While the future of buy now pay later and its long-term impact on revenues is unclear, Visa’s tight control and limited competition in the payment processing space is critical to the company’s recurring revenue model.
While current news stories, good or bad can sway our opinion about investing in a company, it’s good to analyze the fundamentals of the company and to see where it’s been in the past and in which direction it’s heading.
This article will focus on the long-term fundamentals of the company, which tend to give us a better picture of the company as a viable investment. I also analyze the value of the company versus the price and help you to determine if Visa is currently trading at a bargain price. I provide various situations which help estimate the company’s future returns. In closing, I will tell you my personal opinion about whether I’m interested in taking a position in this company and why.
Snapshot of the Company
A fast way for me to get an overall understanding of the condition of the business is to use the BTMA Stock Analyzer’s company rating score. Visa has high scores for 10 Year Price Per Share, ROE, Earnings per share, Ability to Recover from a Market Crash or Downturn, ROIC, and Gross Margin Percent. It has low scores for PEG Ratio. A low PEG Ratio score indicates that the company may not be experiencing high growth consistently over the past 5 years. In summary, these findings show us that V seems to have above average fundamentals since all but one of categories produce good scores.
Before jumping to conclusions, we’ll have to look closer into individual categories to see what’s going on.
BTMA Stock Analyzer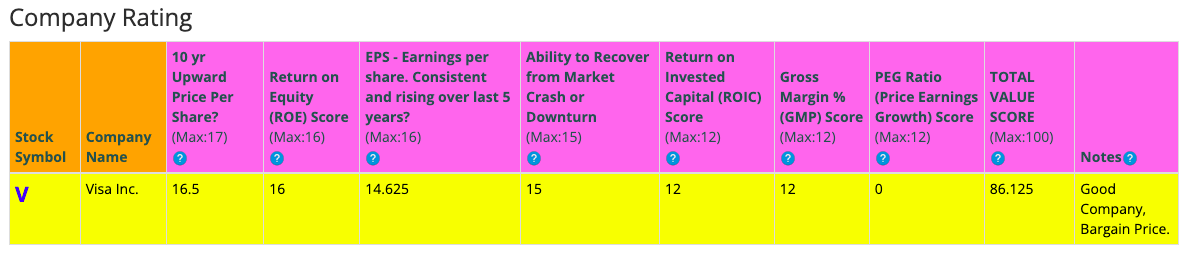
Fundamentals
Let’s examine the price per share history first. In the chart below, we can see that price per share has been mostly consistent at increasing over the last 10 years, with only one year where share price declined. Overall, share price average has grown by about 396.23% over the past 10 years or a Compound Annual Growth Rate of 19.48%. This is an impressive return.
BTMA Stock Analyzer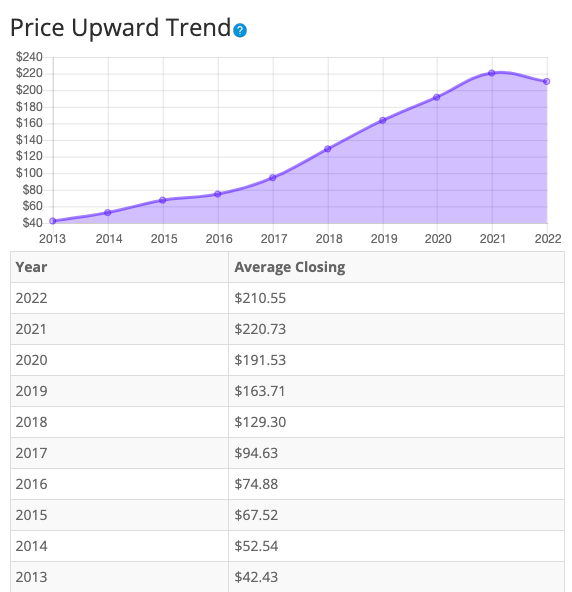
Earnings
Looking closer at earnings history, we see that earnings have consistently grown over the past 10 years, with only two years of earnings declines. After growing from 2012 to 2015, earnings fell modestly in 2016. Earnings grew from 2017 to 2019 before declining in 2020. Earnings grew again in 2021.
The two earnings dips in 2016 and 2020 coincide with significant decreases in cross-border payments. Those international transaction fees account for nearly 21% of Visa’s revenue and are disproportionally impacted when economic downturns emerge. In 2016, economic growth decelerated as a crash in oil prices and a slowdown in China’s economy hit manufacturing and emerging markets, and also caused spending on international travel to fall. In 2020, when COVID-19 lockdowns and international travel bans were implemented, revenue evaporated in an even more dramatic manner.
Consistent earnings make it easier to accurately estimate the future growth and value of the company. So, in this regard, Visa is a good example of a stock to accurately estimate future growth or current value.
BTMA Stock Analyzer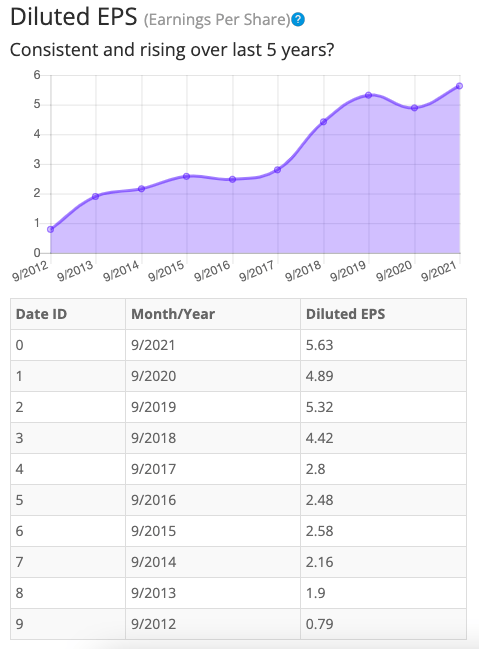
Since earnings and price per share don’t always give the whole picture, it’s good to look at other factors like the gross margins, return on equity, and return on invested capital.
Return on Equity
The return on equity has maintained impressive levels and has increased over all during the past five years. In 2018, ROE surged in 2018 and grew again in 2019. After dropping in 2021, ROE grew again in 2021. Five-year average ROE is above expectations at around 34.95%. For return on equity (ROE), I look for a 5-year average of 16% or more. So, Visa easily meet my requirements.
BTMA Stock Analyzer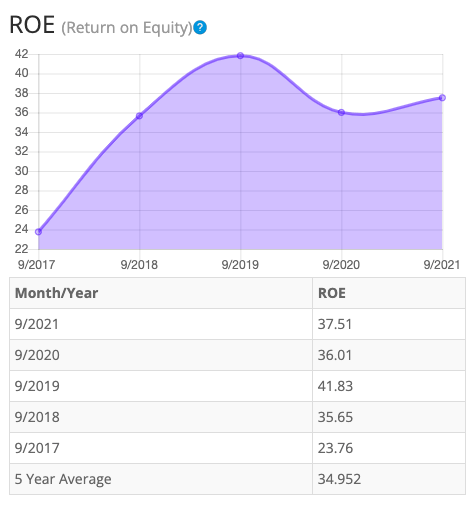
Let’s compare the ROE of this company to its industry. The average ROE of 79 Information Services companies is 17.51%.
Therefore, Visa‘s 5-year average of 34.95% and current ROE of 37.51 is well above average.
Return on Invested Capital
The return on invested capital has maintained satisfactory levels over the past 4 years, but has also been inconsistent. After rising in 2018 and 2019, ROIC dipped in 2020. ROIC ticked up marginally in 2021.Five-year average ROIC is above expectations at around 21.9%. For return on invested capital (ROIC), I also look for a 5-year average of 16% or more. So, Visa passes this test as well.
BTMA Stock Analyzer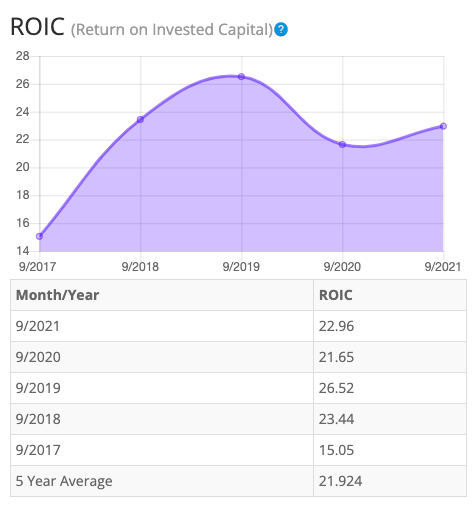
Gross Margin Percent
The gross margin percent (GMP) has mostly decreased over the last five years. GMP fell in 2018 and 2020, followed by small rebounds in 2019 and 2021. Even with the declines, overall gross margin percent is at very high levels. Five-year GMP is fantastic at around 80.84%! I typically look for companies with gross margin percent consistently above 30%. So, Visa has proven that it has the ability to maintain exceptional margins over a long period.
BTMA Stock Analyzer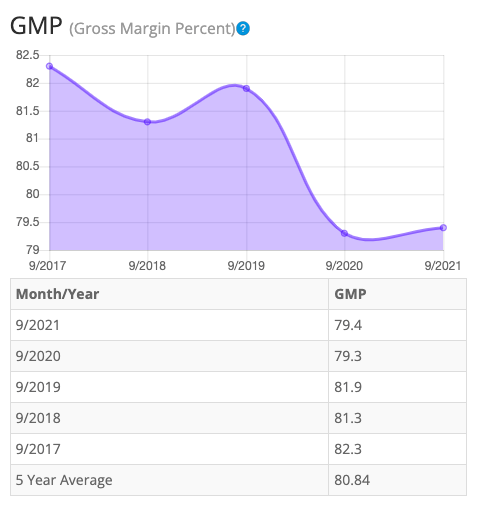
Looking at other fundamentals involving the balance sheet, we can see that the debt-to-equity is less than 1. This is a positive indicator, telling us that the company owns more than it owes.
Visa’s Current Ratio of 1.29 is satisfactory, indicating that it does has an adequate ability to use its assets to pay its short-term debt.
Ideally, we want to see a Current Ratio of more than 1, and Visa exceeds this amount.
According to the balance sheet, the company appears to be in good financial health. In the long term, the company has more than enough assets to cover its debts. In the short-term the company is generating enough cash flow, to fulfill its obligations.
The Price-Earnings Ratio of 30.4 indicates that Visa might be selling at a high price when comparing its PE Ratio to a long-term market average PE Ratio of 15. The 10-year and 5-year average PE Ratio of Visa has typically been between 34.9 and 36.8, so this indicates that it could be currently trading at a low price when comparing to its average historical PE Ratio range.
Visa currently pays a dividend of 0.70% (or 0.68% over the last 12 months).
BTMA Stock Analyzer
The Story Behind The Dividend
Morningstar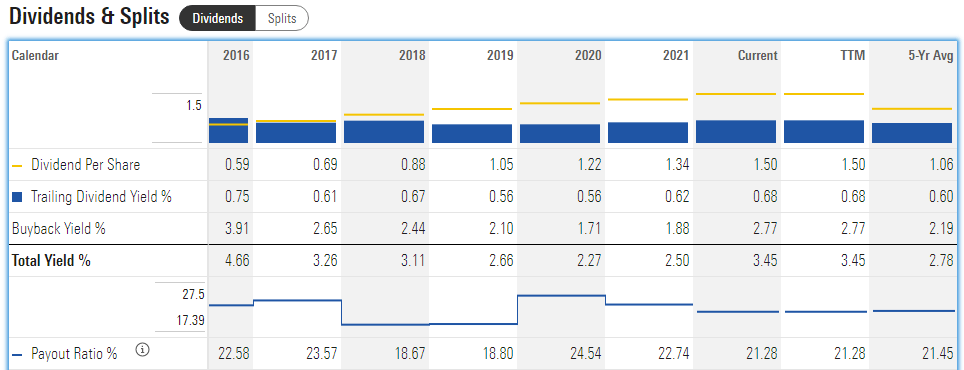
In regards to dividend history, I’m first interested in knowing if the payout ratio is sustainable. At this time, it’s around 21%, which means that there is still plenty of room to grow the dividend. Also notice that Visa has a regular history of buying back shares, which contributes to higher payout ratios.
If we look only at the dividend yield, we see a range of 0.56% to 0.75%. This stock pays out a small dividend. Dividend payouts have increased somewhat consistently over the 5 year period, therefore this stock may be desirable for some dividend investors.
If I were currently interested in buying Visa now for the dividend, I would be trying to buy when the dividend yield was highest relative to its past. From the chart below, we can see that the dividend yield for Visa typically stays within a narrow range, but it is near a somewhat high point relative to the past 10 years. Therefore, it’s a fairly good time to buy now if my priority is a better than average return through dividends.
Gurufocus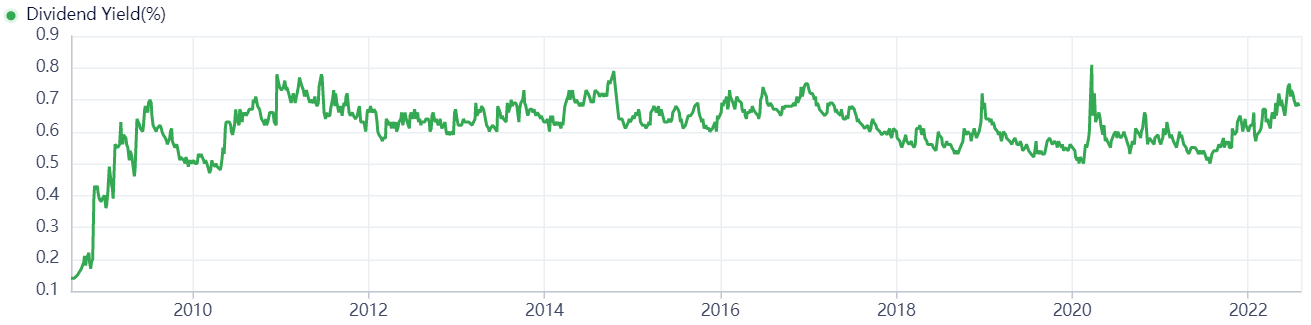
Overall, the dividend situation with Visa is better than average. On the positive side, the stock pays a consistent dividend and there is more room to grow the dividend. The dividend payouts have been increasing steadily over the years. Visa also aims to regularly return value back to shareholders through buy backs. Finally, the dividend yield is near a somewhat high level when compared with the past 10 years.
On the negative side, the dividend yield is small and hasn’t been fast-growing over the past 10 years.
This analysis wouldn’t be complete without considering the value of the company vs. share price.
Value Vs. Price
For valuation purposes, I will be using a conservative diluted EPS of $5.63. I’ve used various past averages of growth rates and PE Ratios to calculate different scenarios of valuation ranges from low to average values. The valuations compare growth rates of EPS, Book Value, and Total Equity.
In the table below, you can see the different scenarios, and in the chart, you will see vertical valuation lines that correspond to the table valuation ranges. The dots on the lines represent the current stock price. If the dot is towards the bottom of the valuation range, this would indicate that the stock is undervalued. If the dot is near the top of the valuation line, this would show an overvalued stock.
BTMA Wealth Builders Club BTMA Wealth Builders Club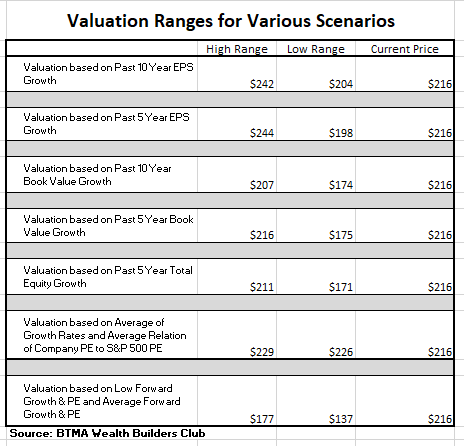
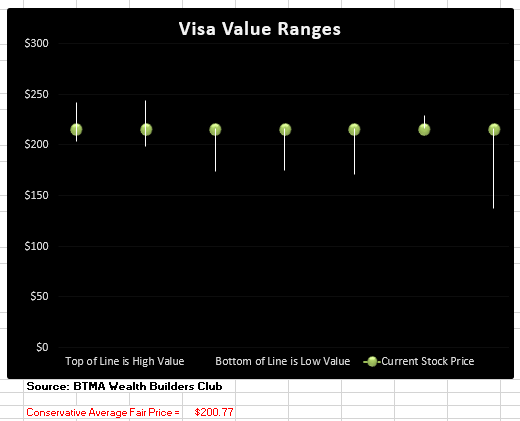
According to this valuation analysis, Visa is overpriced.
- If V continues with a growth average similar to its past 10 years earnings growth, then the stock is undervalued at this time.
- If V continues with a growth average similar to its past 5 years earnings growth, then the stock is undervalued at this time.
- If V continues with a growth average similar to its past 10 years book value growth, then the stock is overpriced at this time.
- If V continues with a growth average similar to its past 5 years book value growth, then the stock is overpriced at this time.
- If V continues with a growth average similar to its past 5 years total equity growth, then the stock is overpriced at this time.
- According to V’s typical PE ratio relation to the S&P 500’s PE Ratio, V is fairly priced.
- If V continues with a growth average as forecasted by analysts, then the stock is overpriced.
This analysis shows an average valuation of around $200 per share versus its current price of about $216, this would indicate that Visa, Inc. is overpriced.
Forward-Looking Conclusion
According to the facts, Visa is financially healthy in a long-term sense in having enough equity as compared with debt, and in the short-term because the current ratio indicates that it has enough cash to cover current liabilities.
Other fundamentals are impressive and solid, including ROE, ROIC, Gross Margins and EPS.
The dividend situation is better than average as the company pays a small, but consistent dividend with payouts that have been steadily increasing over the past 5 years.
Lastly, my valuation analysis shows that the stock is currently overpriced.
Now, let’s see how Visa has performed against the general US stock market benchmark (S&P 500) over the past 10 years. We can see from the chart below that Visa has easily outperformed the general market. Visa has proven that it is a good long-term investment if you want to achieve better than average returns that are also consistent.
Morningstar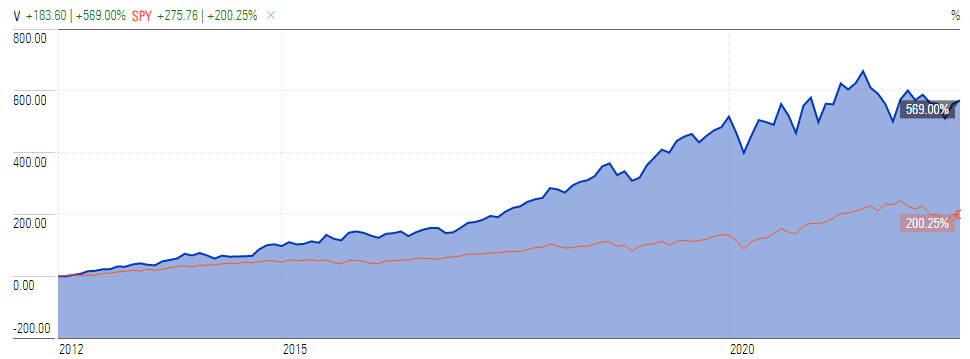
Predicted Growth
Over the next five years, the analysts that follow this company are expecting it to grow earnings at an average annual rate of 16.7%. This year, analysts are forecasting earnings increase of 24.7% over last year. Analysts expect earnings growth next year of 13.4% over this year’s forecasted earnings (Source: Forecast Earnings Growth)
If you invest today, with analysts’ forecasts, you might expect about 16.7% growth per year. Plus, we’ll add the current 0.70% forward dividend. This brings the annual return to around 17.40%.
Here is an alternative scenario based on V’s past earnings growth. During the past 10 and 5-year periods, the average EPS growth rate was about 21.7% and 14.9%, respectively. Plus, the average 5-year dividend yield was about 0.60%. So, we’re at a total return of 22.3 % to 15.5%.
But when considering cash flow growth over the past 10 and 5 years, the growth has been 12.10% and 10.9%, respectively. Plus, the average 5-year dividend yield would give us a total return of 12.7% to 11.5%. Therefore, when considering an average of all these scenarios, our annual return could likely be around 15%-16%.
If considering actual past results of Visa, which includes affected share prices, and long-term dividend yields, the story is a bit different. Here are the actual 10 and 5-year return results.
_______________
10 Year Return Results if Invested in V:
Initial Investment Date: 8/9/2012
End Date: 8/9/2022
Cost per Share: $32.79
End Date Price: $213.32
Total Dividends Received: $7.92
Total Return: 574.72%
Compound Annualized Growth Rate: 21%
_______________
5 Year Return Results if Invested in V:
Initial Investment Date: 8/9/2017
End Date: 8/9/2022
Cost per Share: $101.28
End Date Price: $213.32
Total Dividends Received: $5.6
Total Return: 116.15%
Compound Annualized Growth Rate: 17%
_______________
From these scenarios, we have produced results from 17% to 21%. I feel that if you’re a long-term patient investor and believer in Visa, and its existing payment processing service (which is the largest in the world), you could expect Visa to provide you with around at least 15% annual return for most long-term holds with more significant returns of 20%+ the longer you hold it as the dividend continues to grow.
As a comparison, the S&P 500’s average return from 1928 – 2014 is about 10%. So, in a typical scenario with V, you could expect to earn a higher return than the market average, with less risk than most other individual companies since Visa is such a stable powerhouse.
For me, the choice is certain. I would take an objective look at this company and realize that Visa, Inc. is a chance to own an exceptional and dominant business, with a large moat. It’s almost as good as it gets, in terms of an all-around solid company that has relatively low risk for its long-term growth potential.
I’m confident enough about Visa to put it in Warren Buffett’s category of a “wonderful company” that I’d be willing to buy at a fair price, rather than waiting for a bottom-bargain price. And to get the most out of this stock, it would be a long-term hold with no foreseeable plans to sell, so that I could capitalize on the compounding effect of this company’s earnings and dividend growth.
Be the first to comment