

Justin Sullivan
Introduction
Visa (NYSE:V) is one of the largest credit card processing companies in the world. As new industry competitors with innovation continue, V is reasonably above average for stock price uptrend potential. Its future performance is underwhelming compared to its competition.
Fundamental not as strong as competitors
Ratios
The current and quick ratios for Visa have been quite mixed over the last five years. There is no growing trend here, unlike in other similar stocks of the same category.
|
Unnamed: 0 |
2018 |
2019 |
2020 |
2021 |
2022 |
|
Period |
FY |
FY |
FY |
FY |
FY |
|
Current ratio |
1.611 |
1.563 |
1.905 |
1.754 |
1.448 |
|
Quick ratio |
1.283 |
1.242 |
1.580 |
1.413 |
1.078 |
|
Cash ratio |
0.722 |
0.584 |
1.123 |
1.048 |
0.752 |
|
Days of sales outstanding |
49.413 |
72.914 |
48.152 |
56.419 |
49.215 |
Source: Financial Modelling Prep
Growth
As in the ratios section, Visa’s stock price has been reasonably flat, with weak revenue growth. It is a different story when this year proves to be the strongest for this stock.
|
Unnamed: 0 |
2018 |
2019 |
2020 |
2021 |
2022 |
|
Period |
FY |
FY |
FY |
FY |
FY |
|
Revenue growth |
0.123 |
0.115 |
-0.049 |
0.103 |
0.216 |
|
Gross profit growth |
0.109 |
0.123 |
-0.079 |
0.104 |
0.232 |
|
EPS growth |
0.582 |
0.201 |
-0.079 |
0.149 |
0.247 |
Source: Financial Modelling Prep
Data
Despite previous years, Visa had a reasonably strong year in 2022. Unlike most other stocks, a simple moving average of 20 days of performance is average compared to different stock prices. The positive highlight is how the SMA 50 and 200 returns were positive.
|
Unnamed: 0 |
Values |
|
SMA20 |
9.05% |
|
SMA50 |
7.23% |
|
SMA200 |
0.29% |
Source: FinViz
Enterprise
Unfortunately for a Visa, the most robust year was in 2021, while the 2nd strongest year for the stock price was this year. Last year’s market capitalization peaked but is slightly stronger than in 2018 to 2020.
|
Unnamed: 0 |
2018 |
2019 |
2020 |
2021 |
2022 |
|
Symbol |
V |
V |
V |
V |
V |
|
Stock price |
132.760 |
179.250 |
181.710 |
211.770 |
190.710 |
|
Number of shares |
2.239 B |
2.189 B |
2.140 B |
2.130 B |
2.130 B |
|
Market capitalization |
297.290 B |
392.432 B |
388.914 B |
451.134 B |
406.270 B |
|
Enterprise value |
305.758 B |
401.323 B |
396.695 B |
455.624 B |
413.031 B |
Source: Financial Modelling Prep
Estimate
For guidance, estimates show decent growth in the dividend while earning price ratio is manageable. EBITDA has steadily grown the same as well as net profit.
|
YEARLY ESTIMATES |
2022 |
2023 |
2024 |
2025 |
2026 |
|
Revenue |
– |
32,023 |
35,892 |
40,042 |
41,296 |
|
Dividend |
1.47 |
1.73 |
1.95 |
2.14 |
2.30 |
|
Dividend Yield (in %) |
0.71 % |
0.83 % |
0.94 % |
1.03 % |
1.10 % |
|
EPS |
– |
8.32 |
9.67 |
11.21 |
12.30 |
|
P/E Ratio |
27.44 |
25.03 |
21.54 |
18.58 |
16.93 |
|
EBIT |
– |
21,729 |
24,625 |
27,883 |
30,036 |
|
EBITDA |
20,485 |
22,609 |
25,295 |
28,831 |
29,547 |
|
Net Profit |
– |
17,333 |
19,657 |
22,284 |
22,756 |
Source: BusinessInsider
Technical Analysis shows a downward mean reverting action.
Fibonacci
Visa shows a lot of volatility in its price, with the latest price attempting to trend up. Based on the recent pricing patterns since March, the latest price trend is expected to turn into a downtrend. Overall, you can see the general decline in price despite volatility. The trend line of the Fibonacci may start to decline as momentum in price gets more robust in each pricing wave with volatility.
Fibonacci Visa (custom platform )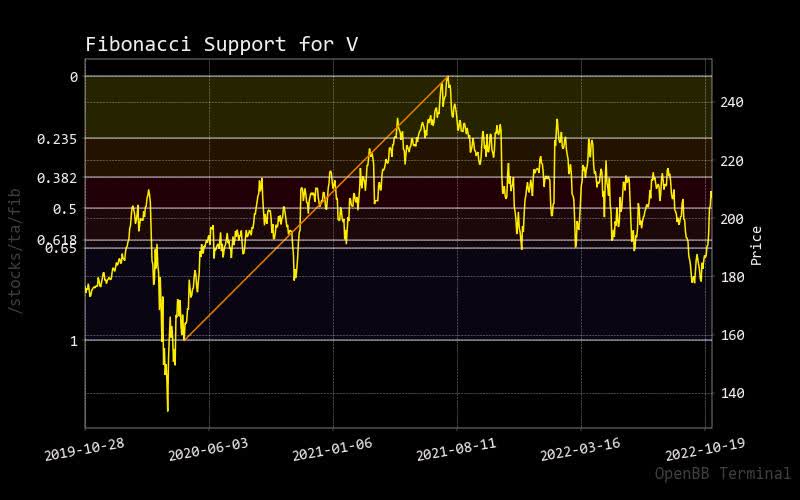
MACD
As the most recent price action of Visa has crossed the zero line, this is expected to be a missed opportunity for the most recent uptrend. As explained in the RSI, one can expect the stock price for Visa to drop back into its usual mean reverting trend since the stock price peak of last year.
MACD Visa (customer mastercard )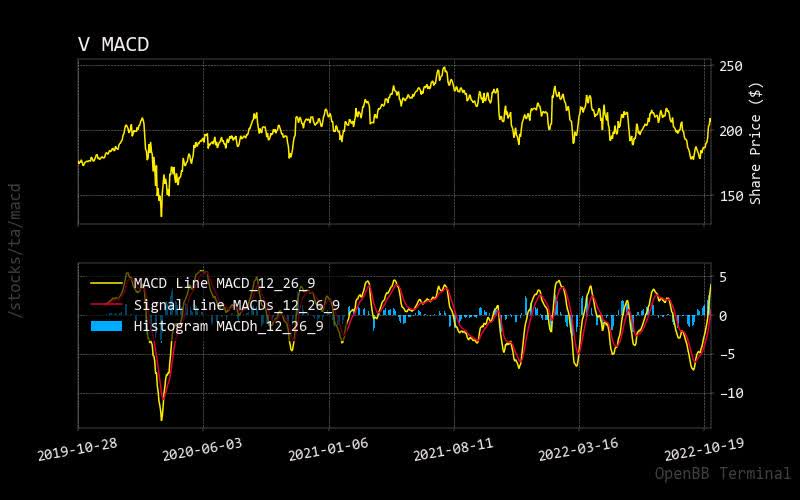
RSI
Based on recent pricing trends with volatile waves, it could be expected that the price will decline as, most recently, the Visa stock price has exceeded the overbought market condition.
RSI Visa (custom platform)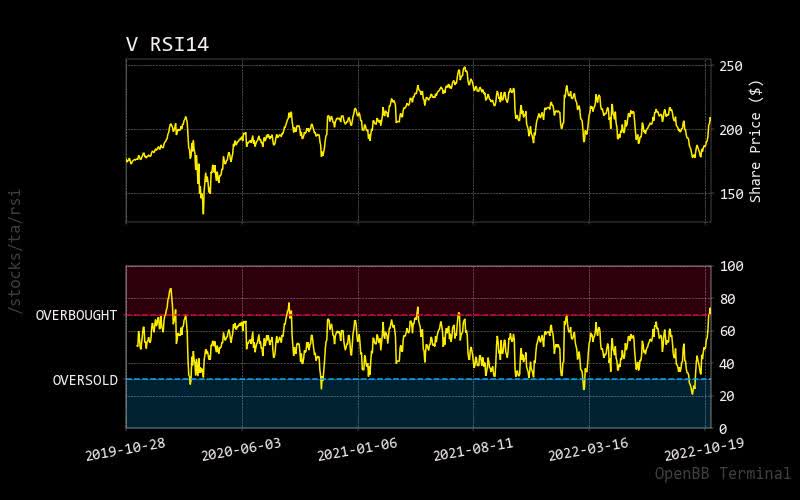
Monte Carlo
Monte Carlo simulation shows more upward trending prediction paths, representing higher stock price expectations. Meanwhile, the normalized distribution chart also indicates a higher probability for Visa stock price in the coming weeks. This is based on the historical momentum of the most recent upward-trending stock price.
Montecarlo Visa (custom platform)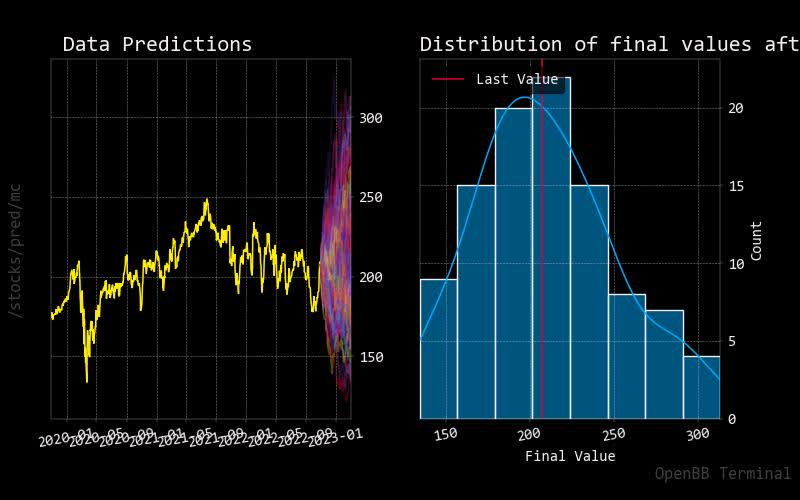
Regression
The forecasted 30-day regression red line shows that the Visa stock price appears to go flat, which could be reasonable based on the current overbought RSI market condition.
Regression Visa (custom platform)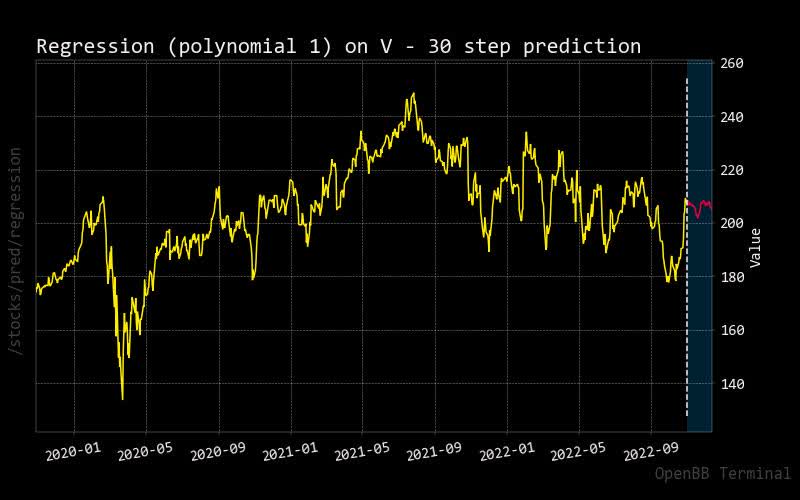
Insider has more selling activity versus competition.
Risk is muted but beware of other market analyst calls
Insider Stats
For some reason, certain executives decided to sell this stock, but it is not high profile nor a high quantity number of shares, so it might not be a concern.
|
Unnamed: 0 |
X |
Filing Date |
Trading Date |
Ticker |
Insider |
Title |
Trade Type |
Price |
Quantity |
Owned |
Delta Own |
Value |
|
0 |
D |
2022-09-30 16:07:35 |
2022-09-29 |
V |
Kelly Alfred F Jr |
COB, CEO |
S – Sale+OE |
$180.00 |
-6,000 |
153,887 |
-4% |
-$1,080,000 |
|
1 |
D |
2022-09-01 16:14:58 |
2022-08-31 |
V |
Kelly Alfred F Jr |
COB, CEO |
S – Sale+OE |
$201.00 |
-9,000 |
153,887 |
-6% |
-$1,809,000 |
Recommendation
Just like insider trading activity which points to nothing but sales, also you will find market analysts pushing a sell recommendation with a few neutral ones. As explained in the RSI section, it could be described as the stock price hitting an overbought market condition.
|
Interval |
Recommendation |
BUY |
SELL |
NEUTRAL |
|
One month |
SELL |
2 |
15 |
9 |
|
One week |
SELL |
5 |
11 |
10 |
|
One day |
NEUTRAL |
8 |
9 |
9 |
Source: Trading View
Conclusion
When you compare Visa against its primary competitor Mastercard (MA), you can quickly see how Visa underperforms. From the deep analysis of Mastercard, one should consider it for its explosive dividend income potential. Visa seems to have an underperforming performance versus its competitor. Although the growth estimate shows some upward pricing momentum in the stock, it might be wise to look at other companies in the same financial services space. As a result, V gets a hold rating.
Be the first to comment