

Melpomenem
Thesis
My last article on mREIT stocks was published about a month ago. And in that article, I specifically focused on two of the leaders in the sector: AGNC Investment (AGNC) and Annaly Capital Management (NLY). The main thesis was that the rising inflation, rate hikes, and Russia/Ukraine war will all pressure the yield spread, which will consequently pressure mREIT profits and balance sheet.
Today, I want to extend that analysis to two smaller, but still sizable, mREIT players: Chimera Investment (NYSE:CIM) and New Residential Investment (NYSE:NRZ). This extended analysis is triggered by the following two developments since my last article:
- The yield curve has actually inverted since my last article. In my last article, I argued that to fight the ongoing inflation, the short-term interest rates will need to rise to somewhere between 3% and 4% and long-term rates won’t rise much above that either, resulting in an inversion. The inversion has occurred sooner than I thought as you can see from the chart below. The yield curve has inverted (again) since early-July. The last time we saw the inversion was in April. As I am typing these lines, the 10-year Treasury rate (3.01%) is below 1-year Treasury rate (3.19%), 2-year rate (3.23%), and 5-year rate (3.16%). Such inversion will have profound implications on mREIT players, especially the smaller ones such as NRZ and CIM, as we will discuss in the next section.
- JPMorgan Chase (JPM) recently reported its earnings. The numbers from this bellwether stock and especially its CEO Jamie Dimon’s comments really painted a dim picture for the financial sector. JPM’s earnings fell 28%, it has been building reserves for bad loans, and it decided to suspend buybacks. All of these are textbook signals for financial and credit tightening, and mREITs are the most sensitive to such tightening.
Finally, you will also see the nuances of these two smaller players compared to the sector leaders. In my view, NRZ is better (in relative terms) to weather the tightening thanks to its recent Caliber acquisition. The acquisition helps to diversify its profits and dampen its sensitivity to yield spread. In contrast, CIM is in a worse position given its less diversified revenue sources and smaller scale.
FRED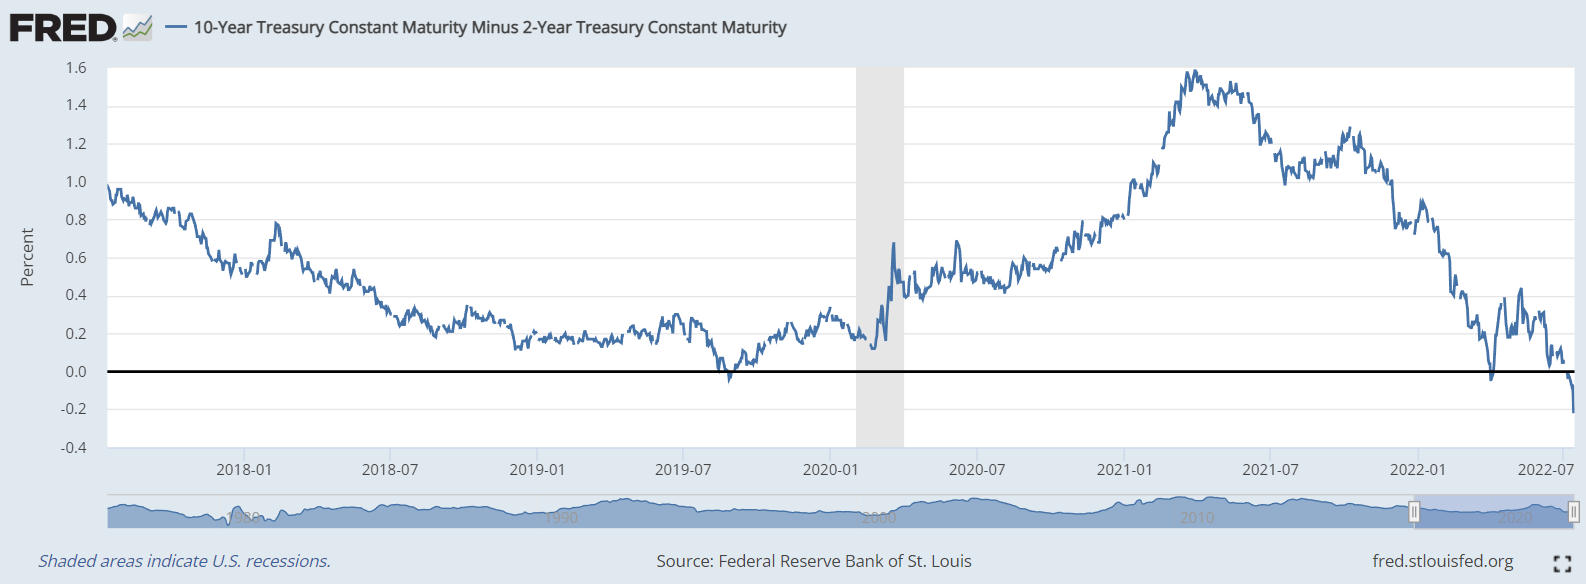
CIM and NRZ: inverted curve signals more pain ahead
The mREIT sector, together with all its leading stocks, has been under pressure since the Fed began credit tightening this year. As you can see from the following chart, the sector, represented by iShares Mortgage Real Estate Capped ETF (REM), has suffered a total loss of 15.7% YTD (i.e., dividends are accounted for). And CIM has suffered a loss of more than 34%. For the reasons just mentioned above, NRZ fared much better, only suffering a total loss of 1.5% YTD.
Seeking Alpha
Looking forward, I see the pressure to continue. The yield spread is the primary profit driver for mREIT stocks. The mREIT sector makes its profit primarily from the gap between long-term rates (which is what they get paid) and the short-term rates (which is what they pay to access their funds).
You can clearly see such an underlying profit driver from the chart below. Shortly after the COVID breakout in early 2020, you can see from the bottom panel that the short-term treasury rate dropped almost to 0% due to the Fed’s hard landing. Hence the mREIT players enjoyed free funds. And their operating profits not only recovered but recovered big time, reaching a peak level around July 2020. Then the music stopped around July 2021. The short borrowing rates began to climb. All told, in the past one year or so, short-term borrowing rates have risen from essentially zero to the current level above 3%, by more than 300 basis points. And you can see how their operating profits stayed flat or declined. Note that the sharp rise in NRZ’s profit since July 21 was largely due to the Caliber acquisition, not organic income growth.
Now the yield curve has inverted and, unfortunately, I do not see the inversion going away anytime soon. As aforementioned, to fight the ongoing inflation, my estimate is that the short-term interest rates will stay somewhere between 3% and 4%. On the other hand, I expect the long-term rates to rise no more than their current level either as argued in my earlier writings,
At a very fundamental level, in the long term, treasury bond rates cannot rise above long-term inflation or GDP growth. Our government has been relying on inflation and GDP expansion to inflate away and outgrowth its debt obligations for decades in the past. And it will (it will have to) continue doing so.
Seeking Alpha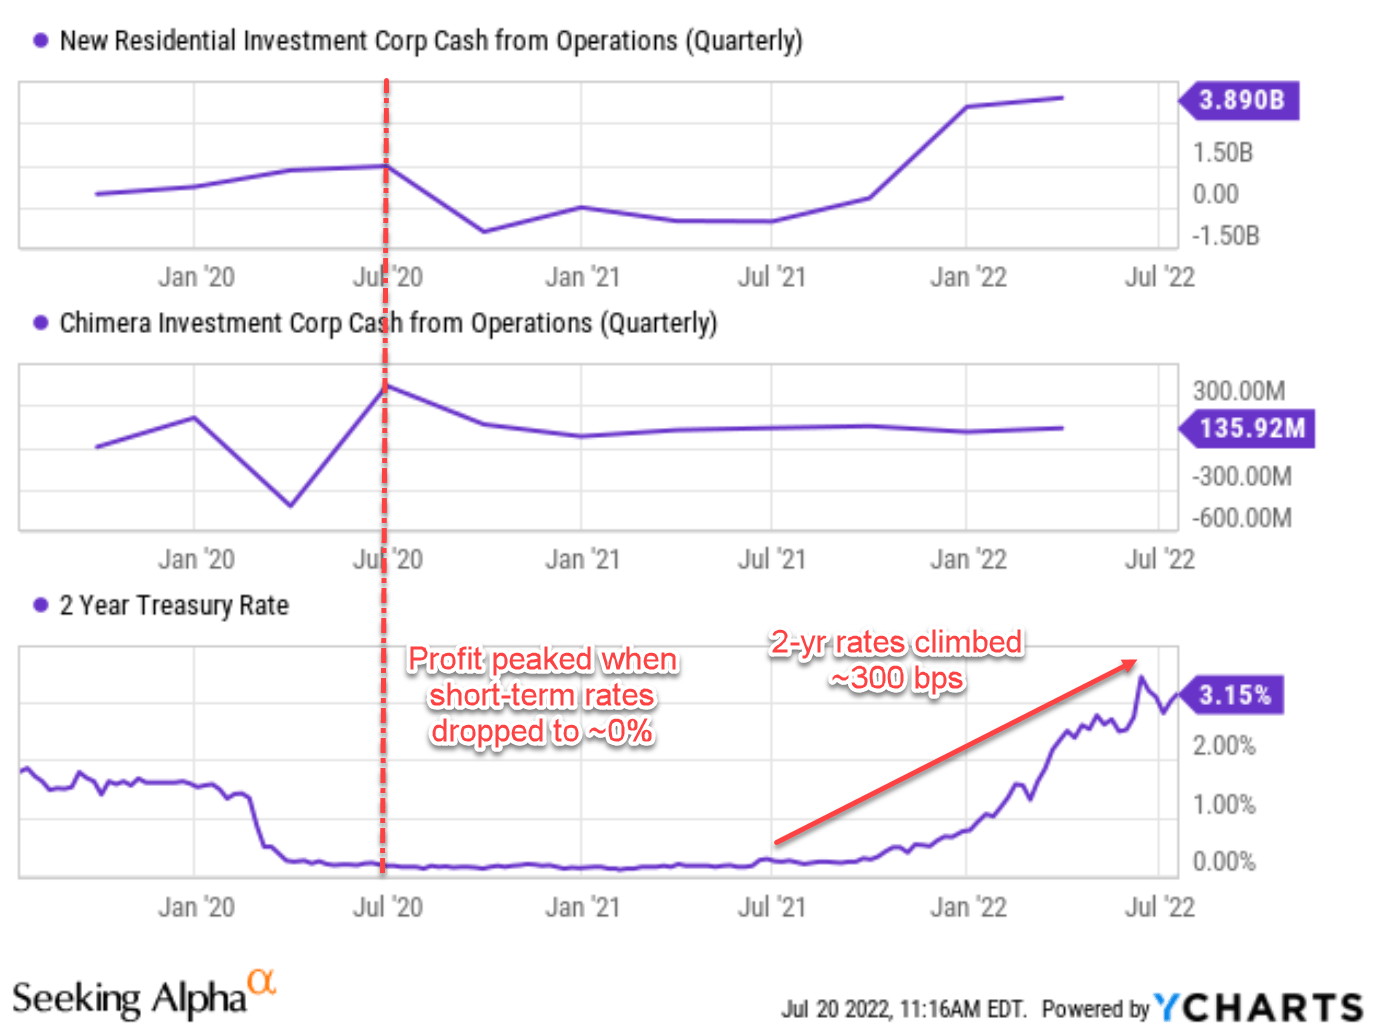
CIM and NRZ: not deleveraged enough
Sensing the pressure ahead, both CIM and NRZ have been deleveraging recently. As you can see from the top panel of the following chart below, NRZ reduced its leverage ratio from about 8.0x in late 2021 to the current level of 6.45x. But its current leverage ratio is still above the historical average of 5.26x by a good margin (about 23% in relative terms). Taking a broader view of 10 years, its current leverage is at a relatively high level.
The picture for CIM is very similar as you can see from the bottom panel. It too had started deleveraging in earnest in recent years. Its leverage has declined from a peak of ~7.4x to the lowest level of ~4x at the beginning of 2022. However, the leverage has inched up a bit since then and stands currently at a level of 4.57x. It is slightly below the historical average of 4.89x. But again, when taking a broader view of 10 years, I see its current leverage at a relatively high level.
Seeking Alpha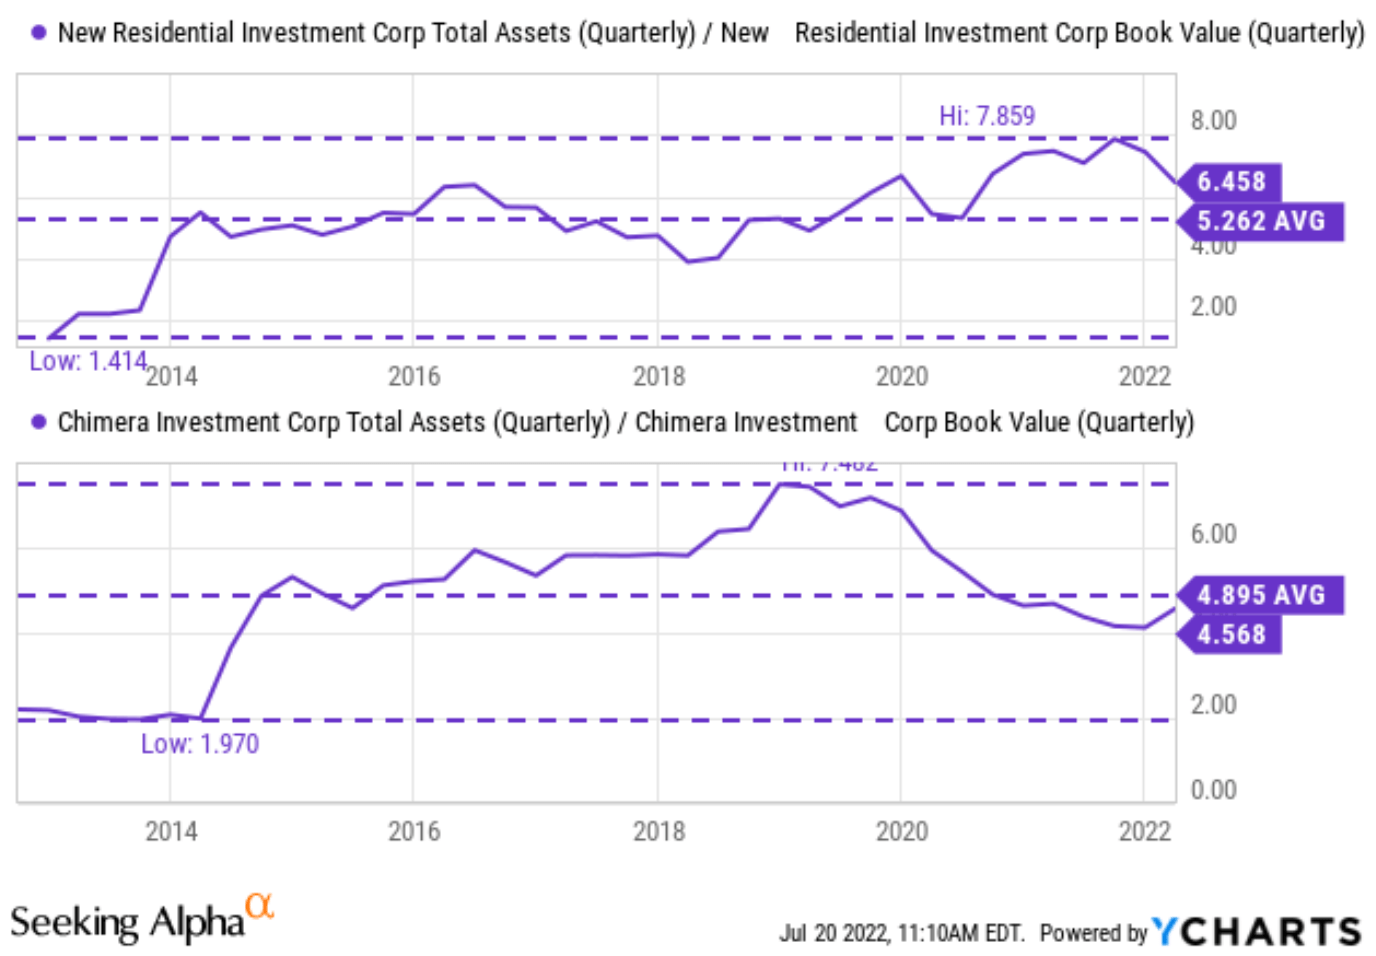
The next chart is probably more telling and concerning for CIM investors. The chart shows CIM’s dividend cushion ratio, a holistic consideration of its leverage, earnings, and dividend obligation as detailed in my earlier article here. A cushion ratio of 1.0x is considered a threshold for a safe dividend. As you can see, CIM’s cushion ratio has been in constant decline since 2016. Its cushion currently hovers around 0.57x, about 40% below the threshold. Approximately, this means CIM can only absorb financial hiccups for about half a year. If the difficulty lasts longer than that, its dividends will be in jeopardy.
Author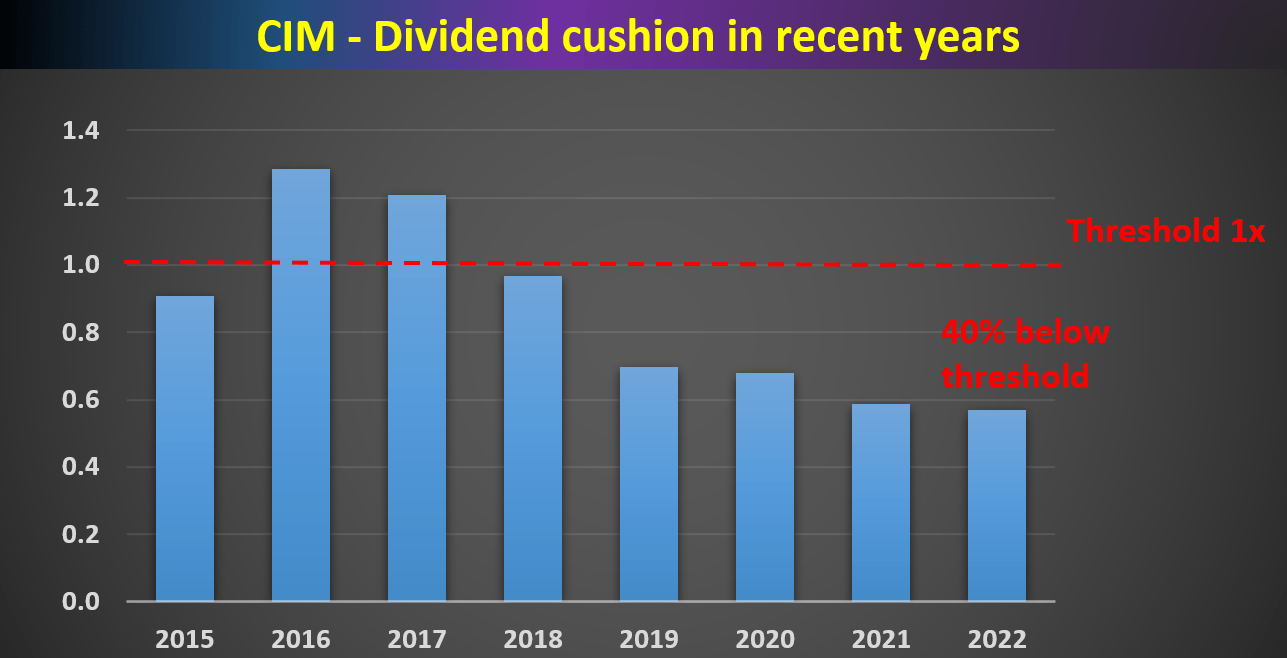
CIM and NRZ: valuation discounted, but not enough
The price corrections mentioned above have compressed their valuation, especially in the case of CIM. However, my view is that the valuation discounts are not enough to compensate for the risks ahead.
In terms of dividend yields, NRZ is actually yielding below its historical average level as you can see from the top panel of the chart below. NRZ’s historical yield fluctuated from as low as 4.4% to as high as 60% (which is obviously an outlier data point and should be ignored). Its long-term historical average is 11.8%. Currently, it is yielding 9.9%, almost 17% below its historical average.
CIM’s dividend yield is slightly above its historical average, but only by a small margin. Its yield fluctuated from as low as 7.5% to above 30% (again an outlier data point) in the past decade, with a long-term historical average of 12.19%. Currently, it is yielding 14.1%, about 15% above its historical average.
Seeking Alpha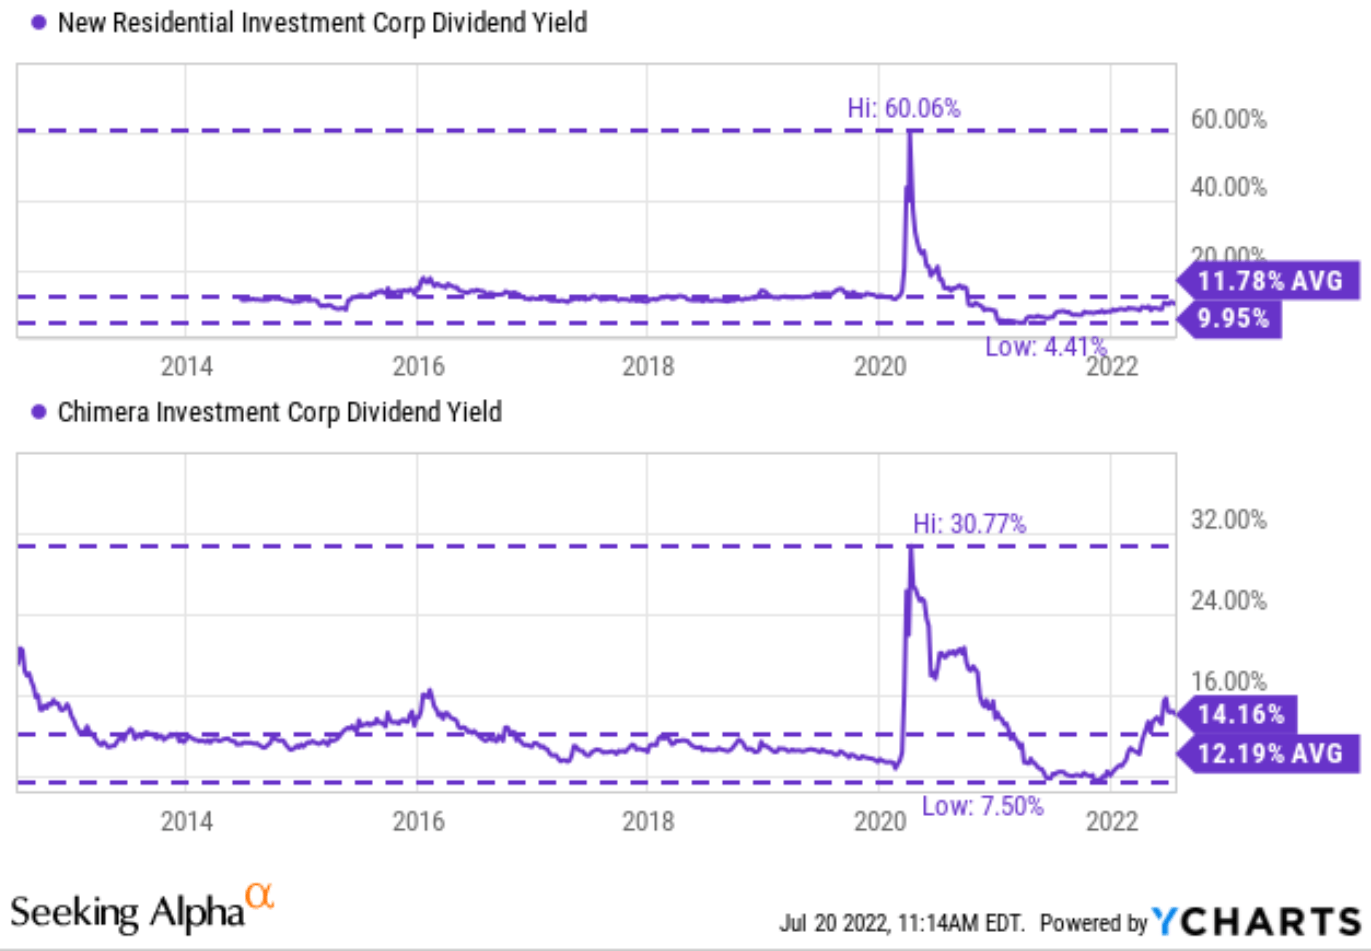
The valuation discount is larger in terms of price to book multiples as you can see from the next chart. NRZ has been priced at about 1.09x of its book value on average. And currently, it is at 0.79x times, about a 28% discount from its historical average. CIM has been historically priced at an average of 0.88x of its tangible book value. Currently, it is priced at 0.66x, a 25% discount from the historical average. As just mentioned, such discounts are insufficient to overcome the risks in my view for two reasons.
First, the large volatility in these stocks. As you can see, both stocks have suffered extreme valuation volatilities in the past (again, the fundamental reason is their sensitivity to the macroeconomic conditions). NRZ price to book ratio fluctuated almost 10x in the past decade, from 0.28x to 2.25x. And CIM by more than 3x from 0.36x to 1.22x. In the face of such large volatility, their current 25% to 28% discount is probably just noise and a true margin of safety.
Seeking Alpha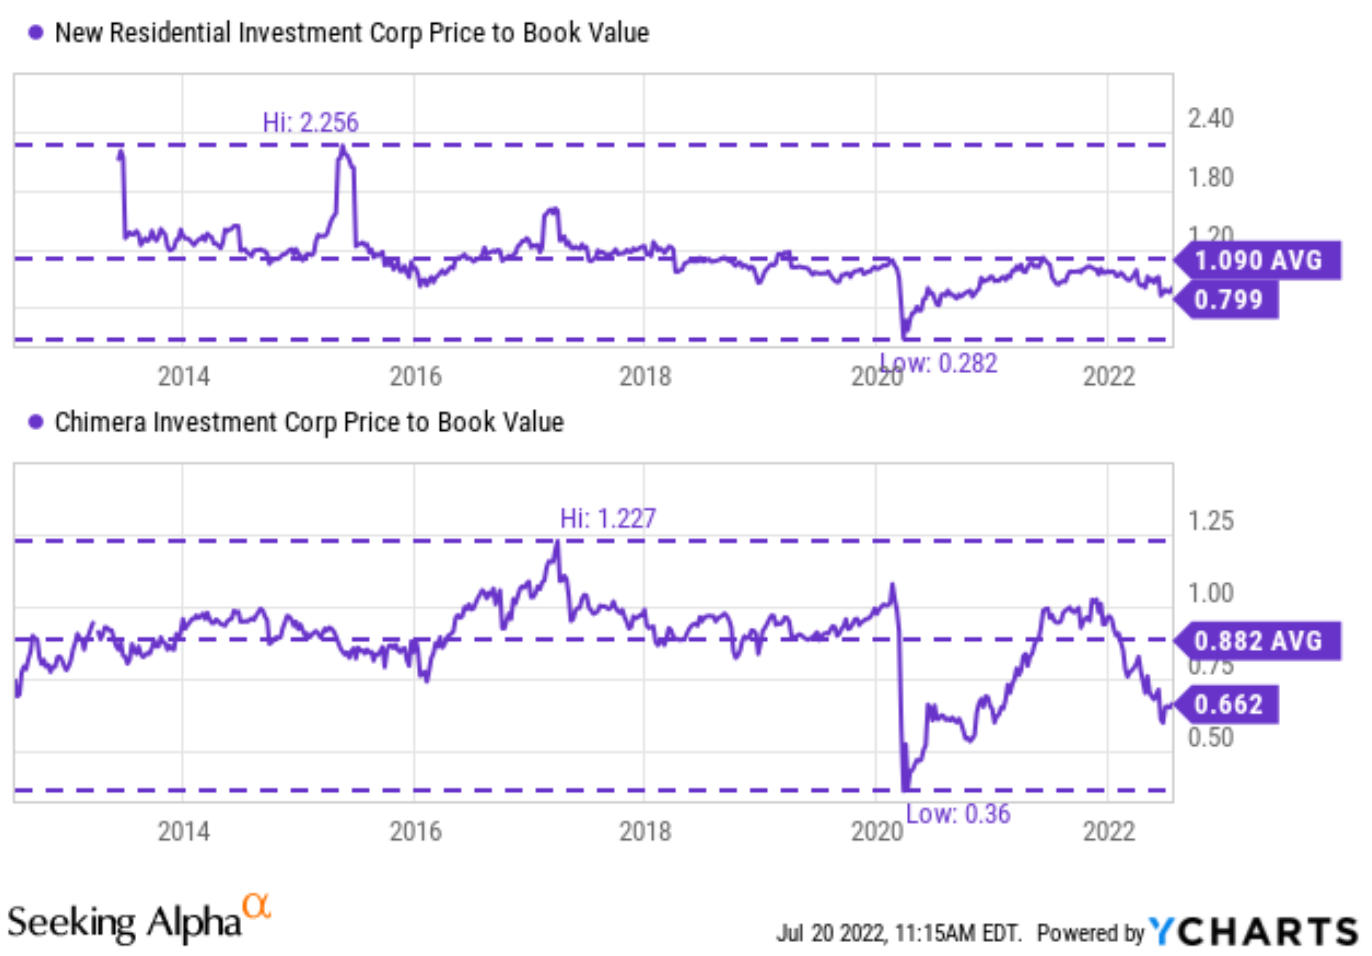
Secondly, their discounts of 25% to 28% may not be sufficient to even overcome their loss of book value. Both CIM and NRZ have been suffering book value loss in recent years as you can see from the next chart. NRZ has lost more than 13% of its book value over the past 3 years. And its current book value has not recovered to the pre-pandemic level even with the Caliber acquisition. Similarly, CIM has lost more than 16% of its book value in the past 3 years. As argued in my earlier article:
Book value loss hurts mREIT investors twice. First, a stock price decline (even if the valuation stays stable). And second, book value is the farm that mREITs rely on to harvest their profit. As the book value shrinks, the farm gets smaller. Looking forward, inflation and an inverted yield curve will keep hurting the demand for new mortgages and at the same increasing the odds of defaults – and both will cause further loss of book value.
Seeking Alpha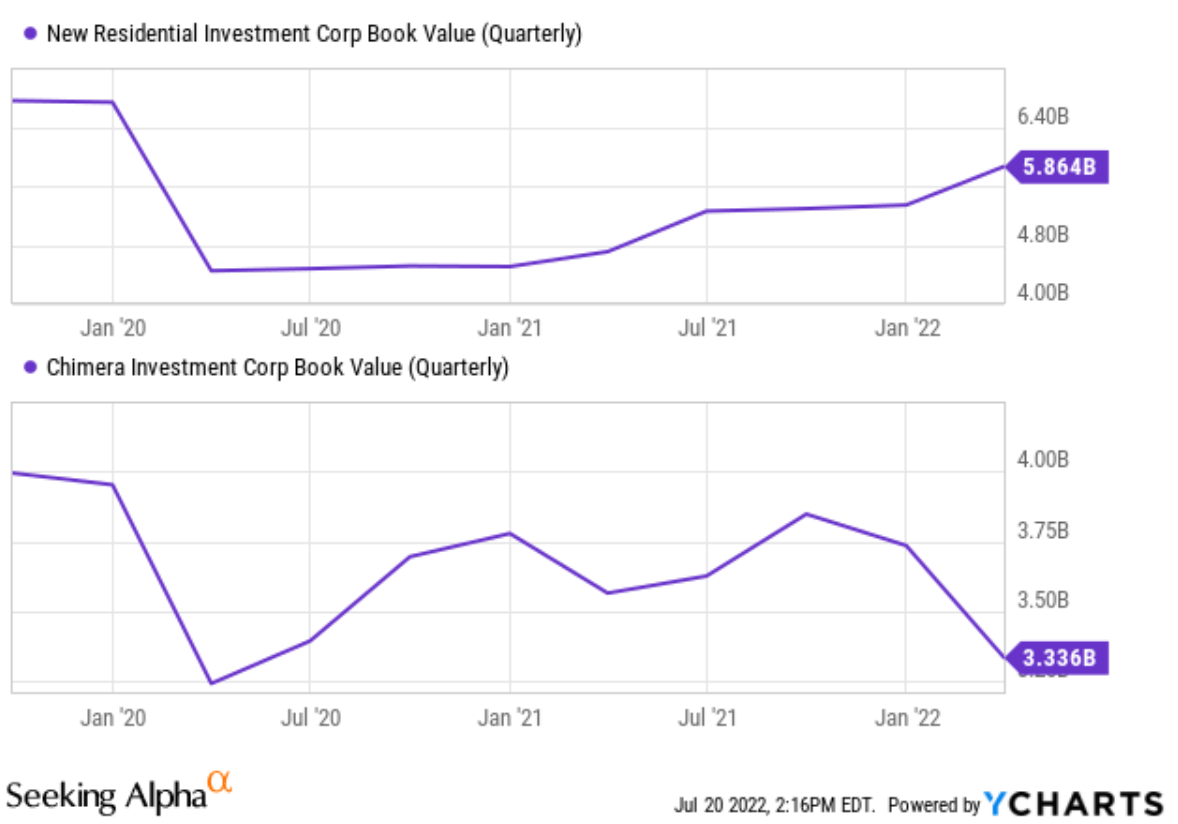
Final thoughts and other risks
Many investors, especially income-oriented investors, are drawn to mREIT stocks. Indeed, recent price corrections have brought their dividend yields to attractive levels. NRZ currently yields close to 10% and CIM more than 14%. However, we want to caution investors against such seemingly high yields, which may not be enough to compensate for the risks of valuation contraction and loss of book value. In the case of NRZ, its yield is actually below its historical average. In the case of CIM, there is a good chance that it may not be able to sustain its current payout given the low cushion ratio of 0.57x.
Besides the yield curve inversion, there are other unfolding uncertainties for CIM and NRZ (and also the overall mREIT sector too). These risks include the Russia/Ukraine situation, inflation, et al. The following comment from JPM CEO Jamie Dimon sums them up nicely (the emphases were added by me):
… geopolitical tension, high inflation, waning consumer confidence, the uncertainty about how high rates have to go and the never-before-seen quantitative tightening and their effects on global liquidity, combined with the war in Ukraine and its harmful effect on global energy and food prices are very likely to have negative consequences on the global economy sometime down the road,”
Be the first to comment