

mi-viri
Investment Summary
The investment case looks to be turning for Viemed Healthcare, Inc. (NASDAQ:VMD) following its latest set of numbers. In our last coverage on VMD, we noted the tight growth percentages recorded in its previous earnings. These trends continued in Q3 and it clipped a 40% YoY decline in quarterly earnings to $0.03 per share.
However, we’d note several growth initiatives that dragged on profitability down the P&L this quarter, but will be realized in periods to come.
VMD has grown its employee base to 722 underscored by a large growth in sales rep headcount. It hired another 52 reps in September and converted 4 existing employees to sales reps. From the c.44 rep headcount end of last year and estimated c.80 in May it’s not unlikely it has a number of ~100 [give or take due to turnover, retention, etc.].
Exhibit 1. VMD 2-year weekly price evolution
Data: Updata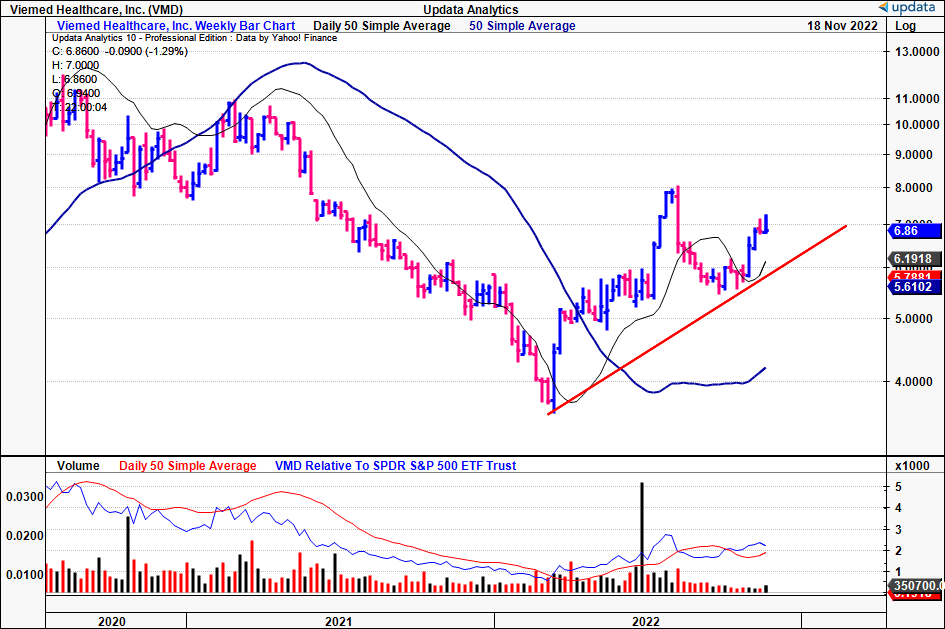
We see sales and EPS growth picking up into the coming periods [quarterly, annual] from the increase in rep productivity and believe this will extend the stock’s latest rally [seen above, from its September lows]. Technical studies indicate a probability of this also. Net-net we revise our rating to a buy and see price range of $10.65-$12.65.
VMD Q3 earnings breakdown
Speaking of the numbers, management remain focused on growing the core business. Looking ahead, it says 80% of VMD’s pipeline is dedicated at growing core operations, and 20% aimed at being strategic with technology [including M&A].
Q3 revenue growth of 29% YoY was again strong with $35.8mm booked for the quarter. Growth was underlined by favourable product mix. Notably durable medical equipment (“DME”) sales increased 63% YoY, along with equipment and supply sales of 51%.
The split to ventilators, non-invasive and invasive was ~67% of turnover, down from 78% this time last year. To us this illustrates organic growth across active patients and the product portfolio. As we previously noted, VMD’s gross and operating margins remain a key focus. Both came in tighter this quarter at 59.17% and 4.11% respectively. Yet, both are matched by a 44% gain in YTD net CFFO [comparing the 9 months to September 30 2022 versus the same period in 2021, see: VMD 10-Q, pp .7].
Hence, whilst the stock now trades at a 57% premium to its 5-year average at 36x trailing earnings, there is greater cash flow backing the valuation.
Operational highlights from the quarter for us are as follows:
1). Tighter operating margins stemmed from increased sales rep headcount. As mentioned, VMD hired another 52 staff in September and converted 4 existing employees [a 34% YoY increase]. In its earnings call from May, it said “…we’ve got probably about 80 total sales reps…” and so a number of ~100 or so is what we estimate VMD could have in the field.
Adding to the sales rep headcount isn’t always as successful as intended. The quality of reps is one factor that impacts output heavily. It’s worth noting that VMD gives each rep ~6 months to ramp up in productivity on average. We note the ramp up in productivity this quarter. It added 8 new geographic areas, and is on track to meeting its goal of adding 25 new areas by the year’s end.
Alas, the investment in staffing could be a key differentiator in the current environment. We agree with data from the Kaufman Hall national flash report for October 2022, that says labor shortages are a key driver impacting stay rates and operating margins for service providers. This is coupled with a 22% increase in total labour expense since FY19 [comparing the 10 months to October in 2022 versus 2019].
Hence, the 34% growth in sales reps pulled through to a 23% growth in net areas, resulting in an operating leverage of 1.47x. This is a good springboard for revenue growth into the coming quarters we estimate.
2). The 63% YoY growth in the DME division was driven by positive airway pressure (“PAP”) and oxygen-related sales. The upside is underpinned by the drift from ventilator sales that has prompted organic expansion over to PAP and O2 volumes. This is a good sign for revenue distribution looking ahead. The growth percentages are also noteworthy.
Valuation and conclusion
In order to gauge price visibility, we’ve opted to combine fundamental and technical data. You’ll see the following series of charts and tables will do just that.
Consensus values VMD at 37.5x forward earnings and we note it currently trades at 10.8x trailing EBITDA, a 13% discount to its 5-year average. The consensus S&P 500 forward P/E estimate for FY22 is 18.18x, thus, the market expects VMD to outpace the benchmark.
Previously, we priced the stock in a range of $6.12-$8.46 or 34x P/E. You’ll see below we’ve estimated a 58% and 38% YoY decline in EPS in the next 2 reporting periods for VMD [Exhibit 2, Exhibit 3].
These are expected from previous announcements; hence, we believe the market has adequately priced these downsides in to date.
Looking ahead, we’ve revised our EPS growth assumptions upwards. We now see 96% earnings upside in FY23 and another 47-50% the year after [Exhibit 3]. This is based on assumptions around the company’s increased sales rep headcount, that will pull through strongly in FY23 given the sensitivities shown this YTD in our opinion.
We don’t feel the market has fully reflected this growth potential in the VMD share price.
Exhibit 2. Revised VMD EPS growth assumptions. We see strong upside of 96% into FY23.
Data: HB Insights Estimates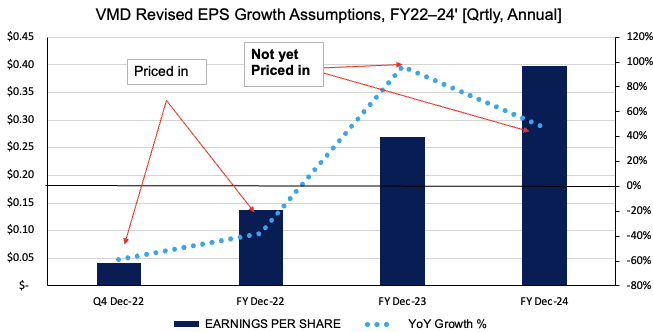
Exhibit 3. Forward EPS estimates [numbers] with growth percentages. We don’t believe FY23 and FY24 growth potential is reflected in the share price.
Data: HB Insights Estimates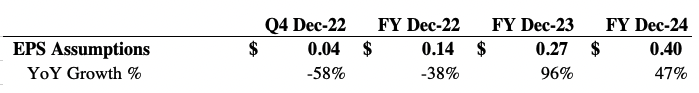
Rolling our FY23 EPS growth assumptions forward, we see fundamental value in the stock to $10.65 [Exhibit 4]. Hence it should trade up at ~39.5x earnings in our opinion.
This is backed well by technical findings [Exhibit 5, Exhibit 6] with additional upside targets as high as $12.65 on a weekly time frame.
As seen in the point and figure chart in Exhibit 5, these technical price targets have served us well to date, with the last 2 targets of $6.75 and $6.85 taken out very recently.
Hence, we revise our price range up to $10.65-$12.65, around 37% upside from the current market price.
Exhibit 4. Fair value in VMD up to ~39.5x forward P/E or ~$10.65 from EPS growth estimates.
Note: Fair forward price-earnings multiple calculated as 1/fair cost of equity. This is known as the ‘steady state’ P/E. For more and literature see: [M. Mauboussin, D. Callahan, (2014): What Does a Price-Earnings Multiple Mean?; An Analytical Bridge between P/Es and Solid Economics, Credit Suisse Global Financial Strategies, January 29 2014] (Data: HB Insights Estimates)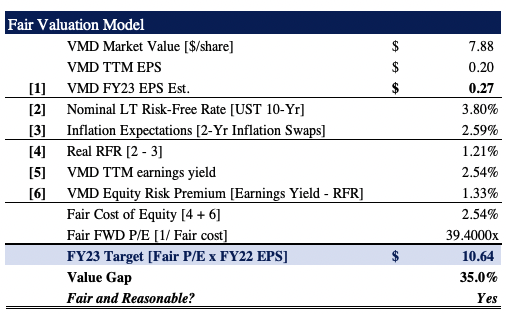
Exhibit 5. Weekly time-frame on point and figure chart suggests price targets to $12.65 with the latest price action.
Data: Updata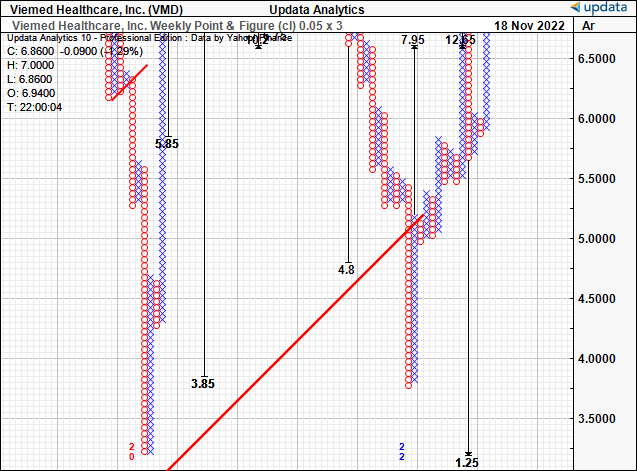
Exhibit 6. These technical price targets have provided good confidence about future estimates from market data to date [daily time frame shown below].
Data: Updata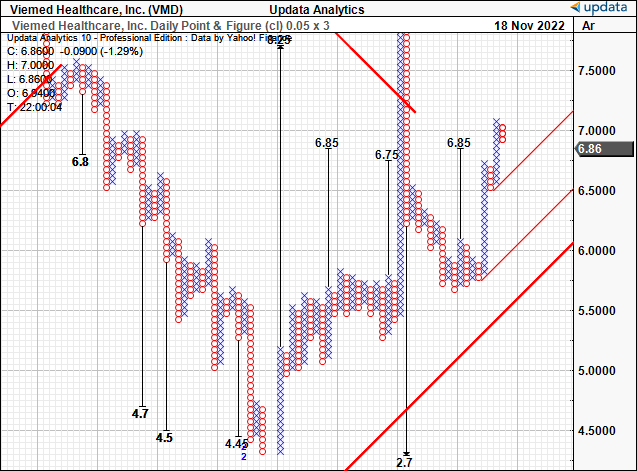
Net-net, we change our rating on VMD to a buy and see value suggest price objectives in the range of $10.65-$12.65 or roughly 40x forward P/E at the lower bound.
Key downside risks to the investment thesis include:
- Broad market volatility, with a large correction in the S&P 500. This will likely cause a larger selloff in VMD and push its share price lower.
- Poor growth and earnings performance in the next 2 reports that are below what consensus and management is predicting.
- Slowdown in the global COPD treatment market – currently projected at CAGR 4.4% into FY31.
- Macroeconomic risks that are a threat to the earnings of all companies looking ahead.
These risks should be heavily considered by investors in the investment debate.
Be the first to comment