

hallojulie
This exchange-traded fund (“ETF”) article series aims at evaluating products regarding the relative past performance of their strategies and quality metrics of their current portfolios. Holdings and data change over time, so updated reviews are posted when necessary.
VFQY ETF strategy and portfolio
The Vanguard U.S. Quality Factor ETF (BATS:BATS:VFQY) was launched on 02/13/2018 with the objective of investing in stocks with strong fundamentals. VFQY has a portfolio of 590 stocks, a dividend yield of 1.23% and an expense ratio of 0.13%.
As described by Vanguard, the management team selects stocks using “a rules-based screen designed to promote diversification and to mitigate exposure to certain less liquid stocks. Securities with relatively strong fundamentals may be identified by measures such as strong profitability, sustainable earnings, and healthy balance sheets.”
VFQY invests in U.S. companies of all size, from micro to mega caps. The portfolio is diversified: the top 10 companies, listed below with some basic ratios, have an aggregate weight of 12% of asset value. The largest holding is below 1.5%, so risks related to individual stocks are very low.
|
Ticker |
Name |
Weight% |
EPS growth % |
P/E ttm |
P/E fwd |
Yield% |
|
Aon plc |
1.42 |
-23.51 |
41.91 |
22.15 |
0.77 |
|
|
Colgate-Palmolive Co. |
1.36 |
-27.76 |
33.85 |
25.74 |
2.41 |
|
|
Cadence Design Systems, Inc. |
1.34 |
15.34 |
62.45 |
42.30 |
0 |
|
|
Costco Wholesale Corp. |
1.28 |
19.36 |
42.26 |
40.89 |
0.67 |
|
|
Fortinet, Inc. |
1.20 |
31.61 |
65.71 |
50.81 |
0 |
|
|
Alphabet, Inc. |
1.14 |
16.52 |
20.59 |
21.17 |
0 |
|
|
Autodesk, Inc. |
1.14 |
-57.08 |
83.43 |
31.95 |
0 |
|
|
Lululemon Athletica, Inc. |
1.13 |
35.17 |
40.83 |
35.31 |
0 |
|
|
Moderna, Inc. |
1.11 |
309.48 |
4.34 |
5.34 |
0 |
|
|
Vertex Pharmaceuticals, Inc. |
1.04 |
63.26 |
23.62 |
20.58 |
0 |
The fund is balanced in the top 5 sectors: technology, consumer discretionary, industrials, healthcare and financials weigh between 15.1% and 19.5% of asset value. Other sectors are below 5% individually and 16% in aggregate. Compared to the S&P 500 (SPY), VFQY overweights consumer discretionary, industrials, healthcare, financials, and materials. It underweights technology, consumer staples, communication, real estate, and utilities. Sector composition may change over time.
Sector weights (chart: author; data: Vanguard)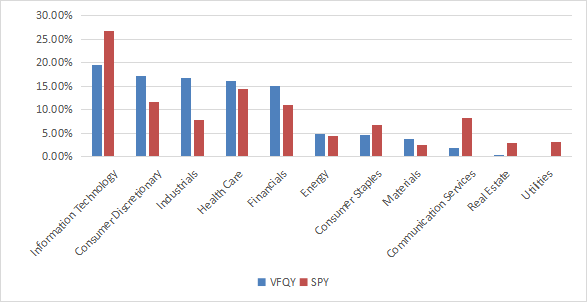
Valuation metrics are much cheaper than for the S&P 500, as reported in the next table.
|
VFQY |
SPY |
|
|
Price/Earnings TTM |
12.37 |
19.63 |
|
Price/Book |
2.96 |
3.72 |
|
Price/Sales |
1.35 |
2.4 |
|
Price/Cash Flow |
11.25 |
14.98 |
Source: Fidelity
VFQY ETF Past performance
Since inception in 2018, VFQY has underperformed the S&P 500 by a significant margin in annualized return and risk-adjusted return (Sharpe ratio). However, price history is short and may not represent long-term relative performance.
|
since inception |
Total Return |
Annual.Return |
Drawdown |
Sharpe ratio |
Volatility |
|
VFQY |
46.82% |
8.79% |
-36.36% |
0.43 |
20.67% |
|
SPY |
61.39% |
11.07% |
-32.05% |
0.59 |
17.60% |
Data calculated with Portfolio123
The next chart plots VFQY performance since inception vs. direct competitors: the BTC iShares MSCI USA Quality Factor ETF (QUAL) and the Invesco S&P 500 Quality ETF (SPHQ).
VFQY vs. competitors since 2/2018 (Portfolio123)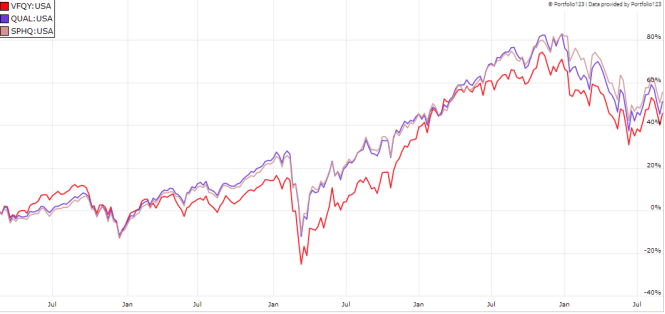
VFQY has been slightly lagging them in 5.5 years. However, it beats QUAL year-to-date:
VFQY vs. competitors in 2022 to date (Portfolio123)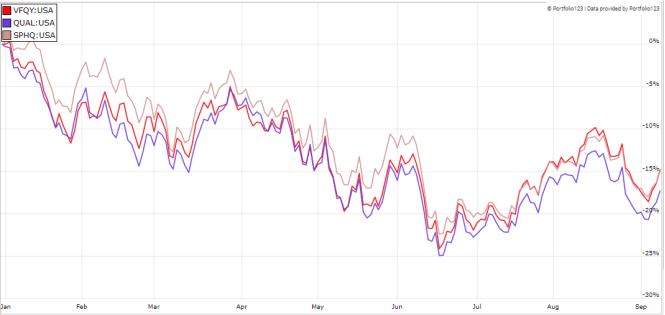
In previous articles, I have shown how three factors may help cut the risk in a portfolio: Return on Assets, Piotroski F-score, and Altman Z-score.
The next table compares VFQY with a subset of the S&P 500: stocks with an above-average dividend yield, an above-average ROA, a good Altman Z-score, a good Piotroski F-score and a sustainable payout ratio. The subset is rebalanced quarterly to make it comparable with a passive index.
|
Total Return |
Annual.Return |
Drawdown |
Sharpe ratio |
Volatility |
|
|
VFQY |
46.82% |
8.79% |
-36.36% |
0.43 |
20.67% |
|
Dividend & quality subset |
57.38% |
10.46% |
-35.13% |
0.57 |
18.11% |
Past performance is not a guarantee of future returns. Data Source: Portfolio123
VFQY underperforms the dividend quality subset. However, the ETF performance is real and this subset is hypothetical. My core portfolio holds 14 stocks selected in this subset (more info at the end of this post).
Scanning
VFQY ETF with quality metrics
In my ETF reviews, risky stocks are companies with at least two red flags: bad Piotroski score, negative ROA, unsustainable payout ratio, bad or dubious Altman Z-score, excluding financials and real estate for which these metrics are less reliable. In the case of VFQY, risky stocks weigh about 6.6% of the portfolio, which is acceptable.
According to my calculation of the weighted quality metrics reported in the next table, the Altman Z-score and the ROA are significantly above the benchmark. These metrics point to a portfolio quality superior to the S&P 500, as expected.
|
VFQY |
SPY |
|
|
Altman Z-score |
6.3 |
3.4 |
|
Piotroski F-score |
6 |
6 |
|
ROA% TTM |
12.2 |
7.4 |
Takeaway
VFQY holds over 500 U.S. stocks selected for strong fundamentals and covering all size segments. The fund very diversified and better balanced across sectors than the S&P 500, but the heaviest sector also is technology. Valuation ratios are much cheaper than for the benchmark, and quality is superior. Past total return is underwhelming: VFQY has lagged the benchmark and its competitor since inception, but price history is too short to assess the strategy. For transparency, a dividend-oriented part of my equity investments is split between a passive ETF allocation and my actively managed Stability portfolio (14 stocks), disclosed and updated in Quantitative Risk & Value.
Be the first to comment