

jittawit.21/iStock via Getty Images
Thanks to the selloff in real estate investment trusts (“REITs”) this year, there are a number of strong Medical REITs on sale at attractive prices. Although Medical REITs have outperformed the REIT average this year (see chart below), that isn’t saying much, since the average total return for the sector YTD is a dismal (-24.97%).
Hoya Capital Income Builder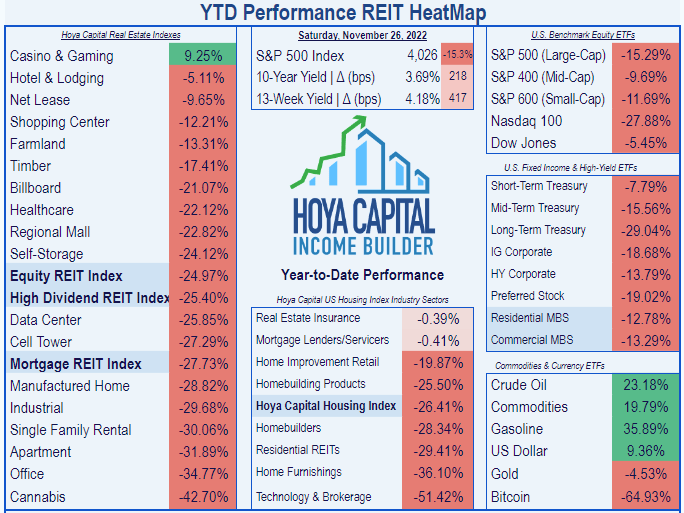
Amid the carnage, the average yield for the Medical REIT sector has soared to 4.82%, and the average Price/FFO has fallen to just 16.1. This has resulted in several Medical REITs being on sale at attractive prices.
Unfortunately, Ventas, Inc. (NYSE:VTR) is no bargain, as the rest of this article will show.
Meet the company
Ventas
Ventas owns approximately 1200 properties across the U.S., the U.K., and Canada. About two-thirds of these (815) are senior housing facilities, and about one-quarter (330) are medical office buildings (MOBs). The remainder are a smattering of 45 Life Science facilities, 36 intensive rehab facilities (IRFs), 16 Skilled nursing facilities (SNFs), 10 health systems, and 3 international hospitals.
Senior housing is divided into two groups: SHOP (Senior Housing Operating Portfolio) and Senior-Housing Triple Net. These two segments together constitute 50% of Ventas’ NOI (net operating income) as of September 30. Medical offices account for 30% of company NOI (21% MOBs and 9% Life Sciences).
Company investor presentation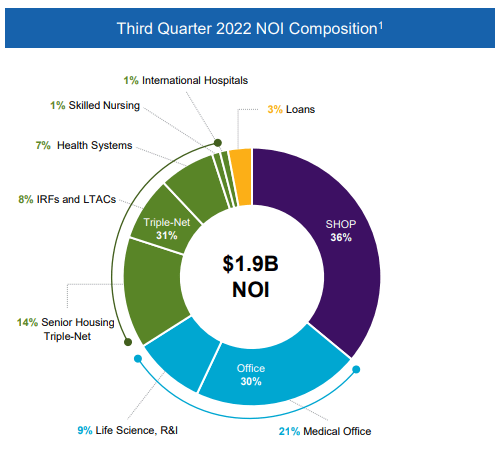
It is not possible in the space of a 2000-word article to provide a comprehensive overview of a company this vast and sprawling, but I will provide a thumbnail sketch of its two largest segments, as follows.
Senior housing segment
The largest of VTR’s segments is the SHOP (Senior Housing Operators Portfolio), which led the company in same-store cash NOI in Q3 2022, with a 13% increase over the same period a year ago. The company is guiding for a 15% – 21% YoY increase in Q4.
Average occupancy for the SHOP segment in the U.S. and Canada rose 260 bps (basis points) from the previous year in Q3, but still remains at just 84.7%, 330 bps shy of its pre-COVID levels. Leasing spreads are approaching a healthy 10%.
Company investor presentation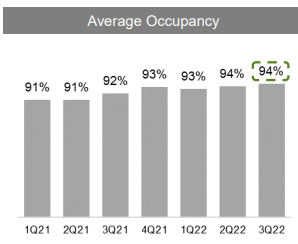
Move-ins exceeded 2019 levels in Q3, and move-outs were fewer.
Company investor presentation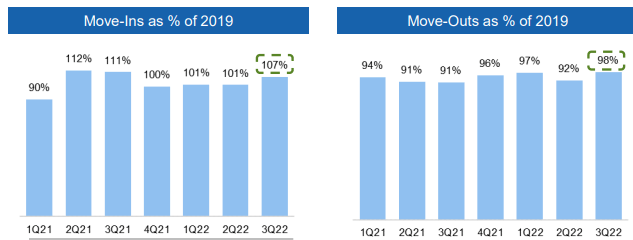
The longer-term demand picture looks favorable, as the U.S. population continues to age.
Company investor presentation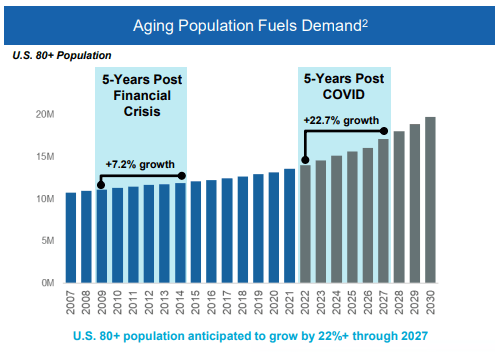
Meanwhile, the supply of new senior housing starts continues to drop from its peak in 2017. This combination should put upward pressure on rents.
Company investor presentation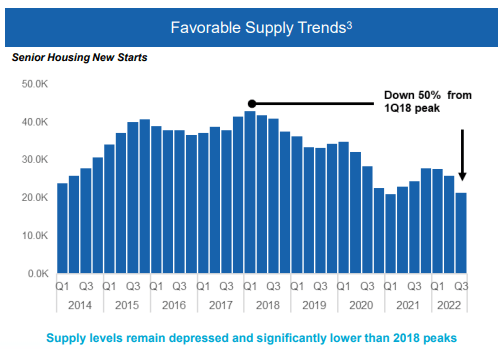
Within this favorable supply-demand dynamic, VTR’s SHOP facilities are located in markets characterized by wealthier people, so that the average individual net worth of $545,000 translates to 3.6 times the $150,000 average annual cost.
Company investor presentation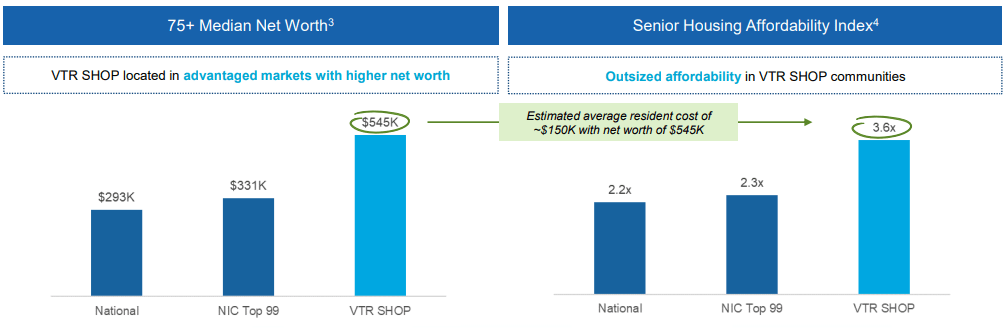
One encouraging sign for VTR is that its investment in its digital platform is starting to pay off. The vast majority (90%) of its leads now are generated through digital channels, and those digital leads are resulting in steadily higher conversion rates.
Company investor presentation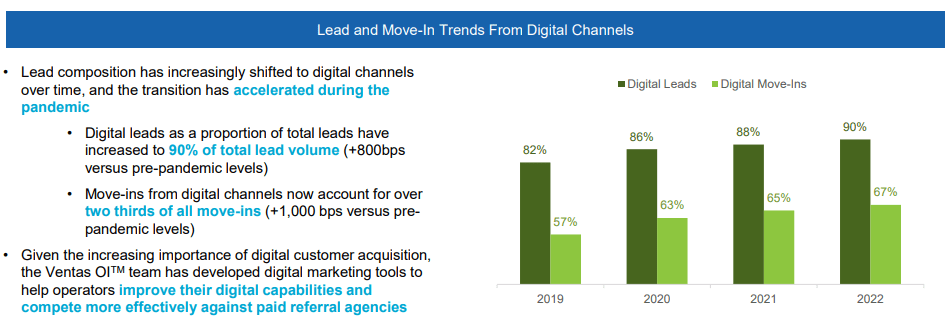
Although Q3 2022 saw a slight drop in digital leads, the rate of digital move-ins rose, indicating a sharply improved conversion rate for leads coming through digital channels.
Company investor presentation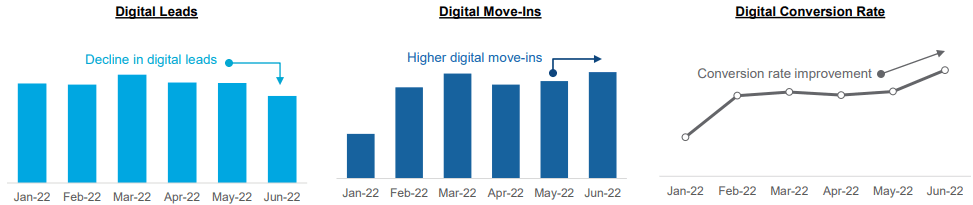
Office segment
The MOB segment is VTR’s second largest, accounting for about 30% of NOI. Third-quarter same-store cash NOI for the Office segment of the company, came in just 3% ahead of last year. About half of Ventas’ MOBs are connected to major universities, as shown below.
Company investor presentation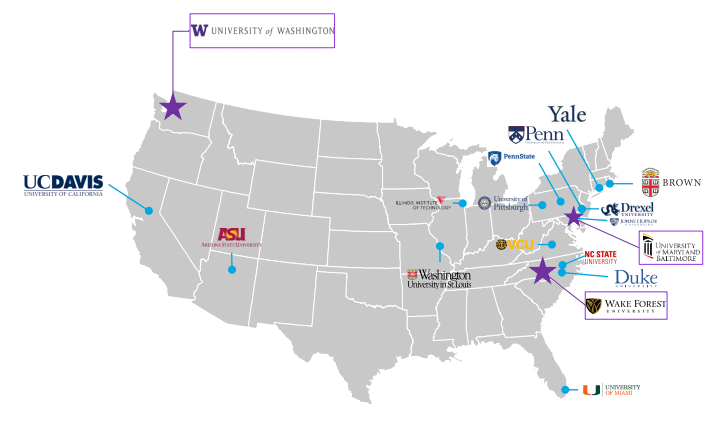
Another 27% of Ventas’ ABR (annual base rent) for the Office segment comes from tenants with market caps over $1 billion.
Company investor presentation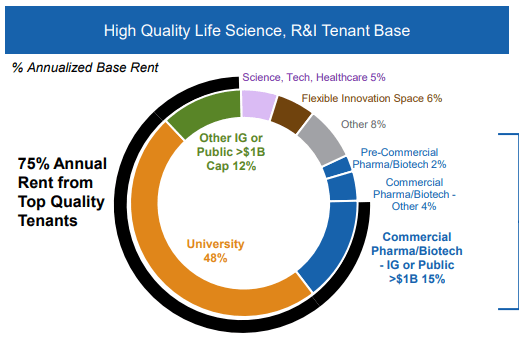
Almost all (95%) of Ventas MOBs are affiliated with a health system or hospital, and 71% are on the campus of that system.
Company investor presentation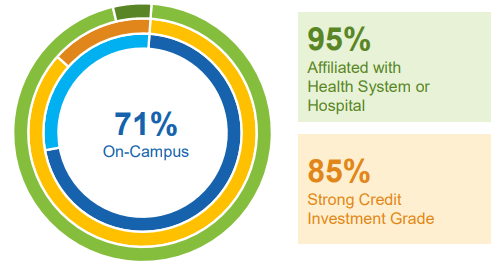
The vast majority (87%) of Ventas MOBs square footage is devoted to specialist offices, as opposed to primary care.
Company investor presentation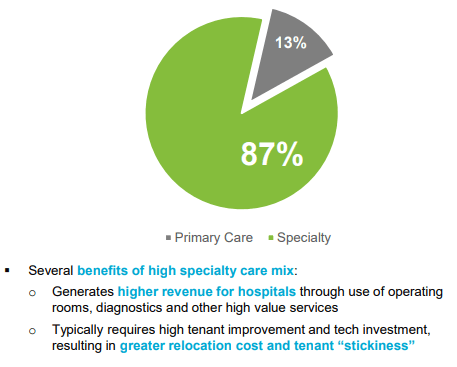
Ventas has greatly improved its reputation among its MOB customers over the past 3 years, going from run-of-the-mill tenant satisfaction in 2019 to top 10% in 2022.
Company investor presentation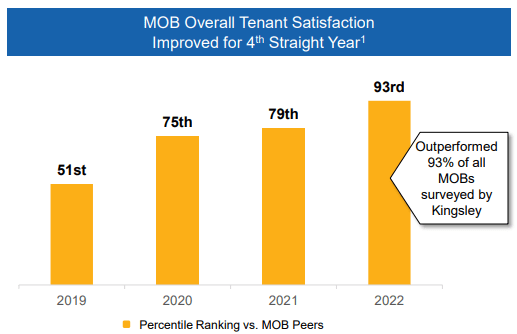
Although senior housing and MOBs account for 80% of VTR’s revenue, the company is investing more in Life Science facilities this year. Through the first three quarters of 2022, two-thirds ($1.0 billion) of the company’s $1.5 billion in capital allocation has gone to Life Science office properties, compared to $0.3 billion to MOBs, and only $0.2 billion to Senior Housing.
Quarterly results
While the SHOP portfolio grew same-store NOI by 13% in Q3 2022, the triple-net senior housing segment was essentially flat, at (-0.1)%, and the MOB segment gained just 3.0%.
Company Q3 2022 supplemental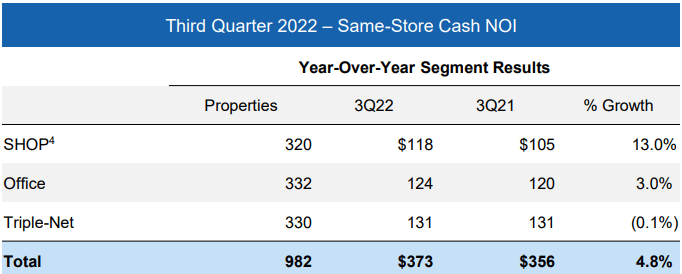
The company as a whole operated at a $2.4 million loss through the first 9 months of 2022, compared to a profit of $89.9 million for the same period in 2021. Most of the difference, however, was due to $194 million in gains from dispositions last year. This year, the company has slowed its dispositions to just $2.6 million.
In contrast to the rosy outlook for the SHOP segment, company guidance for NOI growth in the Triple-net and Office segments is low single digits.
Company Q3 2022 Earnings Supplemental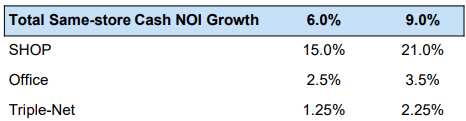
Growth metrics
Here are the 3-year growth figures for FFO (funds from operations), TCFO (total cash from operations), and market cap.
| Metric | 2019 | 2020 | 2021 | 2022* | 3-year CAGR |
| FFO (millions) | $1436 | $1269 | $1023 | $1165 | — |
| FFO Growth % | — | (-11.6)% | (-19.4)% | 13.9% | (-6.73)% |
| FFO per share | $3.85 | $3.32 | $2.90 | $2.98 | — |
| FFO per share growth % | — | (-13.8)% | (-12.7)% | 2.8% | (-8.18)% |
| TCFO (millions) | $1438 | $1450 | $1026 | $1137 | — |
| TCFO Growth % | — | 0.8% | (-29.2)% | 10.8% | (-7.53)% |
*Projected, based on Q3 2022 results
Source: TD Ameritrade, CompaniesMarketCap.com, and author calculations
Even before the pandemic, Ventas’ growth was lethargic. Of course, COVID did nothing to improve matters. Even now, despite a much-needed return to positive growth this year, none of the revenue metrics have recovered to pre-pandemic levels, and 3-year growth figures are negative across the board.
Meanwhile, here is how the stock price has done over the past 3 twelve-month periods, compared to the REIT average as represented by the Vanguard Real Estate ETF (VNQ).
| Metric | 2019 | 2020 | 2021 | 2022 | 3-yr CAGR |
| VTR share price Dec. 2 | $57.88 | $47.68 | $47.00 | $46.24 | — |
| VTR share price Gain % | — | (-17.6) | (-1.4) | (-1.6) | (-7.21) |
| VNQ share price Dec. 2 | $91.66 | $84.41 | $108.13 | $87.63 | — |
| VNQ share price Gain % | — | (-7.9)% | 28.1% | (-19.0)% | (-1.49)% |
Source: MarketWatch.com and author calculations
This time a year ago, REITs were near their all-time highs, but VTR was languishing with flat prices. It continues to languish this year, but that is a great improvement over the REIT average, which has plummeted. Nevertheless, over the past 3 years, VTR has lost investors an average of (-7.21)% per year on share price, compared to the VNQ’s average loss of (-1.49)%, as well as underperforming on yield, as we will see below.
Balance sheet metrics
Here are the key balance sheet metrics. Ventas’ current liquidity, debt ratio, and Debt/EBITDA are all worse than the average Medical REIT, and worse than the average REIT overall.
| Company | Liquidity Ratio | Debt Ratio | Debt/EBITDA | Bond Rating |
| VTR | 1.78 | 37% | 7.5 | BBB+ |
Source: Hoya Capital Income Builder, TD Ameritrade, and author calculations
VTR reported $2.5 billion in liquidity at the close of Q3 2022, over against $12.2 billion in debt, which constitutes 43.8% of enterprise value.
Company investor presentation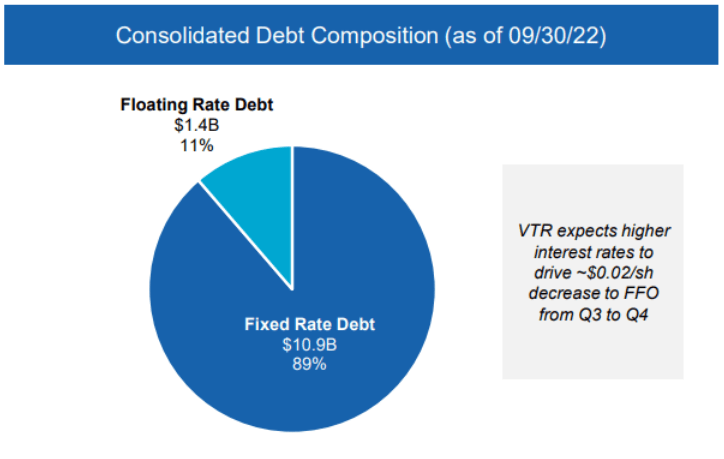
Ventas’ 10-Q for Q3 2022 does not provide a weighted average interest rate on its debt, but here are the details.
Company 10-Q for Q3 2022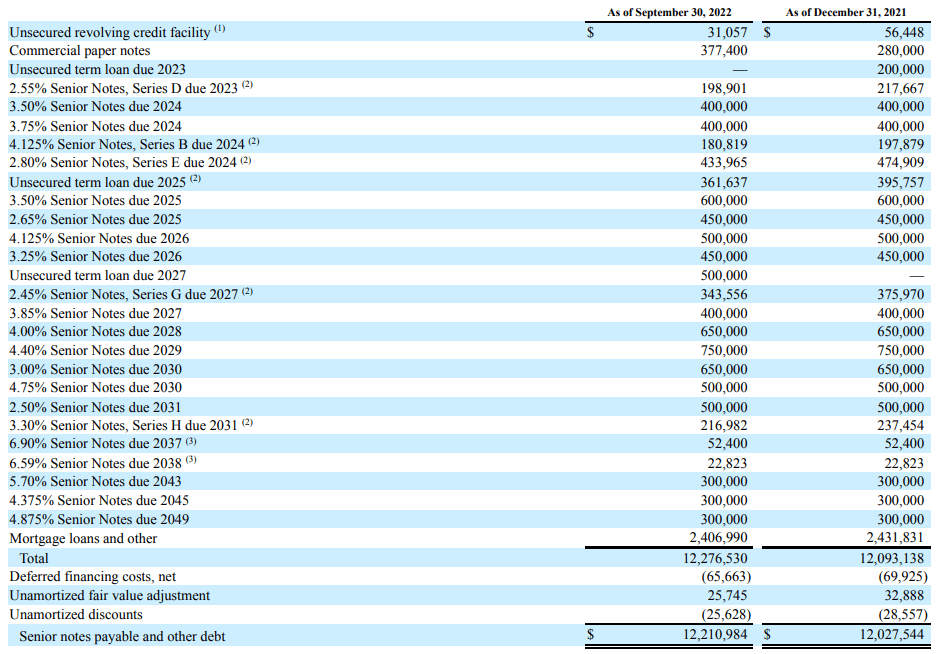
Maturities are very favorable for the rest of this year and all of 2023, totaling only 4.5% of the debt load. From 2024 – 2026, about $4.6 billion (37.7%) comes due, with the remainder due in 2027 or later.
Company 10-Q for Q3 2022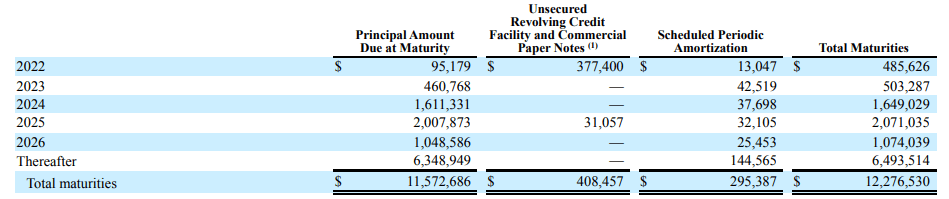
Dividend metrics
Like most Medical REITs, Ventas found it necessary to cut their dividend in 2020, but this company’s cuts have been deeper and longer-lasting than most. In fact, the only Medical REIT with a worse dividend-cutting track record over the past three years has been tiny Diversified Healthcare Trust (DHC). As a result, VTR’s relatively low yield and dismal dividend growth result in a Dividend Score far below both the Medical REIT and overall REIT averages.
| Company | Div. Yield | 3-yr Div. Growth | Div. Score | Payout | Div. Safety |
| VTR | 3.89% | (-17.2)% | 2.21 | 60% | D- |
Source: Hoya Capital Income Builder, TD Ameritrade, Seeking Alpha Premium
Dividend Score projects the Yield three years from now, on shares bought today, assuming the Dividend Growth rate remains unchanged.
Even with a conservative payout ratio of 60%, Seeking Alpha Premium rates VTR’s dividend perilous at D-. Dividend safety is of great importance, because companies that cut their dividend almost immediately lose considerable share value, as COWhand investors flee for greener pastures.
Valuation metrics
Paradoxically, while Medical REITs are selling at slightly below the REIT average, they are selling at a slight premium to NAV. VTR goes further in both these respects, with a Price/FFO slightly below the Medical average, but an even larger premium to NAV. To a value investor, these numbers do not exactly say “bargain.”
| Company | Div. Score | Price/FFO ’22 | Premium to NAV |
| VTR | 2.21 | 15.5 | 2.8% |
Source: Hoya Capital Income Builder, TD Ameritrade, and author calculations
Investor’s bottom line
With a problematic yield and nondescript valuation, Ventas is a growth play, and not a particularly compelling one. Although the senior housing portfolio is fairly well-positioned to take advantage of secular tailwinds from the aging of the population, and considerable internal growth could occur, simply by improving occupancy, it is hard to imagine this sprawling conglomerate growing at rates that compete with some of its smaller, more agile competitors. I see VTR’s growth prospects as somewhat around the corner, rather than immediate, and would not be surprised to see a serious selloff in the nearer term. In the 2-to-5 year horizon, VTR would be a reasonable Hold, but I rate it a Sell simply because I see better opportunities, even in Medical REITs.
VTR’s return on equity growth YoY stands at an appalling (-85.64)%, and its EPS diluted growth at (-90.19)%, placing it at high risk of performing badly, according to the Seeking Alpha Quant Ratings system, which rates the company a Strong Sell.
Seeking Alpha Premium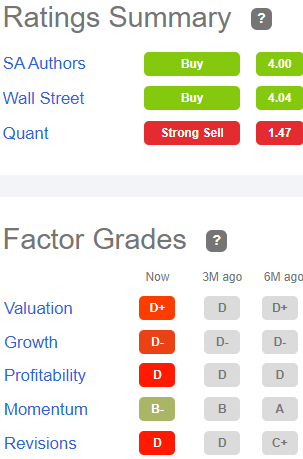
Opinion is sharply divided on this company, however. Wall Street analysts tend to be bullish on VTR, with 15 of 23 rating it Buy or Strong Buy, and none calling it a Sell. The average price target is $53.25, implying 15% upside.
The Street rates Ventas a Hold, but Ford Equity Research leans Sell. Revisions-sensitive Zacks advises a Hold. Meanwhile, TipRanks thinks VTR will outperform.
So as usual, it’s anybody’s guess. And as always, the opinion that matters most is yours.
Be the first to comment