

gesrey/iStock via Getty Images
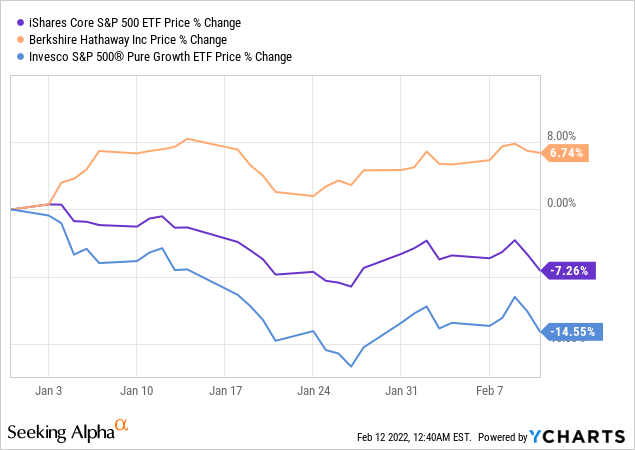
As the markets are still digesting higher inflation data that made it crystal clear that interest rate hikes can be implemented in a much more aggressive manner in order to tame what has become totally intolerable, I believe it is worth discussing value-focused funds once again, as growth style is bearing the brunt of this bear party, while cheaper stocks are chugging along.
The following chart with the YTD price returns of Berkshire Hathaway (BRK.B), a pure value stock, and the S&P 500 ETF (IVV) along with its pure growth portion (RPG) nicely illustrates that trend.
Today, we will be taking a closer look at the Vanguard U.S. Value Factor ETF (VFVA), an investment vehicle from the actively-managed family launched simultaneously (February 2018) with the Vanguard U.S. Quality Factor ETF (VFQY), which I discussed a few weeks ago.
As I observe, the fund does not get due attention, with only 592 followers on Seeking Alpha, though it certainly has advantages, from robust momentum and paper-thin expenses to large exposure to stocks with appealing Quant Valuation and Profitability grades that combined make it an ETF to consider.
Investment strategy
VFVA’s not a fully transparent strategy relying on a rules-based quantitative model is something one should expect from a non-indexed fund. We know that it is benchmarked against the Russell 3000, a broad market index with no profitability criteria, and that its primary purpose is to deliver capital appreciation in the long haul by selecting cheaper stocks.
In the prospectus, it is only said that the Book/Price and Earnings/Price ratios are used, but the factsheet does hold more clues:
The Value factor is measured by book value/price, forward earnings/price, operating cash flows/price (for non-financials only).
Though I should once again reiterate that P/B is probably a suboptimal choice as a bit dated multiple, I like that the fund does not ignore the power of cash flows, applying the respective metric where it makes sense.
It is also said that VFVA’s approach is not constrained by the size factor, so it can invest in both bellwethers and small-caps if they are seemingly underappreciated, depending on liquidity considerations; the latter segment offers countless opportunities for bargain hunters due to the size discount, and the Quant data detailed below in the article will once again illustrate that.
Returns
Was the strategy focusing on long-term capital appreciation by picking underpriced stocks capable of outperforming the benchmark since inception? Unfortunately not, but there are some bright spots hinting that the style may do well going forward.
The first group we should take a look at encompasses the fund tracking its benchmark (I chose the iShares Russell 3000 ETF (IWV)), the U.S. blue-chips (IVV), Fidelity Value Factor (FVAL), and the Invesco S&P 500 Pure Value ETFs (RPV), with the period limited to March 2018 – January 2022 (due to VFVA’s relatively short trading history).
VFVA, IVV, FVAL, RPV, IWV returns (Created by the author using data from Portfolio Visualizer)
Though VFVA is not the worst in the group (RPV actually is), its compound annual growth rate is well lower than IWV’s, while risk metrics (standard deviation, Sortino, Sharpe ratios) are poor. Among other things, FVAL’s seemingly better performance is more likely a by-product of its exposure to the growth factor, not a unique value strategy, as I have explained in the recent article.
Please take notice that the ‘best year’ for IWV, IVV, and FVAL was 2019, while for RPV and VFVA, it was 2021 when the strong (30%+) performance of cheaper stocks was buttressed by capital rotation. So in case of tightening bolstering value style, these names may continue marching higher.
VFVA, DSTL, VLUE, SPVU comparison (Created by the author using data from Portfolio Visualizer)
I have also compared it with other peers, namely the Distillate Fundamental Stability & Value ETF (DSTL), Invesco S&P 500 Enhanced Value ETF (SPVU), and iShares Edge MSCI USA Value Factor ETF (VLUE), within a shorter period, only from November 2018 (this time, because of DSTL).
In this group, VFVA is again not the best performer, though with much better returns compared to SPVU and VLUE.
DSTL being the best in the cohort points to the fact that though most of the analyzed period was rather challenging for the style, some counterpart passively-managed funds that do something different (i.e., prioritize cash flows) managed to deliver decent returns even in this uneasy environment, with lower risks (see Sharpe, Sortino ratios) to boot.
Holdings. A deeper delve into valuation
The first thing that can be spotted immediately upon looking into the VFVA portfolio is that the ETF shuns top-heaviness, dispersing risks in a more or less adequate manner, with just ~8% invested in ten key stocks in a basket of 816 holdings. Investors expecting an equity mix similar to the one other ‘value factor’ ETFs have (FVAL is worth mentioning here) will be surprised positively, as there are no $1 trillion club members inside, even with trimmed weights. As of February 11, AT&T (T), an ~$175 billion company, was the fund’s key investment, with ~0.96% weight.
The chart below illustrates that as a typical value ETF, VFVA favors financials over information technology, while also being overweight in consumer discretionary, industrials, energy, and materials.
Created by the author using data from VFVA, IWV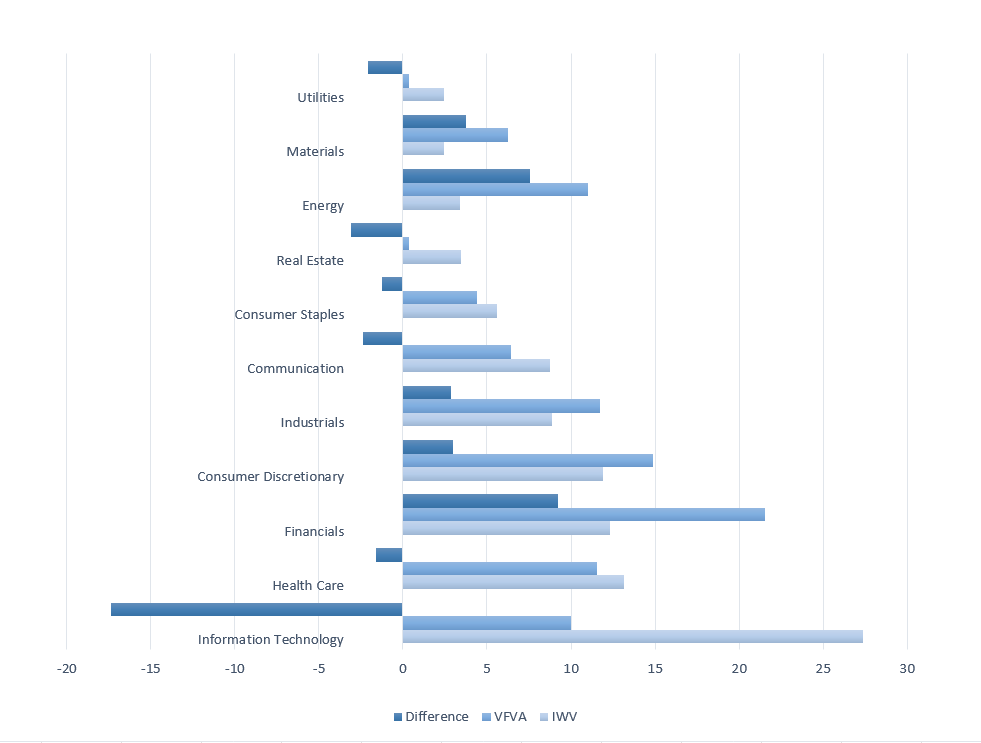
Analyzing the Quant data, I found out that over 58% of the holdings have Valuation grades of at least B-. That is a decent result since most value-tilting funds I assessed struggle to get that figure even slightly above 30%. Such a significant allocation is certainly the consequence of VFVA’s considerable footprint in small-size equities: over 35% of holdings have a market cap below $10 billion and a VG of at least B-.
VFVA top 25 holdings (Created by the author using data from Seeking Alpha and the fund)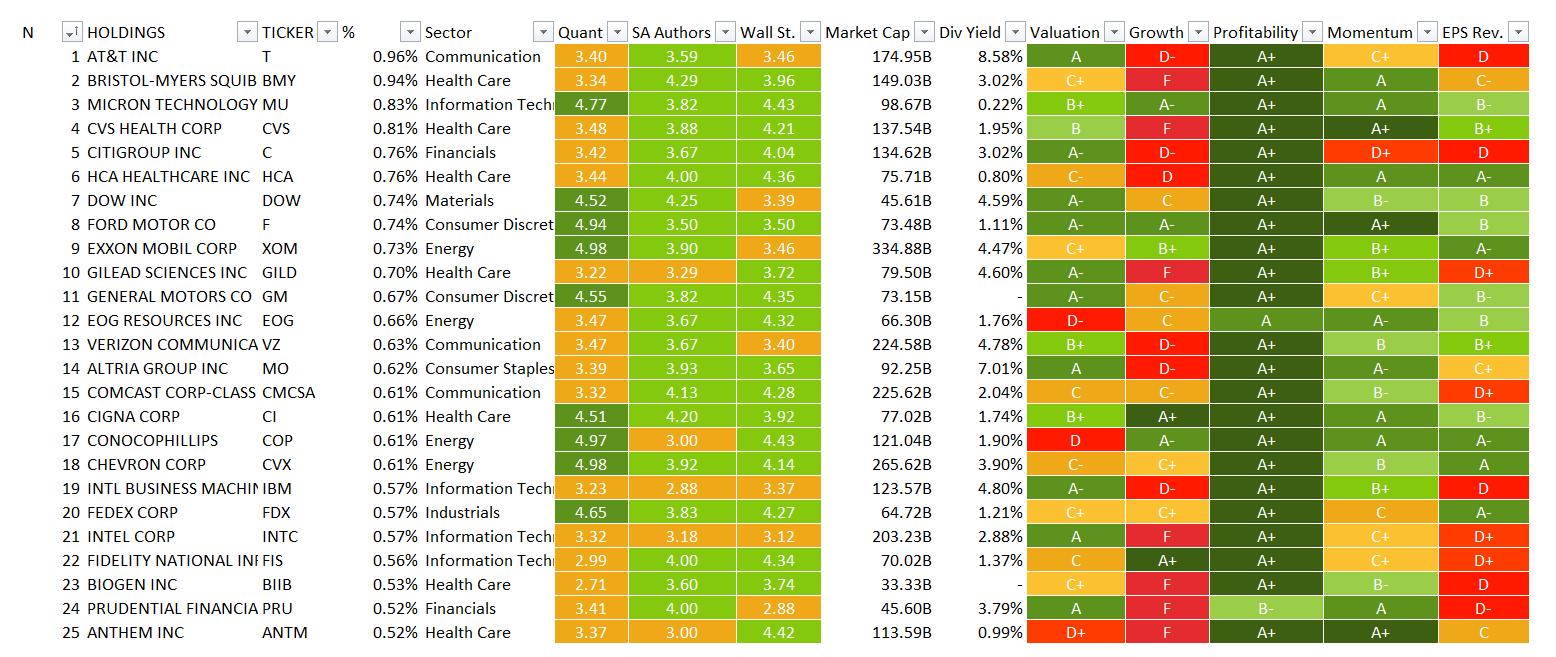
To bring more color, I created a scatter graph using the valuation data downloaded from the stock screener. A few enhancements were necessary; first, all the companies with missing data points (e.g., negative or unavailable Forward P/E) were obviously factored out. Second, a few outliers with 20x+ or even triple-digit P/Bs were also excluded. For example, Sealed Air (SEE), a mid-cap company with gargantuan 2,954% Debt/Equity and P/B of 75.3x was removed. At the end of the day, the chart below covers ~87.4% of the fund’s holdings.
P/E, P/B analysis (Created by the author using data from Seeking Alpha and the fund)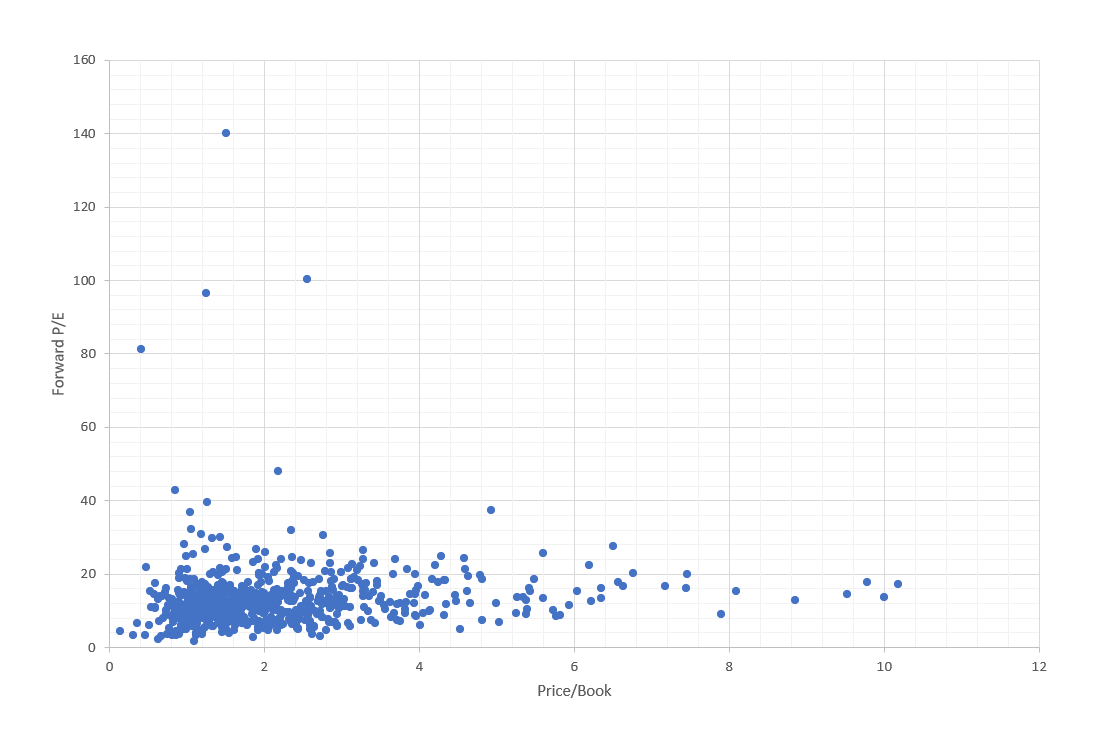
As it can be noticed, the densest area is sub-20x Forward P/E and sub-2x P/B, though its footprint in the 2x-4x P/B sector is also substantial, which indicates the fund can tolerate seemingly inflated multiples in case it considers acceptable, or any other measures (e.g., cash flows) point to undervaluation.
And here is how the same chart looks for IWV (again, with outliers removed like Shoals Technologies (SHLS), Atlassian (TEAM), etc.; I excluded mostly those with P/B above 40x; the graph covers approximately 86.7% of the holdings).
Created by the author using data from Seeking Alpha and IWV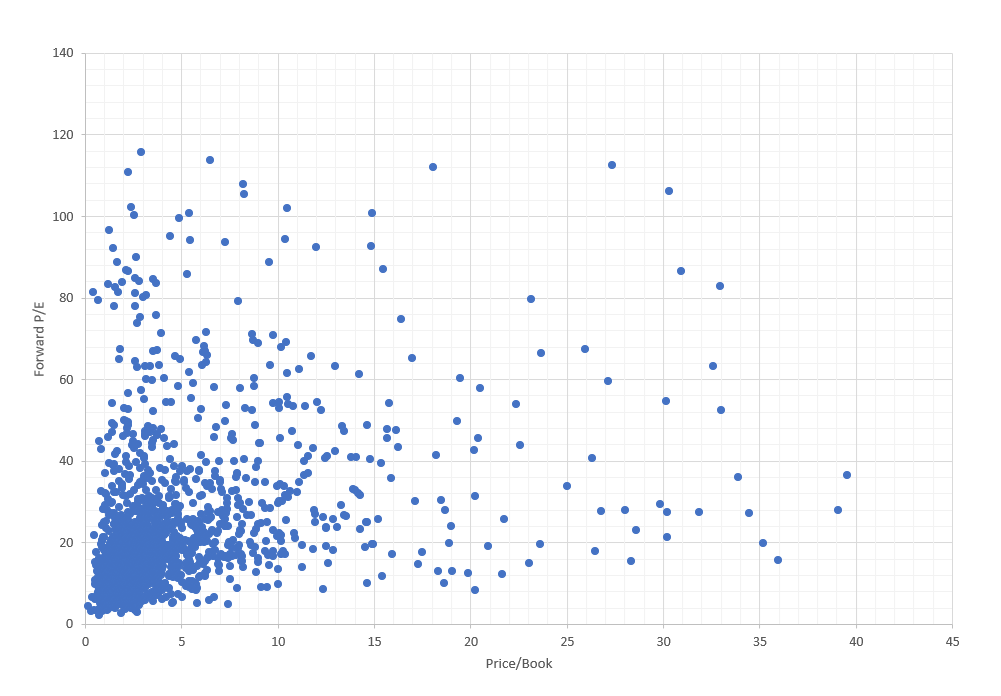
From this chart, it can be easily spotted that this Russell 3000 ETF has a meaningful footprint in stocks with Forward P/Es well in excess of 20x, principally in the 20x-40x range and of course above, in sharp contrast to VFVA.
Besides, I should remark that VFVA’s growth characteristics are not as terrible as one might guess: despite its value tilt, ~34% of the holdings have Growth grades of B- or better. Quality is also fine, weaker than in the case of most large-cap funds, but still, 72% have a Profitability rating of B- or above.
Final thoughts
The verdict? First, I like its phenomenally low for an actively managed fund expense ratio of 14 bps. At the same time, VFVA does not offer anything unique in terms of strategy (P/E, P/B in focus), at least as I can judge from its succinct explanation of the value factor in the factsheet, though its exact value formula, especially in terms of stock weighting, is unknown.
Performance is, unfortunately, unconvincing, as some peers did better. Anyway, since over 58% of its current holdings have appealing Valuation grades, with exposure to the quality factor also being significant, I am bullish on VFVA.
Be the first to comment