


da-kuk/E+ via Getty Images
Investment Thesis
Two years ago, I bought myself a set of quality ‘all-weather tires,’ which I learned were an acceptable cross between summer and winter tires and safer than all seasons for our messy climate. So far, they’re great. I don’t have to change them over, and as long as I don’t take unnecessary risks like driving during a winter storm, I shouldn’t have any problems.
Passive investors might want to take the same approach by building an ‘all-weather portfolio.’ This approach requires considering factors like volatility, valuation, growth, and quality and ensuring your portfolio scores well on all metrics. That way, you’re covered no matter what, and the Vanguard Value ETF (VTV) is a great place to start. This article demonstrates how VTV scores well on key metrics relative to over 50 large-cap value and dividend ETFs, and why it’s one of the better choices available to passive investors.
VTV Overview: Strategy, Sector Exposures, Top Holdings, And Performance
VTV passively tracks the CRSP US Large Cap Value Index, selecting five factors to rank all stocks in the larger U.S. equity universe:
- Book To Price Ratio
- Future Earnings To Price Ratio
- Historical Earnings To Price Ratio
- Dividend To Price Ratio
- Sales To Price Ratio
In previous articles, several readers commented how the book-to-price ratio is outdated. I would agree, which is why it’s not one of the factors I’ll use to make my case today.
CRSP Indexes are free-float market-capitalization-weighted, meaning all its top holdings are household names, including Berkshire Hathaway (BRK.B), Johnson & Johnson (JNJ), UnitedHealth Group (UNH), and Exxon Mobil (XOM). The complete top ten list is below, totaling 21.47%.
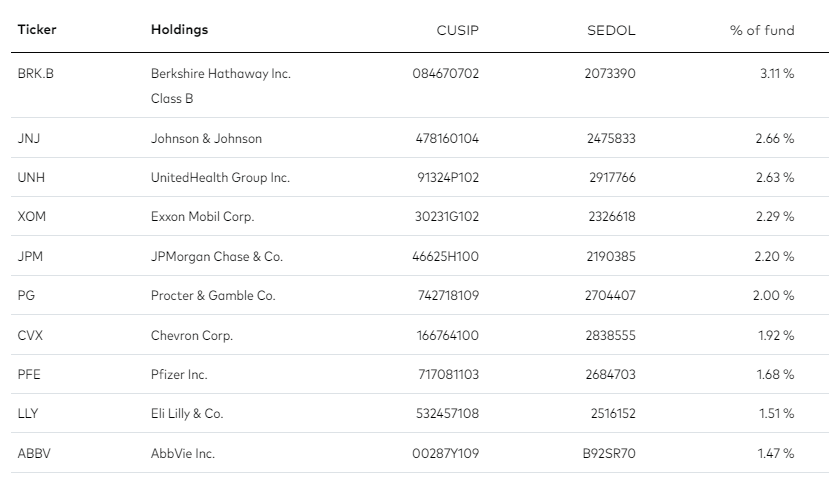
Vanguard
VTV allocates approximately 20% to the Financial and Health Care sectors and just over 10% to Consumer Staples and Industrials. These allocations are similar to the iShares Russell 1000 Value ETF (IWD), while the S&P-based ETFs have decidedly lower exposures to the Financials sector.
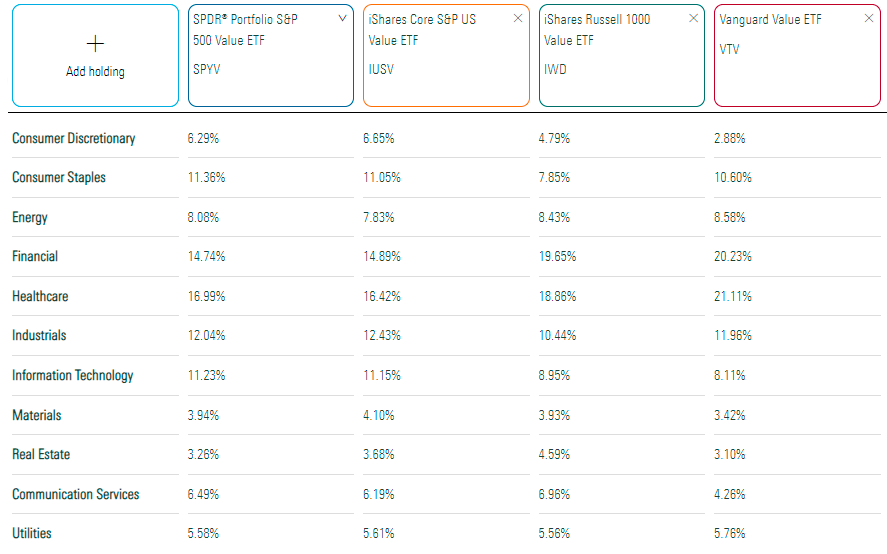
Morningstar
Performance-wise, there’s not too much separating these four value ETFs over the last 20+ years. VTV gained an annualized 6.59% since October 2000, slightly better than SPYV and IWD but behind IUSV. All have a cheap 0.04% expense ratio, except for IWD, which charges 0.19%.
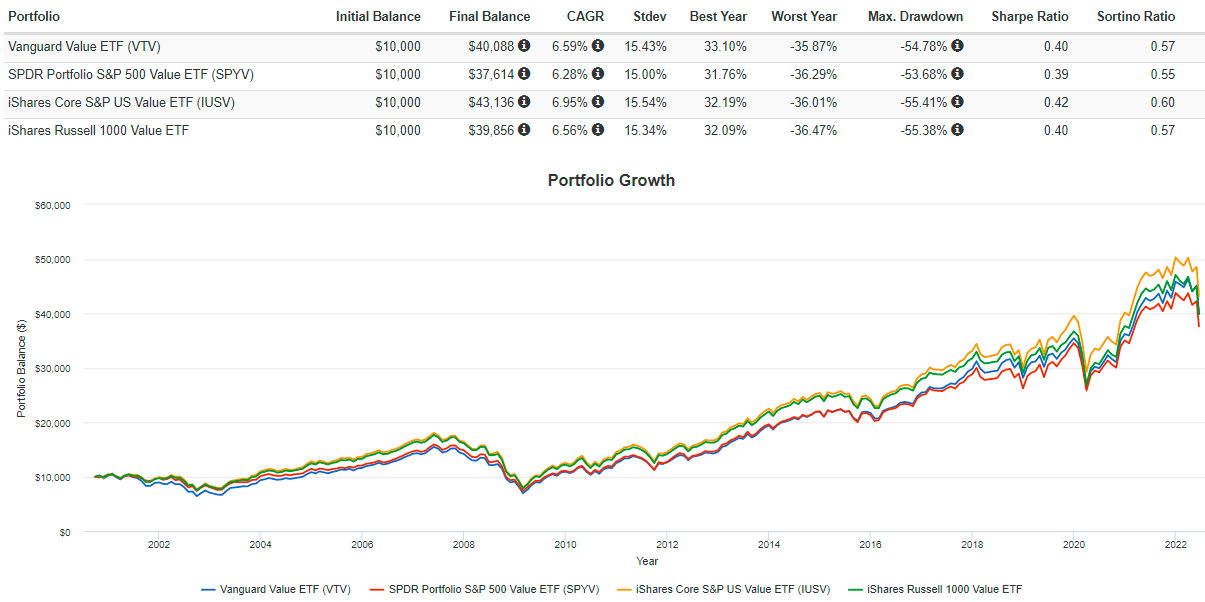
Portfolio Visualizer
VTV previously tracked the MSCI US Prime Market Value Index through April 16, 2013, so a more appropriate comparison would be from May 2013 onwards. Since then, VTV has performed better, gaining an annualized 10.03%, or 1.14% better on average. As a bonus, volatility (standard deviation) was lower, leading to better risk-adjusted returns.
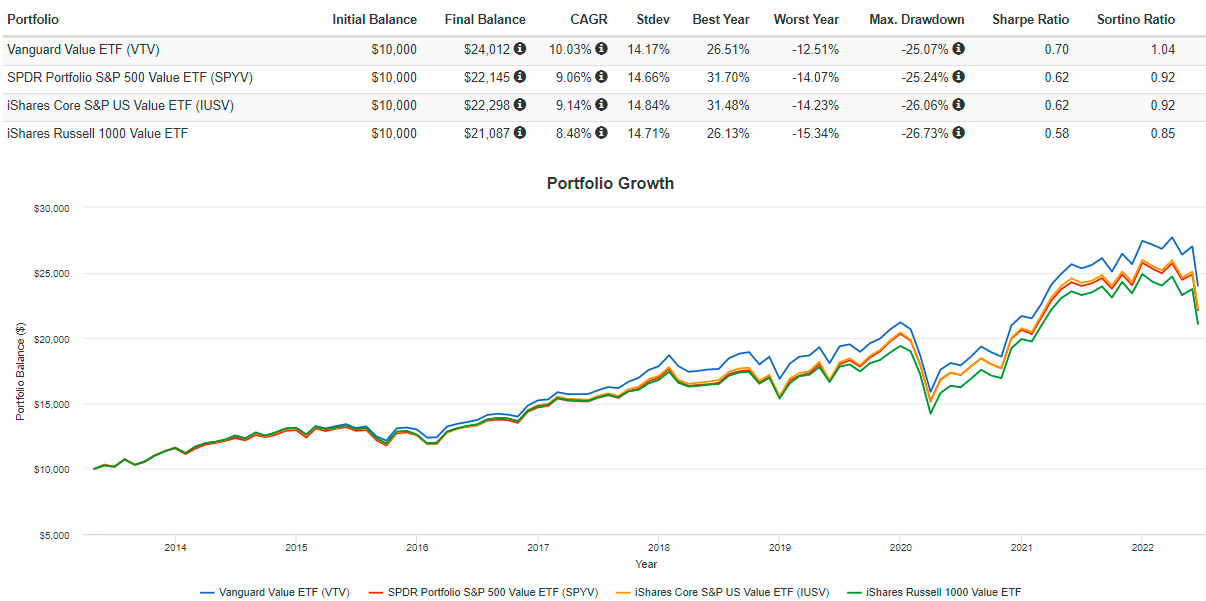
Portfolio Visualizer
Fundamental Analysis
Industry Snapshot
To begin, I want to go over some of VTV’s key fundamental metrics by industry by comparing it with an ETF on the other end of the spectrum: the Vanguard Growth ETF (VUG). Clearly, this isn’t an apples-to-apples comparison, but that’s the point. Value investors should know what they are getting and are giving up. Once that’s understood, we can look at how VTV scores relative to other large-cap value and dividend ETFs.
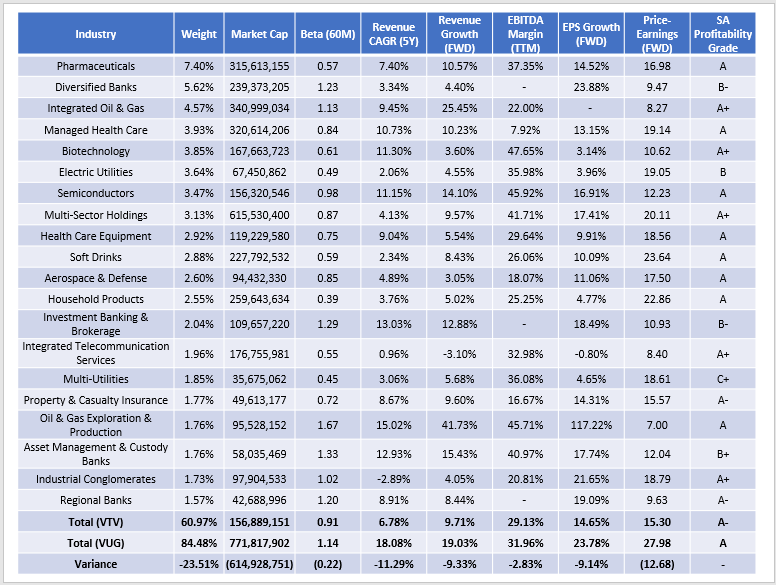
The Sunday Investor
A few points I want to highlight:
1. VTV’s five-year beta is currently 0.91 compared to 1.14 for VUG. One reason is that VTV holds seven Pharmaceuticals stocks, totaling 7.40%. Johnson & Johnson, Pfizer (PFE), Eli Lilly (LLY), and Merck (MRK) have betas of 0.66, 0.71, 0.40, and 0.37. As the chart below demonstrates, an equal-weight portfolio (rebalanced quarterly) won’t necessarily be less volatile than the market, but it has a low market correlation (0.46 vs. 0.98). I’m comfortable with this relatively defensive approach, especially considering how returns and risk-adjusted returns were superior over the long run.
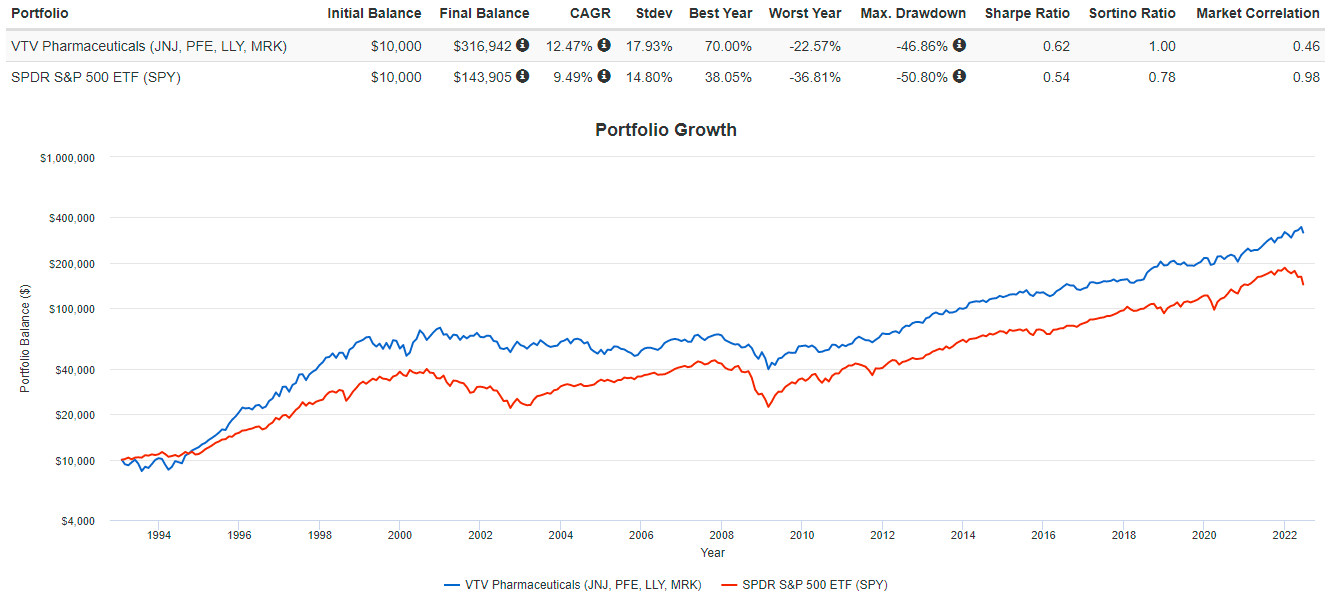
Portfolio Visualizer
2. VTV lacks revenue growth. Only one-third of constituents (32.45% of the weight) have a double-digit forward revenue growth rate, compared to three-quarters (86.29% of the weight) for VUG. VTV has outperformed VUG by 20% YTD, so it’s safe to say growth hasn’t been an important factor this year. I think that trend will continue as interest rates rise and economic conditions worsen. The Michigan Consumer Index fell to 50.2 vs. 58.4 in May, and consumers’ assessment of their financial situations worsened by about 20%.
3. VTV’s EBITDA margins are surprisingly strong compared to VUG (29.13% vs. 31.96%), and its average Seeking Alpha Profitability Grade of “A-” is acceptable. Profitability appears linked to market capitalization, so sticking with the large caps is preferable. To illustrate, the Vanguard Small-Cap Value ETF (VBR) has a Profitability Grade of “B-” and isn’t as appropriate for the all-weather portfolio we’re trying to develop.
4. VTV’s forward price-earnings ratio of 15.30 is substantially less than VUG’s 27.98. Investors should demand this deep discount for its much lower growth potential. Also, note that VTV’s trailing price-sales and price-cash flow ratios are 3.02 and 13.32 compared to 6.66 and 24.18 for VUG.
In summary, value investing can be defined by:
- lower risk and volatility
- substantially lower growth, especially on the revenue side
- slightly lower margins and profitability levels
- significantly lower valuations
VTV is also much more diversified than its growth option since only 60.97% of assets are held in its top 20 industries compared to 84.48% for VUG.
Rankings Vs. Large-Cap Value And Dividend ETFs
Now that we see how VTV compares with VUG, let’s look at how it compares with other large-cap value and dividend ETFs. There are 54 in total, and for the graph below, the lower the ranking, the better.
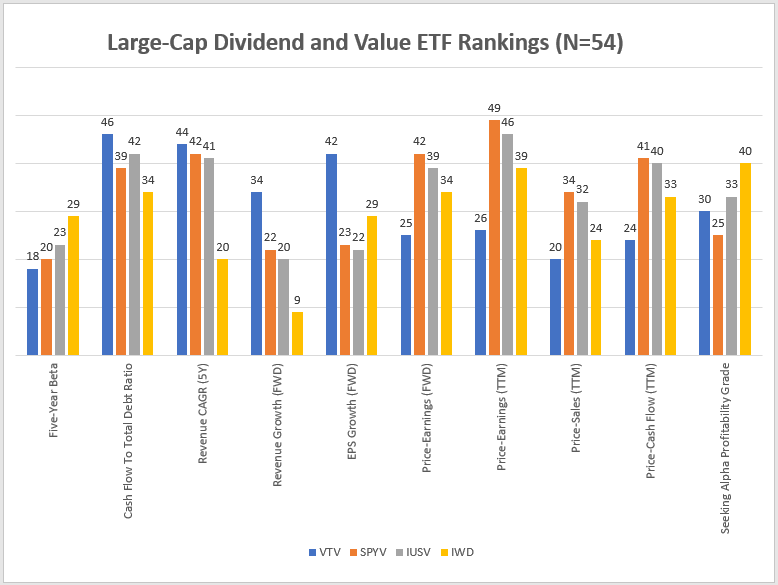
The Sunday Investor
Some key observations:
1. VTV’s five-year beta (0.91) is the 18th lowest, though SPYV and IUSV are close at 0.91 and 0.93, respectively. Investors should give a lot of weight to this metric if they believe a recession is imminent. In such a scenario, all equity ETFs will likely be negatively impacted, but VTV is positioned to have more downside protection than the rest.
2. VTV’s cash to total debt ratio (excluding Financials and Real Estate securities) is 41.47%, placing it only 46th best in the sample. However, the distribution is tight since IWD is 34th best at 45.02%. For those valuing this metric, which measures the last twelve months’ operating cash flow as a percentage of total debt, try the First Trust Rising Dividend Achievers ETF (RDVY). It’s one of the key screens, and I recently upgraded the fund after its March reconstitution.
3. We saw earlier how VTV’s revenue growth was weak, but it’s important to note that it’s also weak compared to its peers. Ranked 44th and 34th best on a historical and forward-looking basis, it’s one area current VTV owners should look to improve by adding higher-growth stocks or ETFs. Unfortunately, it seems difficult to keep your fees low while keeping with the value theme. The best I could find was the Schwab U.S. Large-Cap Value ETF (SCHV), with a 0.04% expense ratio but only a 10.71% forward revenue growth rate (vs. VTV’s 9.71%). Therefore, I think the best way is to add a low-cost growth ETF in your desired proportions.
4. VTV has an edge on valuation compared to most peers, with its 15.30 forward price-earnings ratio ranking 25th best. Most of the cheaper ETFs are “pure value” ETFs like SPVU, SPVM, and RPV, and you may not want to go there because they’re so much more volatile (five-year betas of 1.10, 1.22, and 1.08). VTV’s valuation is attractive, and I think it hits the sweet spot for passive investors.
5. You may have noticed that IWD scores well on many metrics, including cash to total debt, revenue and EPS growth, and valuation metrics like price-to-sales. However, it’s weakest on profitability, and I place a lot of importance on that metric when investing over a long time. To be sure, IWD’s holdings are still quite profitable as they are all large-cap stocks, but given a choice, I think passive investors should avoid speculating too much.
Investment Recommendation
VTV scores reasonably well on numerous metrics like fees, diversification, volatility, valuation, margins, and overall profitability. It’s weak on revenue and earnings per share growth, but I couldn’t find any alternatives that didn’t require substantial sacrifices. As for low-cost, well-diversified value ETFs, VTV is one of the better choices. I would also rank the Vanguard Mega Cap Value ETF (MGV) high on that list, which I reviewed here.
Building an all-weather portfolio is a worthwhile goal for any passive investor. There are opportunities for outperformance for investors willing to trade, and I attempt to identify them in my articles. However, there’s nothing wrong with simplifying your portfolio by owning a set of low-cost core ETFs from various categories and adjusting the allocations to match your comfort level. On the large-cap value side, I hope I’ve demonstrated that VTV is a worthy choice, and if you have any questions about other ETFs that rank well on each metric that are of interest to you, please feel free to ask about it in the comments section. Thank you for reading.
Be the first to comment