

Dilok Klaisataporn/iStock via Getty Images
Introduction
We are now about halfway through 2022 and it occurred to me that I’ve only written one public “buy” article this year. All the rest of my articles have been bearish articles of one kind or another, trying to warn investors about the dangers of the bear market we now find ourselves in. The single “buy” article I did write, was back in March on Cigna (CI) titled “Cigna Is An Attractive Investment In This Market Environment“. So far, that has proven to be the case. Here is how Cigna has performed since the article:
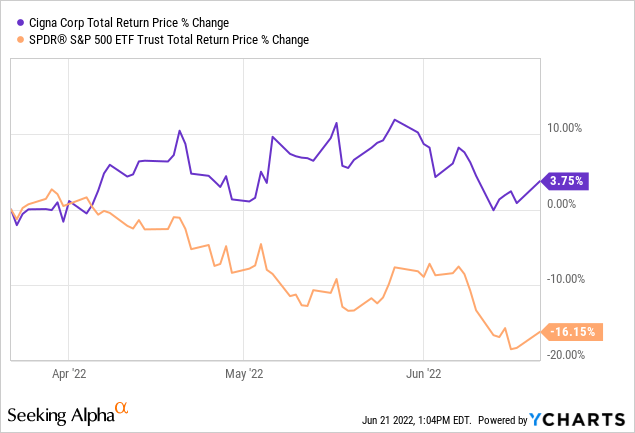
It really goes to show that it’s a market of stocks rather than a stock market, and lends some evidence to the idea that it is possible to measure value in stocks and there is more than just random luck in stock picking (granting, of course, that this is a sample of one over a short period of time). I have experienced a much larger sample size over time to know that it is possible to find value in the marketplace if you have the skill.
I have mostly been very bearish on the market overall this year, but I’m not always bearish, as we see with Cigna. Now that the market has fallen quite a bit, I currently have a short-list of stocks that are worth buying for the medium and long-term and I plan to write about them over the next week or two. That said, I’m still bearish on the overall market over the next 6 months and I think there is a high probability the S&P 500 falls at least an additional -20% from here. But I don’t operate at the index level, I operate at the individual stock level, so even if the market could fall farther, when I see what looks like a good individual stock value, I buy it. So, over the next week, I will be writing a series of articles on some large-cap stocks that look like decent medium or long-term buys. Silgan (NASDAQ:SLGN) will be the first one of them.
In this article, I will take readers through the same process I went through with Cigna, with the one wrinkle that I will assume we will have a deep bear market and mild recession in the coming quarters. Other than that, my valuation process will be the same.
How Cyclical Are Earnings?
Before I begin this analysis, I always check the business’s long-term earnings patterns in order to ensure that the business is a proper fit for this sort of analysis. If the historical earnings 1) don’t have a long enough history 2) are erratic in nature, or 3) are too cyclical, then I either avoid analyzing the stock altogether or I use a different type of analysis that is more appropriate.
FAST Graphs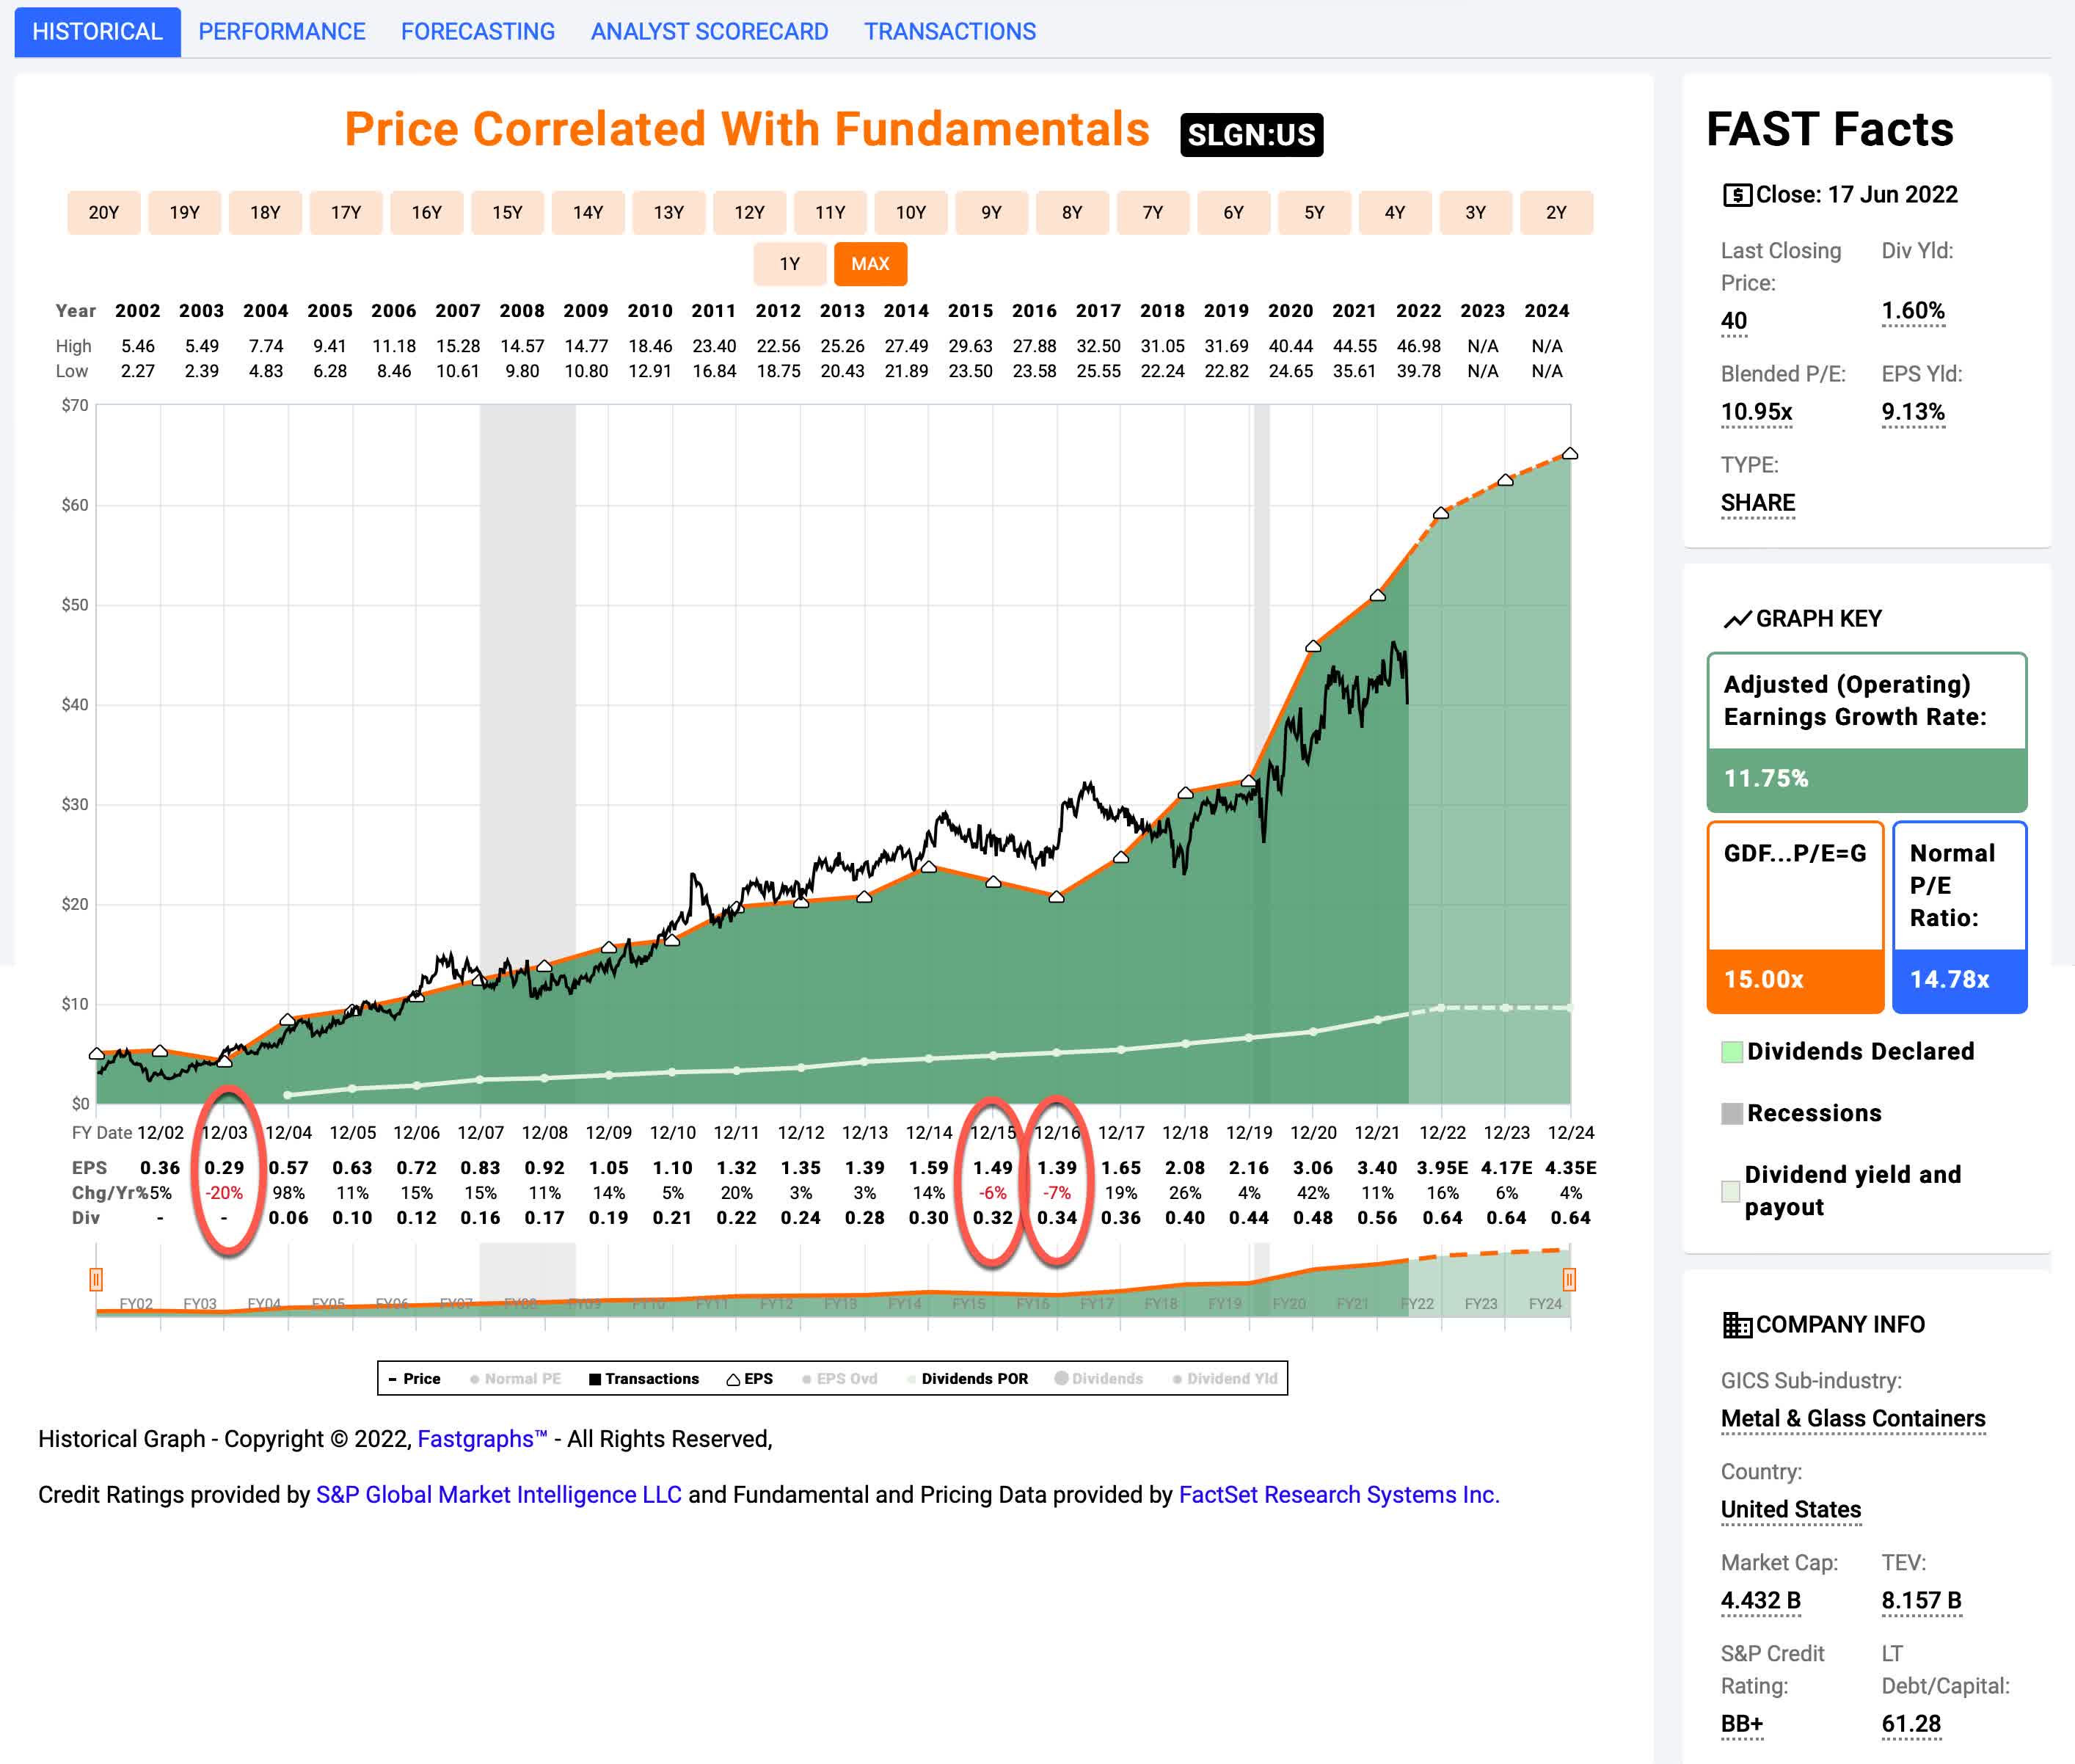
In the long-term FAST Graph above we can see that Silgan has a very good long-term track record of consistent earnings growth that goes back a full two decades. Since what I care about most in this analysis is earning’s cyclicality, I circled in red the three years in which Silgan’s earnings growth was negative. Their worst year over the past two decades was 2003 in which EPS fell -20%, with only three years total in which earnings growth fell. This isn’t particularly cyclical in my book so it’s appropriate to use the type of earnings analysis I’ll use in this article for this stock.
Market Sentiment Return Expectations
In order to estimate what sort of returns we might expect over the next 10 years, let’s begin by examining what return we could expect 10 years from now if the P/E multiple were to revert to its mean from the previous economic cycle. Since we have had a recent recession (albeit an unusual one), I’m starting this cycle in fiscal year 2012 and running it through 2022’s estimates.
FAST Graphs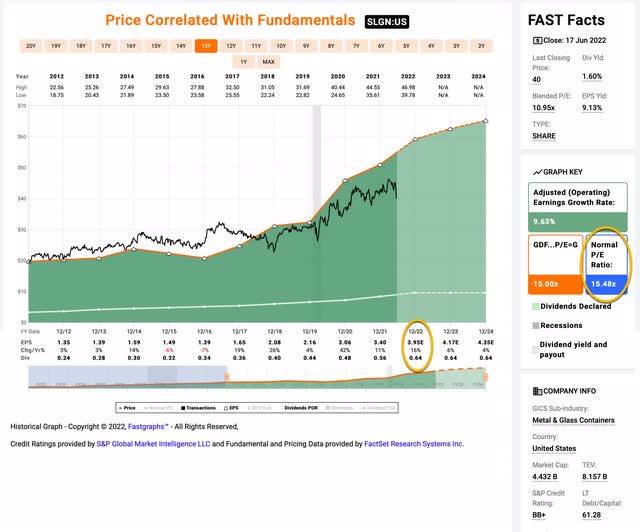
I chose the time-frame above because Silgan has had pretty fast earnings growth since 2017 and I wanted to balance that out with some of their slower growth years from 2012-2016 to produce a more conservative (realistic) earnings growth estimate and average P/E ratio.
Silgan’s average P/E from 2012 to the present has been about 15.48 (the blue bar circled in gold on the FAST Graph). Using 2022’s forward earnings estimates of $3.95 (also circled in gold), Silgan has a current P/E of 10.19. If that 10.19 P/E were to revert to the average P/E of 15.48 over the course of the next 10 years and everything else was held the same, Silgan’s price would rise and it would produce a 10-Year CAGR of +4.27%. That’s the annual return we can expect from sentiment mean reversion if it takes ten years to revert. If it takes less time to revert, the return would be higher.
Business Earnings Expectations
We previously examined what would happen if market sentiment reverted to the mean. This is entirely determined by the mood of the market and is quite often disconnected, or only loosely connected, to the performance of the actual business. In this section, we will examine the actual earnings of the business. The goal here is simple: We want to know how much money we would earn (expressed in the form of a CAGR %) over the course of 10 years if we bought the business at today’s prices and kept all of the earnings for ourselves.
There are two main components of this: the first is the earnings yield and the second is the rate at which the earnings can be expected to grow. Let’s start with the earnings yield (which is an inverted P/E ratio, so, the Earnings/Price ratio). The current earnings yield is about +9.82%. The way I like to think about this is, if I bought the company’s whole business right now for $100, I would earn $9.82 per year on my investment if earnings remained the same for the next 10 years.
The next step is to estimate the company’s earnings growth during this time period. I do that by figuring out at what rate earnings grew during the last cycle and applying that rate to the next 10 years. This involves calculating the EPS growth rate since 2012, taking into account each year’s EPS growth or decline, and then backing out any share buybacks that occurred over that time period (because reducing shares will increase the EPS due to fewer shares).
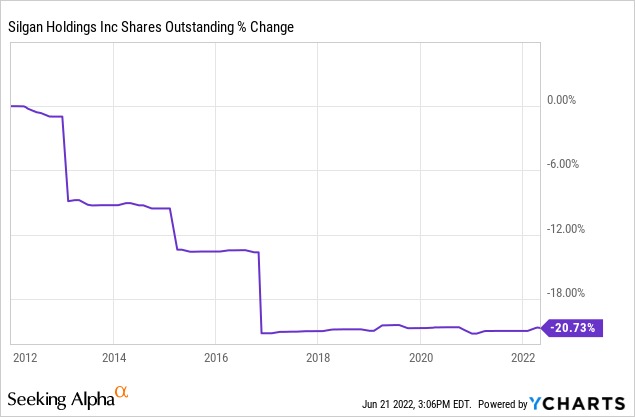
These guys have bought back about 20% of the company since 2012, and judging from the steepness of the sporadic buybacks, my guess is that they were divesting businesses over this period and then using the money to buy back shares. (Just judging from the earnings growth increase since then, it looks like it was a reasonable strategy, because earnings growth improved after 2016.) At any rate, I will take these buybacks, along with the two years of negative earnings growth during this period into account when I make my earnings growth estimates. After I do that I calculate an earnings growth estimate of +8.33% over this time period, which is a little more conservative than the FAST Graph estimate of +9.63%.
Next, I’ll apply that growth rate to current earnings, looking forward 10 years in order to get a final 10-year CAGR estimate. The way I think about this is, if I bought Silgan’s whole business for $100, it would pay me back $9.82 plus +8.33% growth the first year, and that amount would grow at +8.33% per year for 10 years after that. I want to know how much money I would have in total at the end of 10 years on my $100 investment, which I calculate to be about $256.48 (including the original $100). When I plug that growth into a CAGR calculator, that translates to a +9.88% 10-year CAGR estimate for the expected business earnings returns.
10-Year, Full-Cycle CAGR Estimate
Potential future returns can come from two main places: market sentiment returns or business earnings returns. If we assume that market sentiment reverts to the mean from the last cycle over the next 10 years for Silgan, it will produce a +4.27% CAGR. If the earnings yield and growth are similar to the last cycle, the company should produce somewhere around a +9.88% 10-year CAGR. If we put the two together, we get an expected 10-year, full-cycle CAGR of +14.15% at today’s price.
My Buy/Sell/Hold range for this category of stocks is: above a 12% CAGR is a Buy, below a 4% expected CAGR is a Sell, and in between 4% and 12% is a Hold. That makes Silgan a “Buy” at today’s price. (I take small, 1% weighted positions when using this strategy.)
An Additional Consideration: Recession P/E
The second consideration with Silgan has to do with downcycles and Silgan stock’s likely decline during a recession. Since I have judged we are currently late in the economic cycle, I prefer to not hold stocks that are likely to fall dramatically during recessions, and I have sold most of the stocks in my portfolio that have a history of deep price or earnings declines during recessions (with a few exceptions), which is what I’ve spent most of my time writing about this year.
FAST Graphs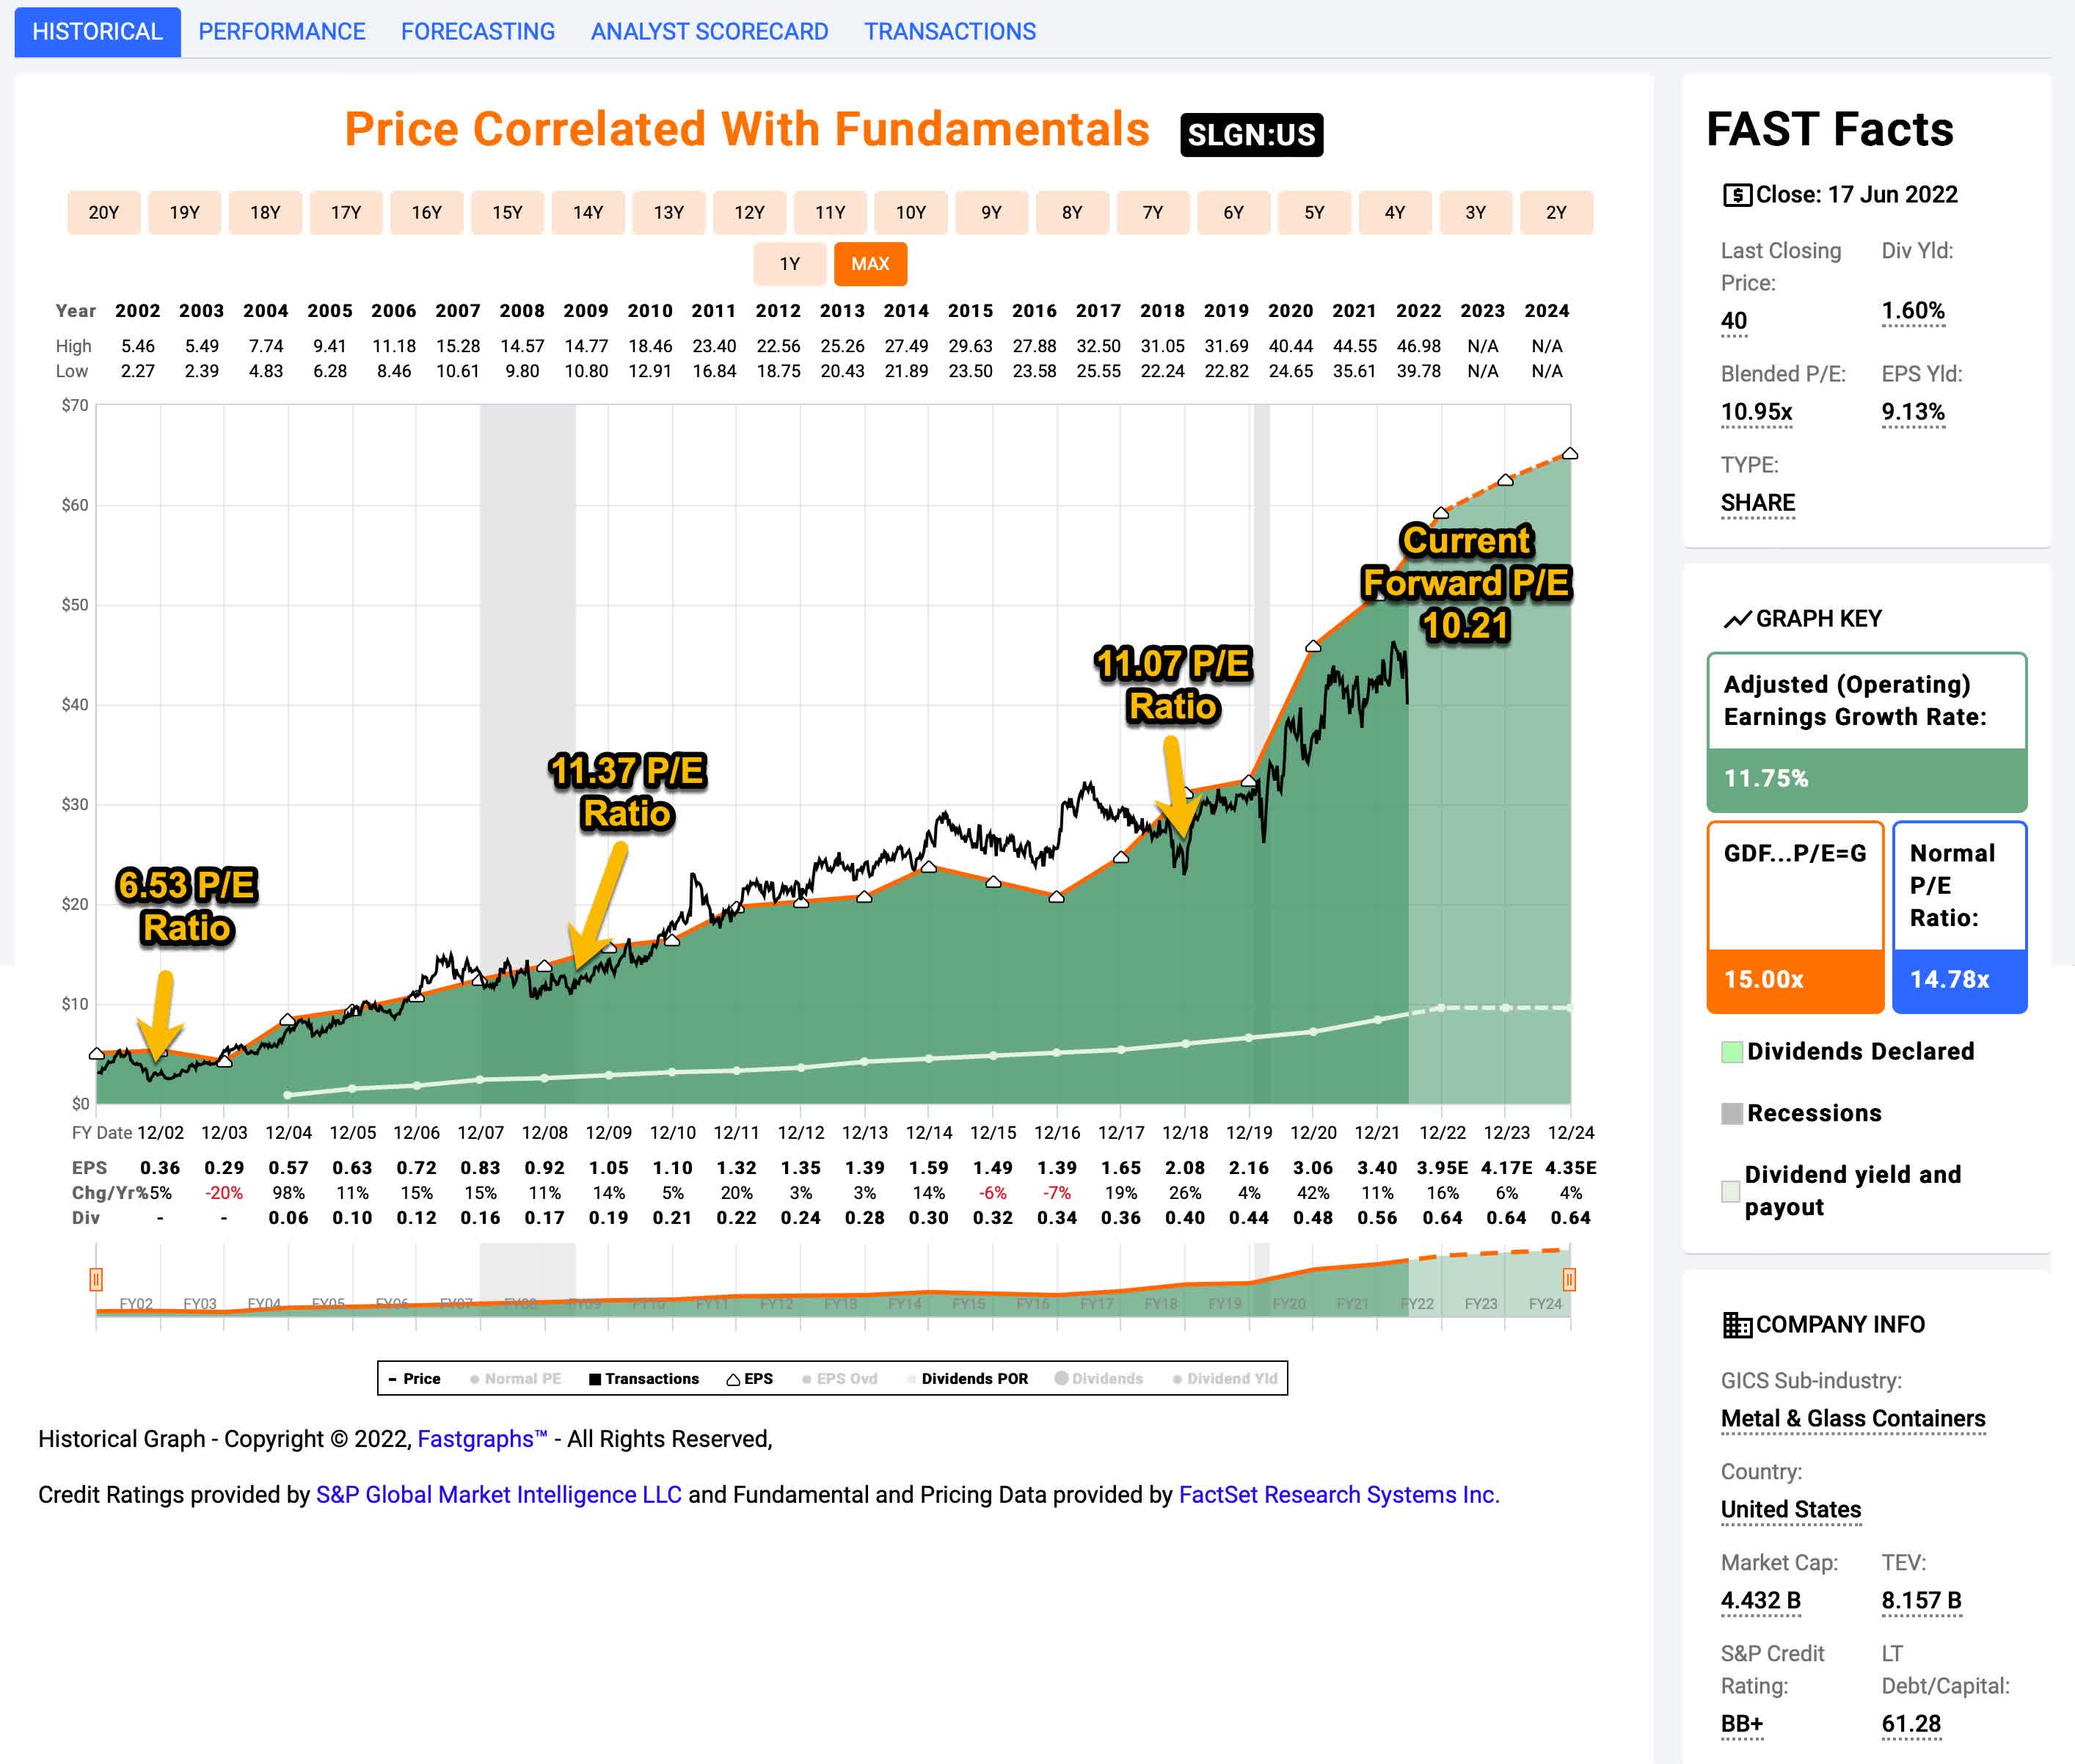
While I did mention using a recession P/E factor in my Cigna article, I noted there that usually I just aim to have the stock be within 20% of their monthly average recession P/E before I buy it, so that if they bottomed with a 10 P/E in 2008, then I wouldn’t buy until the current P/E was at least below 12. Since March, when I wrote that article, I have become more conservative due to the fact I think many analysts’ forward earnings estimates are too optimistic. As a way to counter that, I have been requiring that the stocks I buy using this strategy trade below their recession P/E ratios. So, I’m aiming for a -20% deeper discount in the stock price than in March, which is significant, but, in my opinion, a necessary margin of safety given the macro environment.
For Silgan, I have chosen to use the more recent 11.07 P/E from the December 2018 sell-off, which is actually a little lower than 2009 low of 11.37, but also higher than the 2002 low of 6.53, which I think is probably a little out of date. As I noted earlier in the article Silgan currently has a forward P/E of 10.19, which is well below the 11.07 recession P/E, and allows Silgan stock to pass this additional factor I’ve been using. For this reason, Silgan stock remain a “buy” here for a small 1% or 2% weighting in a medium or long-term portfolio.
Conclusion
When you have an unconcentrated portfolio as I do and you invest for the medium and long-term, not every stock needs to be a homerun. Two-thirds of the stocks I own I plan to hold through the current bear market. Silgan (and Cigna) are the types of stocks that I like to simply buy at good prices and hold (unless they get really overvalued for some reason). I don’t have any other exposure to the type of business Silgan has so it acts as a diversifier and hopefully a steady grower. I actually bought my personal position almost a year ago (before I was using the recession P/E factor, when I was more bullish on the economy).
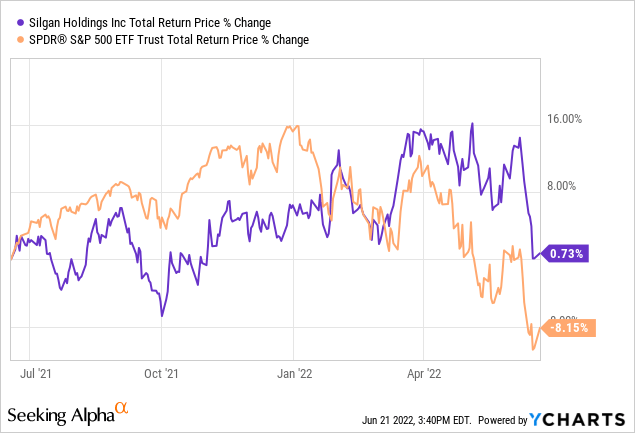
Since then, the returns of the position have been flat, but we can see that because it was purchased at a good valuation it has significantly outperformed the S&P 500 over this period. These are types of boring stocks that if purchased at the right valuation can help a portfolio produce above average returns. They aren’t sexy, and you probably won’t get rich owning them, but the odds they destroy your portfolio during a recession are very low. I mean, we have earnings that aren’t very cyclical, growing at 8% per year, and a P/E of about 10. Lots can go right with that set-up over the medium-term.
Be the first to comment