

PM Images
The Vanguard Dividend Appreciation ETF (NYSEARCA:VIG) is Vanguard’s offering in the dividend growth category. It has subtle but important differences to the Vanguard High Dividend Yield ETF (VYM).
While both funds target dividend paying companies, the VIG ETF focuses on companies that have consistently grown their dividends, whereas the VYM is focused on companies with the highest dividend yields. Overall, the VIG ETF has better long-term total returns and risk metrics. However, VYM has performed better in the past 2 years due to its higher energy exposure.
While the VIG ETF is a solid dividend growth fund on its own, I prefer the Schwab U.S. Dividend Equity ETF (SCHD) overall, as it has the highest historical returns with a sensible strategy that balances dividend yield with financial strength. SCHD also has a higher distribution yield growing at a faster pace.
Readers can read my articles on the SCHD ETF, the VYM ETF, and other dividend-focused ETFs to see how they compare to one another.
Fund Overview
The Vanguard Dividend Appreciation ETF (“VIG”) provides a low-cost vehicle for investors to gain exposure to stocks that have a record of growing their dividends. The VIG ETF currently has $68 billion in assets under management (“AUM”).
Strategy
The VIG ETF seeks to achieve its investment objective by tracking the S&P U.S. Dividend Growers Index (the “Index”), which measures the investment return of stocks that have consistently increased dividends every year for at least 10 consecutive years. The index excludes the top 25% highest-yielding eligible companies as well as REITs. Index constituents are weighted by float-adjusted market cap and have a maximum index weight of 4%. The index is reconstituted annually and rebalanced quarterly.
Portfolio Holdings
The VIG ETF holds a total of 289 stocks in its portfolio, with a median market cap of $129 billion. Style-wise, the VIG ETF skew towards large-cap blend (Figure 1).
Figure 1 – VIG Portfolio Characteristics (vanguard.com)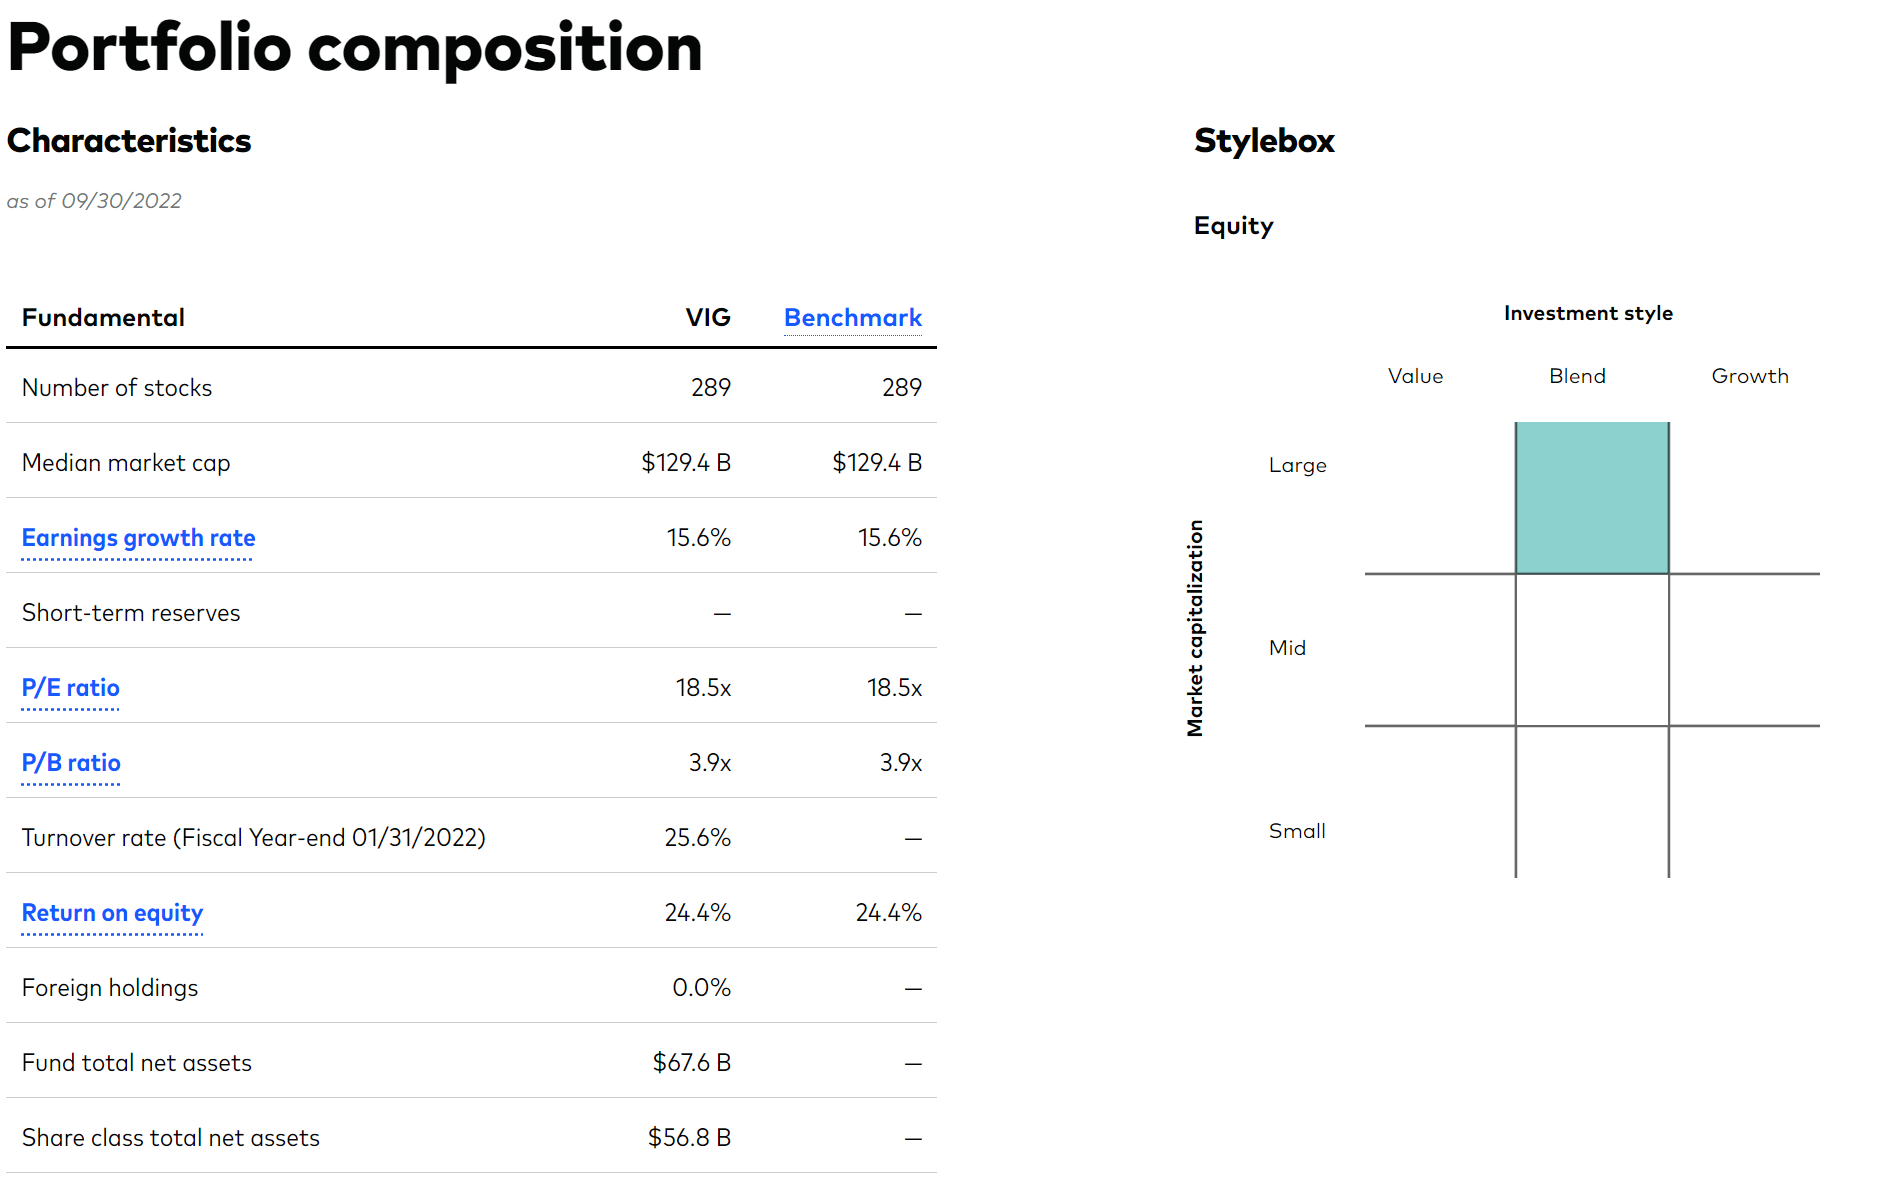
The VIG ETF has higher than market weight in consumer staples, financials, and industrials. Notably, the index has minimal weights in energy companies, as they do not meet the 10 year of consistent dividend growth criteria (Figure 2).
Figure 2 – VIG Sector Allocation (vanguard.com)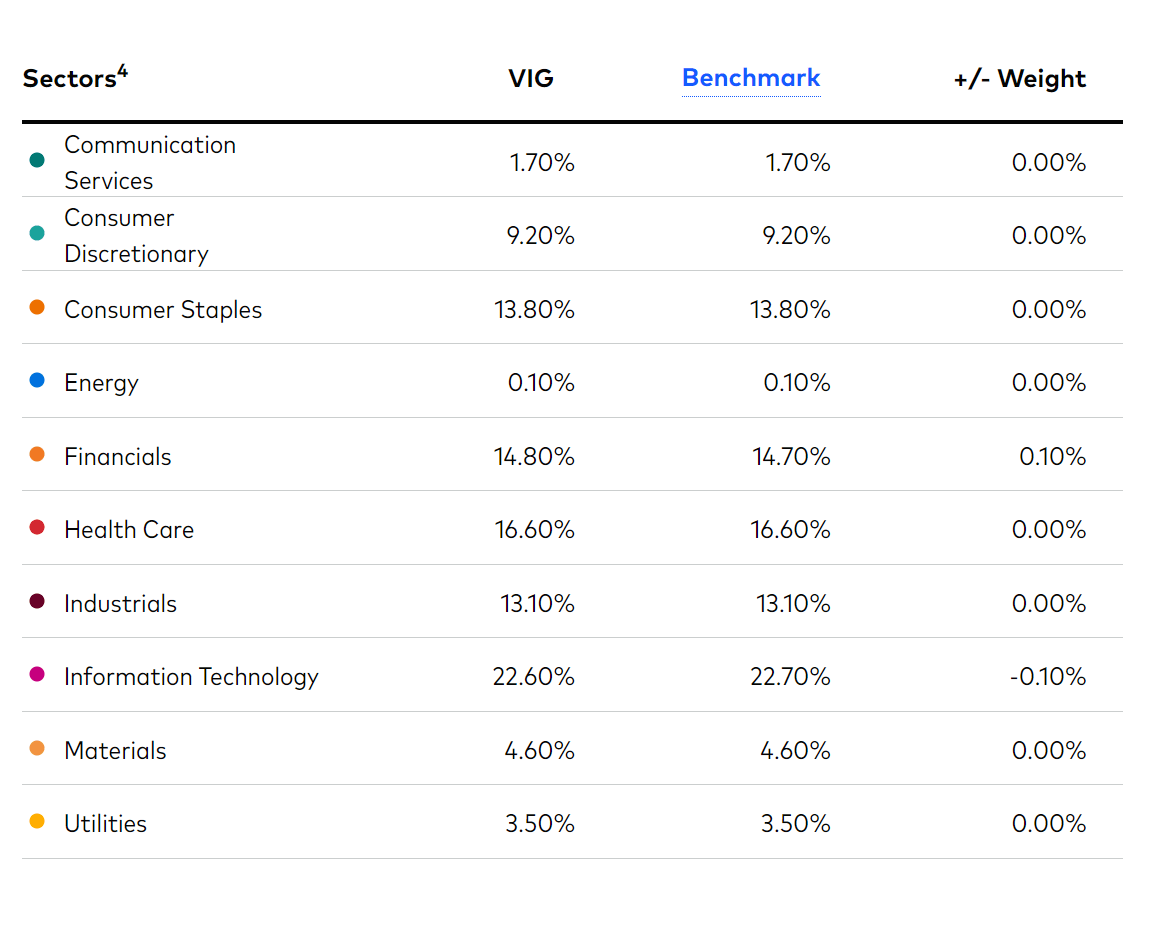
The top 10 positions of VIG constitute 29.5% of the fund and are dominated by household names such as Microsoft Corp. (MSFT) and UnitedHealth Group Inc. (UNH) (Figure 3). Interestingly, MSFT is only the 3rd largest weight at 3.73%, despite its market cap of $1.8 trillion being far higher than UNH’s $500 billion market cap and JNJ’s $443 billion market cap. This anomaly is because the index methodology caps individual weights at 4% and MSFT has underperformed UNH and JNJ since the last quarterly rebalancing.
Figure 3 – VIG Top 10 Positions (vanguard.com)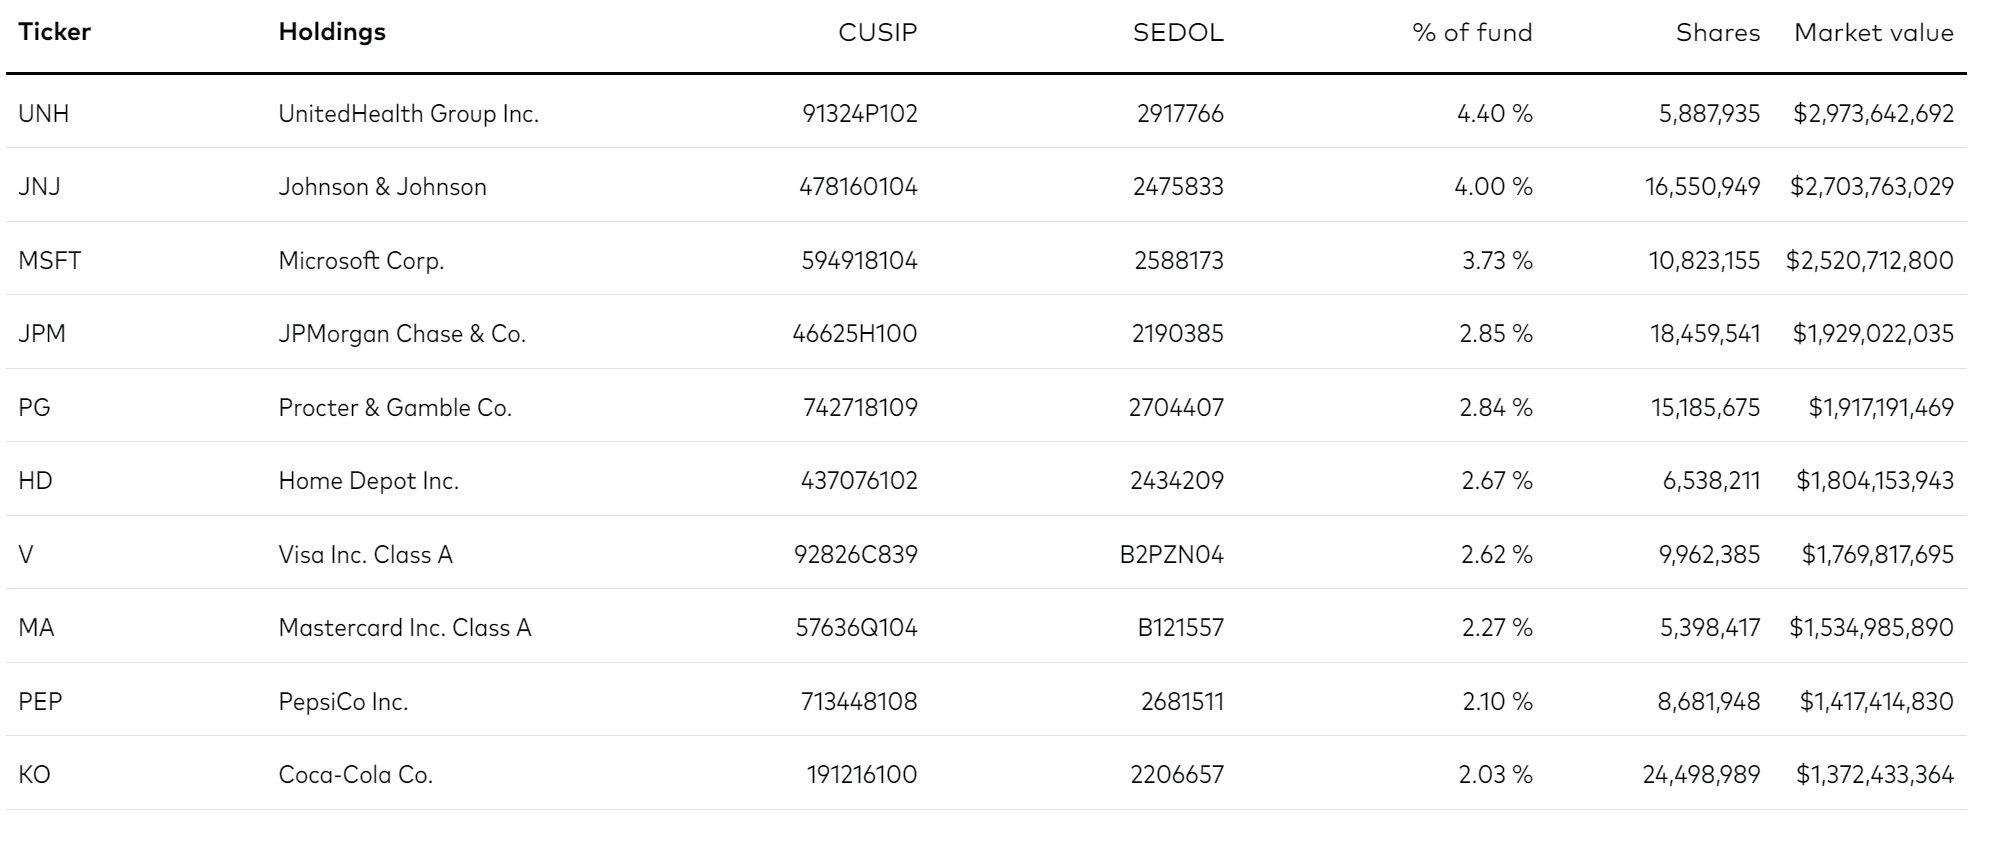
Returns
The VIG ETF has delivered solid long-term returns with 3/5/10 Yr average annual returns of 6.1%, 9.4%, and 10.7% respectively to September 30, 2022 (Figure 4). However, relative to the market, as measured by the S&P 500 Index, it has lagged slightly on the 3 and 10Yr mark. The S&P 500 has returned 8.2%/9.2%/11.7% over the same time frame.
Figure 4 – VIG Returns (vanguard.com)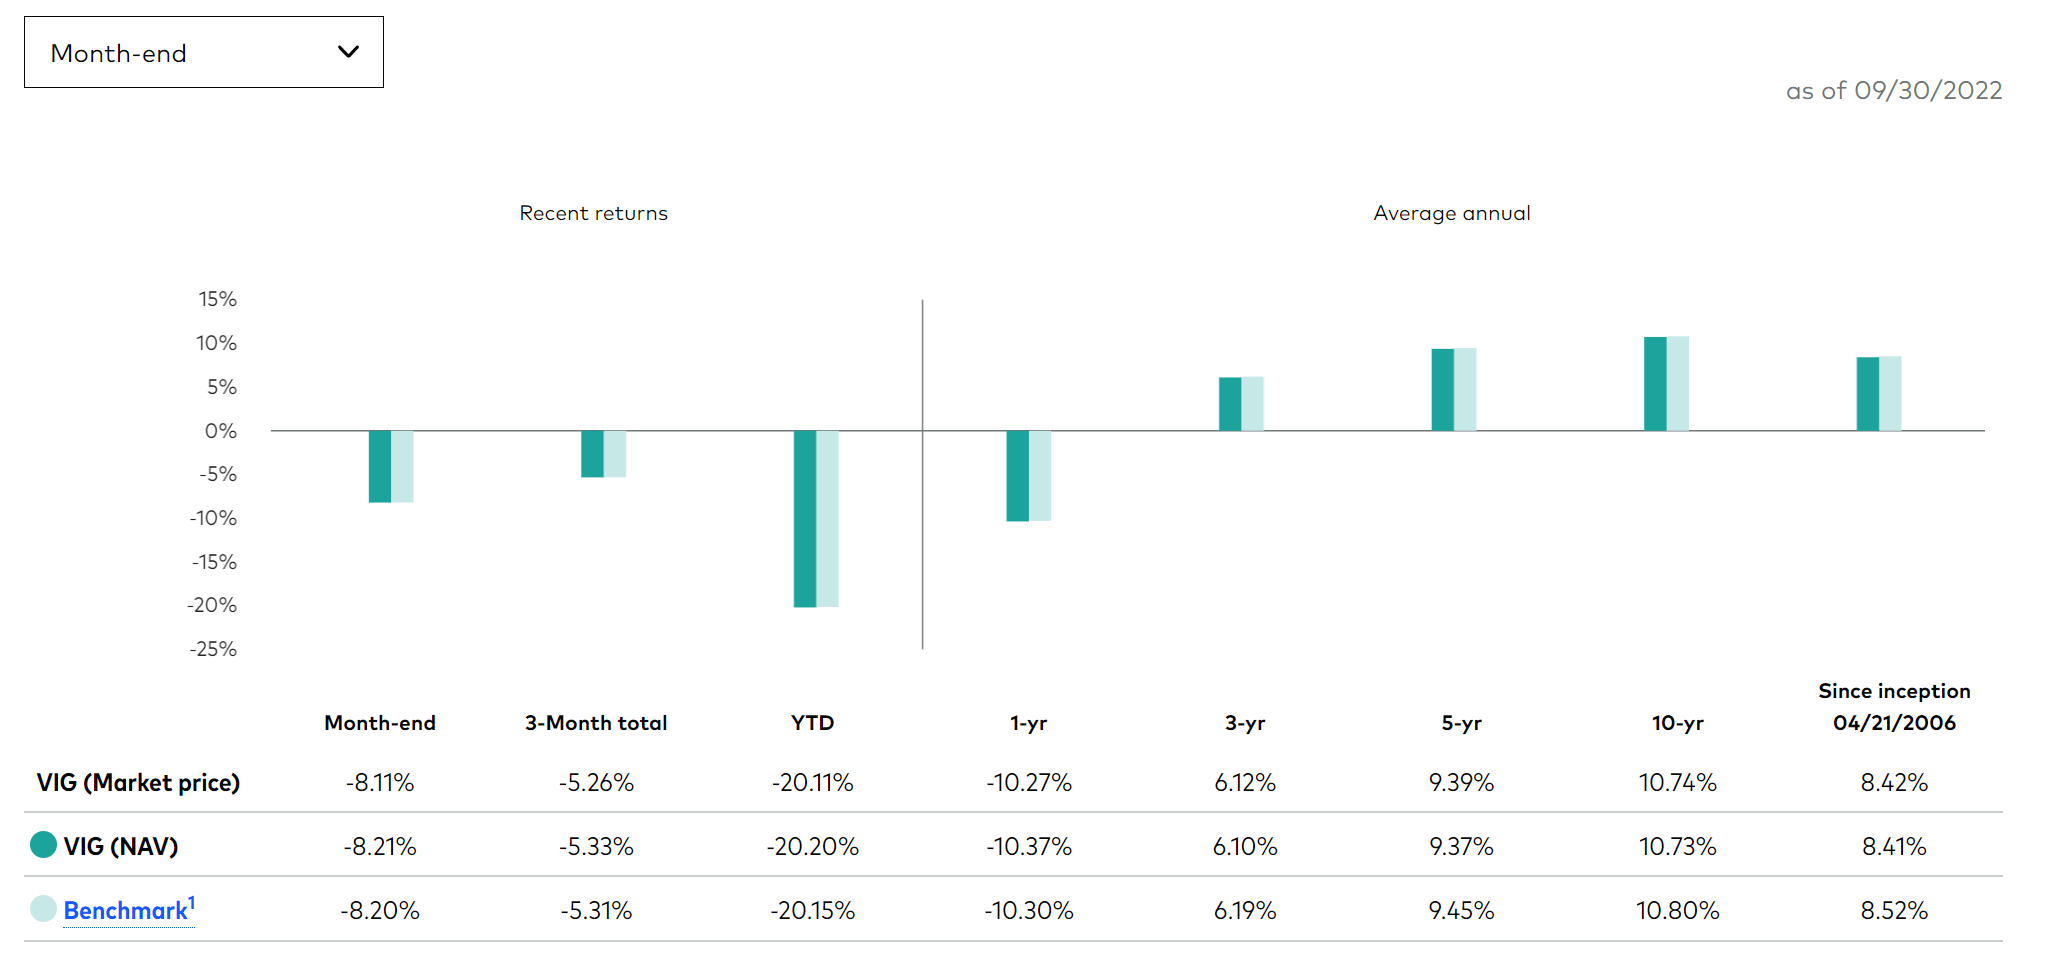
Distribution & Yield
The VIG ETF pays a moderate distribution yield of 2.0%, slightly above the market’s 1.7%. The fund’s distribution has grown at a 5Yr CAGR of 8.1% (Figure 5). VIG’s distribution is paid quarterly and is variable. It’s latest distribution of $0.715 / share was paid on September 22.
Figure 5 – VIG Dividend Growth Rate (Seeking Alpha)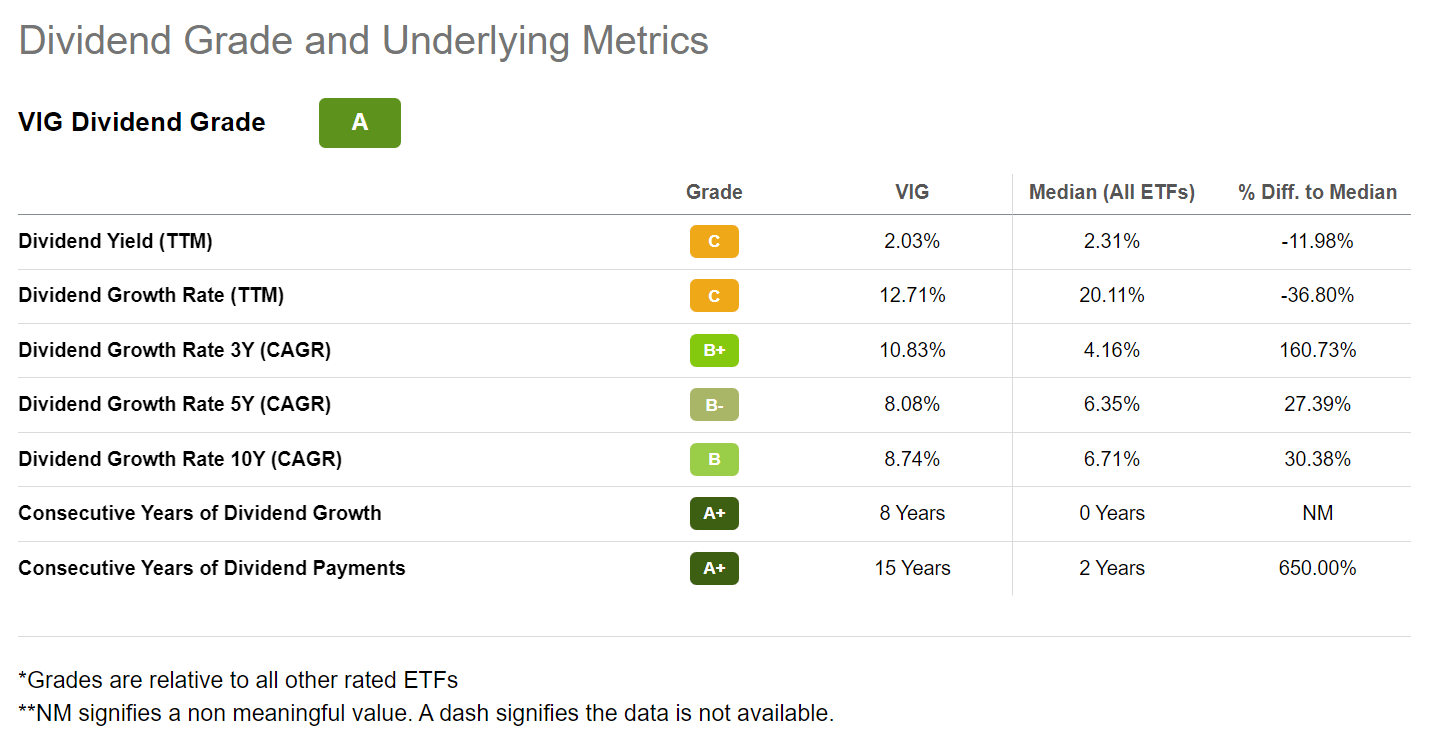
Fees
As with all Vanguard funds, one of the main selling points of the VIG ETF is its low costs. The VIG ETF only charges a 0.06% expense ratio.
VIG vs. VYM And Other Dividend ETFs
Using Portfolio Visualizer to compare between VIG and VYM, we can see that VIG has a higher CAGR return in the period analyzed (December 2006 to September 2022) of 8.3% vs. 7.3%. Max drawdown also favours VIG at 41.1% vs. 51.8%. VIG has a higher Sharpe Ratio of 0.59 vs. 0.49 for VYM.
Figure 6 – VIG vs. VYM (Author created with Portfolio Visualizer)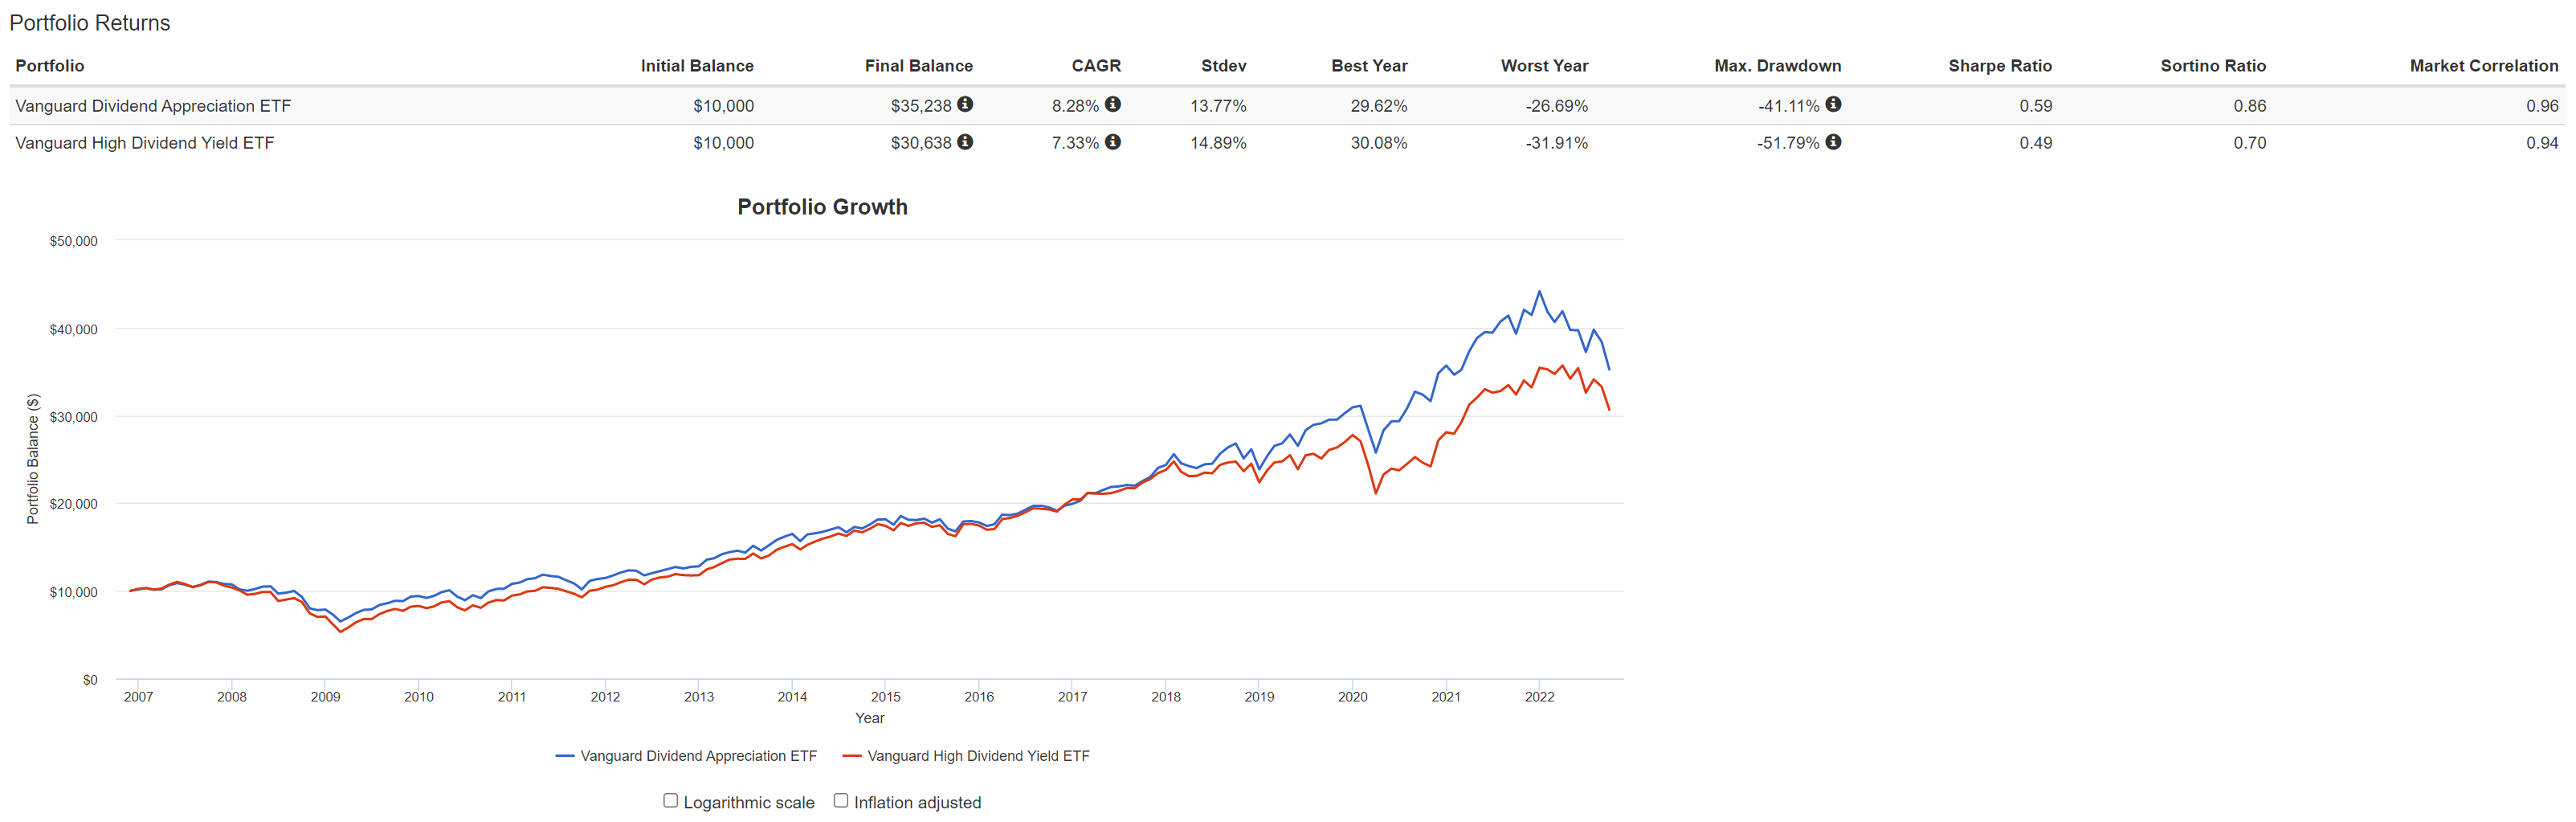
However, on shorter-term time frames, VYM has outperformed VIG in 2021 and 2022 YTD.
My main conclusion between the two funds is that if investors are focused on long-term total returns, VIG is preferable. On the other hand, VYM has a higher distribution yield, as it mainly targets stocks with the highest dividend yields.
The short-term outperformance of VYM over VIG is due to the funds’ differing energy exposures. As energy companies have had volatile earnings and dividend cuts in recent years, they have been mostly excluded from the VIG ETF’s selection criteria. In 2021 and 2022, energy stocks have staged a remarkable rebound due to high energy prices, leading to VYM’s outperformance. However, energy prices are cyclical, so VYM’s short-term outperformance may not be long-term sustainable.
VIG vs. Peer Group
Comparing the VIG ETF to other dividend ETFs using a normalized time period (November 2015 to September 2022), we can see that the VIG ETF has characteristics most resembling my current yield champion, SCHD ETF. The VIG ETF has solid long-term 5-Yr CAGR returns of 9.4% (second highest in the group), and the second best Sharpe Ratio of 0.71. However, it’s distribution yield is the lowest of the group (Figure 7).
Figure 7 – VIG vs. Peer Funds (Author created with returns and risk metrics from Portfolio Visualizer and distribution and fund details from Seeking Alpha)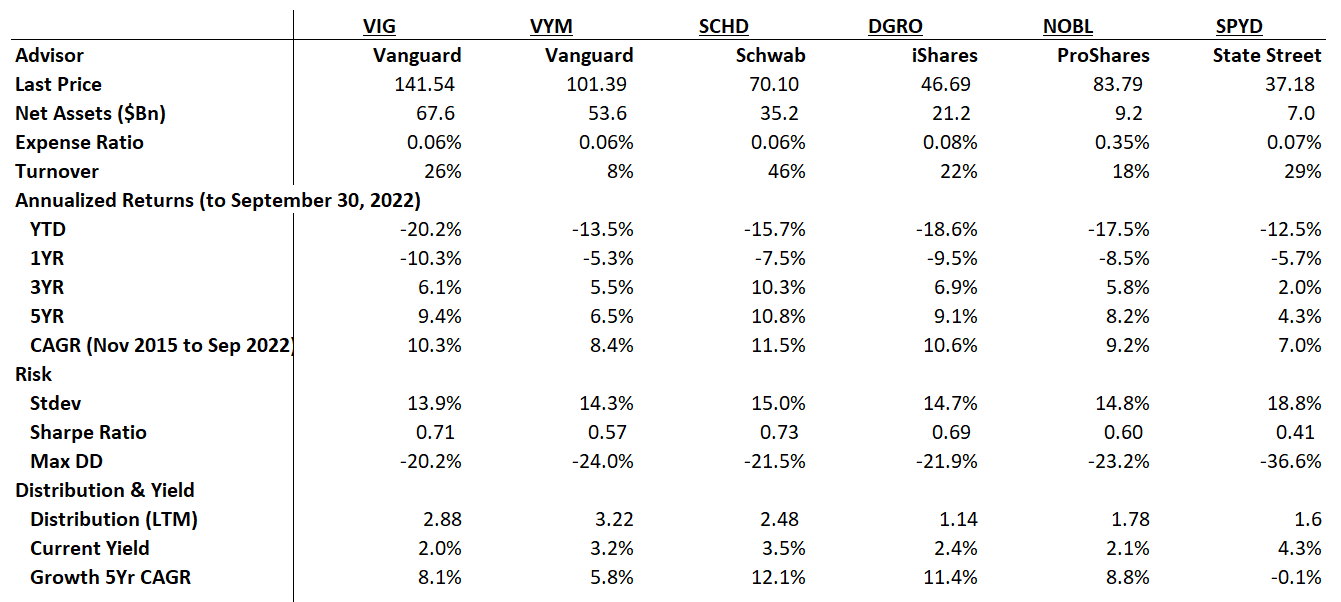
Conclusion
In summary, within the Vanguard family, I personally prefer the VIG ETF over the VYM ETF. VIG has better long-term total returns and risk metrics. VYM’s better short term performance is due to the difference in energy exposure, which can be a double edged sword as it had been a detractor in prior years.
Comparing the VIG ETF to a wider set of dividend-focused funds, I believe SCHD remains the better dividend growth fund overall, as it has the highest historical returns and best risk metrics. SCHD also has a higher distribution yield growing at the fastest pace. The SCHD methodology focuses on high dividend yields balanced by financial strength.
Be the first to comment