

Various fixed-income assets bore the brunt of serious risk aversion and air pockets of liquidity last week. In this article, we touch on the high-yield muni space which saw a wild ride alongside record-high outflows. The VanEck Vectors High-Yield Municipal Index ETF (HYD) closed on Friday at a 12% discount amid trading volume 300% higher than normal. We think this is clearly overdone and think HYD can appeal to both tactical and strategic investors who may be able to take advantage of both discount tightening as well as the potential recovery in NAV.
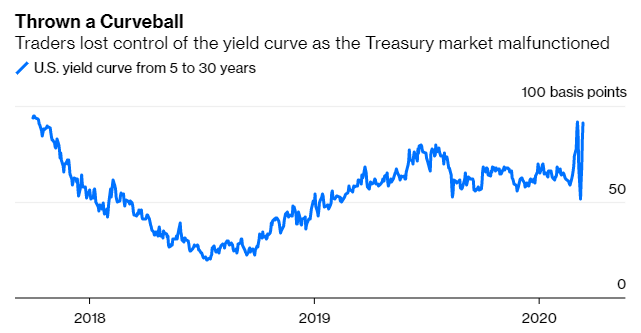
The broader fixed-income market effectively malfunctioned at the end of last week, driving various dislocations across the asset space. Even the most liquid US Treasury bond market behaved oddly, with volatility on the 10-year note approaching financial-crisis highs. The shape of the yield curve oscillated wildly as the backend plunged and then zoomed up.
Source: Bloomberg
As the Treasury market whipsawed, the normally staid and boring municipal bond market was anything but. Even as yields on Treasuries dropped, yields on municipal bonds rose higher.
In the chart below, we plot the yield-to-worst of four different S&P indices: three municipal indices and the Treasury bond index. We can see this divergence in the most recent data, with municipal yields rising while Treasury yields fell.
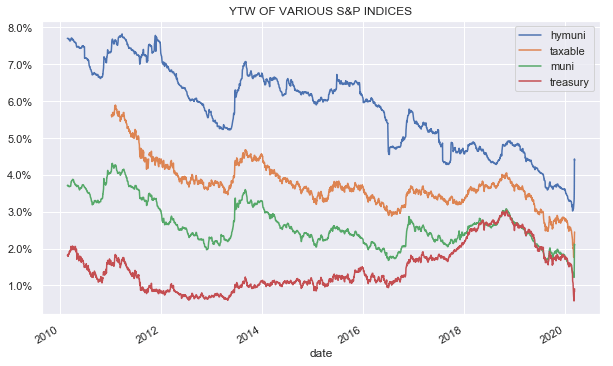
Source: ADS Analytics LLC, S&P
To get a clearer picture, we plot the yield differential of the three municipal indices versus the Treasury index. We can see a clear spike in the most recent data which drove the differentials to multi-year highs.
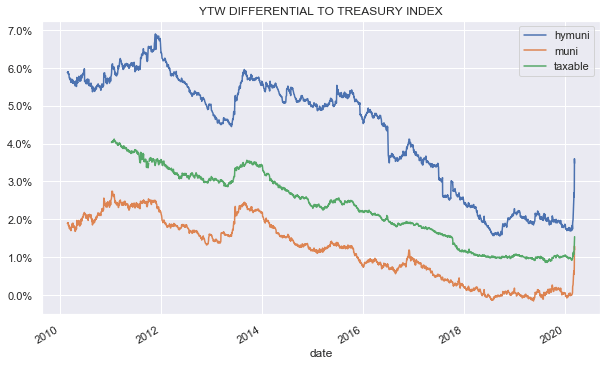
Source: ADS Analytics LLC, S&P
In a way, the yield differential hides how meaningful the recent moves have been because overall risk-free yields are so much lower now than they were even a few years ago. To address this, we also plot the yield ratios in the chart below.
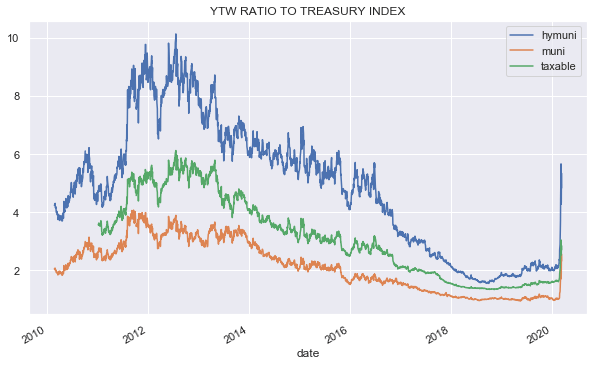
Source: ADS Analytics LLC, S&P
This kind of market behavior suggests serious capitulation on the part of some muni investors alongside air pockets of liquidity. The charts suggest that the high-yield municipal bonds were particularly hard hit. Fund flow data shows that high-yield muni funds lost $1.7bn during the week – the most since 1992, according to Lipper.
Another way to show the extremes of the moves, we plot the total returns of three popular municipal funds:
- iShares MBS ETF (MBB)
- Invesco Build America Bond Portfolio ETF (BAB)
- The VanEck Vectors High-Yield Municipal Index ETF (HYD)
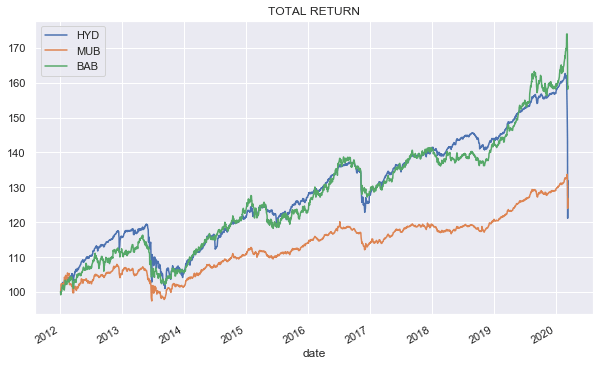
Source: ADS Analytics LLC, S&P
Finally, we zoom in on total returns over the past week showing that HYD lost 18% on the month. With the S&P 500 index down just over 20% currently and the high-yield market off about 10% from its recent high, this kind of move just doesn’t make sense to us.
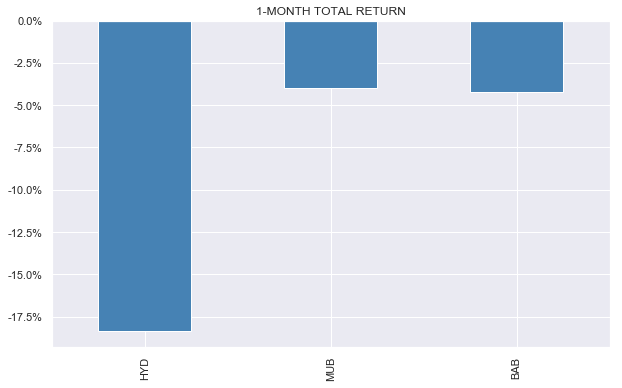
Source: ADS Analytics LLC, Tiingo
It is true, of course, that high-yield municipal bonds are by and large revenue rather than general obligation bonds. This means they do not rely on the full faith and credit of the local government and its power to levy and raise taxes. Instead, they rely on the revenue stream of a particular project. To compensate for this, revenue bonds typically offer a higher yield alongside various security features such as land liens.
Another point to keep in mind is that many revenue bonds are not rated and the default rate of unrated bonds is much higher than that of rated bonds. This makes it difficult to get one’s bearings around historic default rates as those only apply to bonds with ratings.
We do expect that the current medical crisis in the US will likely shift the usage patterns of local infrastructure projects. People will likely drive less which will lower revenues of toll roads, healthcare facilities may come under serious strain and educational institutions may sit idle. So it does make sense that high-yield munis should underperform; however, in our view, the current level of underperformance goes beyond what is reasonable.
Normally, we would seriously consider active alongside passive options. However, the current 12% discount in HYD offers an attractive opportunity, in our view.
As far as the management fee, HYD charges 0.35%. In terms of credit quality, HYD is 30% investment-grade. The fund has less than 10% allocated to single-B rated bonds and below. The not-rated bucket is a bit more than a third of the fund.
The NAV of HYD closed at $61.07 on Friday with the price at $53.49 which is a 12% discount. The largest discount over the past 5 years appears to be around 3% so the current discount is 4 times larger.
Conclusion
The current period of volatility and illiquidity in fixed-income markets is causing some unusual divergences. The high-yield muni market has seen record outflows which has driven the price of high-yield muni ETFs sharply lower and has opened up a wide discount to NAVs, in excess of many closed-end funds. In our view, this is a potentially fast-moving opportunity which may be attractive to both tactical as well strategic investors who are attracted by both the discount as well as the depressed NAV.
Check out Systematic Income and get access to our unique suite of interactive tools that uncover the fund markets (CEFs, ETFs and mutual funds) as well as preferred stocks and baby bonds.
Follow our systematic allocation framework for a rational top-down and bottom-up approach to income investing that highlights the most attractive sectors, fund types and individual funds.
Follow along with activist CEF investors, track UNII and coverage metrics, check out our target-yield portfolios and systematic strategies, slice and dice funds – and much more.
Check us out on a no-risk basis – sign up for a 2-week free trial!
Disclosure: I/we have no positions in any stocks mentioned, but may initiate a long position in HYD over the next 72 hours. I wrote this article myself, and it expresses my own opinions. I am not receiving compensation for it (other than from Seeking Alpha). I have no business relationship with any company whose stock is mentioned in this article.
Be the first to comment