

nespix
Written by Nick Ackerman, co-produced by Stanford Chemist. This article was originally published to members of the CEF/ETF Income Laboratory on July 18th, 2022.
Price is what you pay, and the distribution is what you get, or something like that. I think of that when buying Reaves Utility Income Fund (NYSE:UTG). The lower the price, the better. However, the primary goal is steady and rising distributions. At least historically, we’ve been gifted with a rising distribution. We are enjoying an attractive rate with a distribution yield of 7.3% already.
Since our last visit to UTG, we’ve been on quite the wild ride. The total returns of the fund have outperformed the S&P 500 and come in slightly positive. The S&P 500 isn’t an appropriate benchmark but can give us some context. This is a long-term core position for me. I’m always going to be partially bullish and not overly concerned with trying to trade in and out with this position.
Performance Since Previous Post (Seeking Alpha)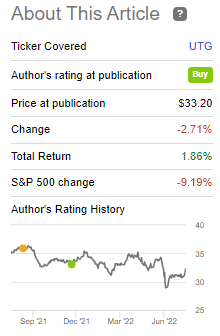
As a utilities-oriented fund, it was a place of defensiveness at the start of this year. That was before the latest plunge in June took utilities and energy down with it. Since then, July provided a strong rally to raise utilities back into positive territory. The sector is still enjoying some relatively strong performance compared to most other sectors and the broader market.
Of course, the broader market these days is more tech-oriented. With tech in a funk, suffice it to say, the “market” will also perform rather lackluster. Though the weakness in tech really stands out when comparing the Nasdaq 100 Index and the S&P 500. For comparisons, we’ll use Invesco QQQ (QQQ) and SPDR S&P 500 (SPY). Strong returns in July have helped take some of the losses, but still down meaningfully.
Sector Performance (Seeking Alpha)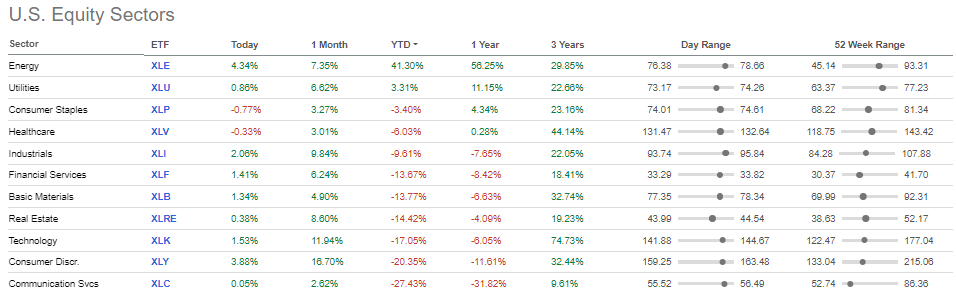
The Basics
- 1-Year Z-score: -0.43
- Premium: 0.34%
- Distribution Yield: 7.06%
- Expense Ratio: 1.04%
- Leverage: 17.62%
- Managed Assets: $2.554 billion
- Structure: Perpetual
UTG’s strategy is to “invest at least 80% of its total assets in dividend-paying common and preferred stocks and debt instruments of companies within the utility industry.” While they leave the door open for greater diversification across asset types, they primarily and consistently focus on equities. This can be positive as equities generally provide greater returns for the risks taken over the longer term.
The fund is lightly leveraged, relatively speaking. Despite the modest amount of leverage, they are still subject to interest rate impacts. As rates rise higher, their leverage expenses will rise. This rate was based on OBFR plus 0.80%. (OBFR is the Overnight Bank Funding Rate.) It was previously LIBOR plus 0.80%.
However, as of April 27th, 2022, they now borrow at SOFR plus 0.65%. (SOFR being Secured Overnight Financing Rate.) It’s still based on a floating rate but a small decrease from the prior agreement. It also bumped up its borrowing capacity to $650 million from $455 million.
The fund’s expense ratio comes to 1.22% when including leverage expenses. That was actually a small decline from the 1.23% it was previously. Looking back over the last five years, fiscal 2019 reached a high expense ratio of 2.06%. In the last six-month report that we are looking at, the interest on the loan was $2.049 million. We can compare that with the six-month period from the prior year, where the interest on the loan came to an expense of $1.644 million.
In fact, total expenses overall climbed to $13.606 million compared to $11.071 million. The reduced expense ratio was a result of the fund growing over that period of time in assets.
Performance – Slight Premium Puts The Fund At A Historically Normal Level
UTG isn’t lacking in size. In fact, it appears the fund has accumulated more assets since we touched on the fund. That is despite turning in a negative NAV performance in roughly 8 months.
Ycharts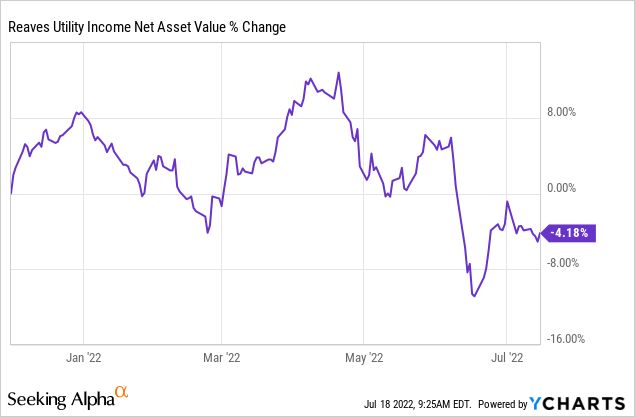
This is possible because the fund trades at a premium. When the shares of a CEF trade at a premium, they can benefit from the DRIP and from an at-the-market offering. That is where shares are sold into the market throughout the trading day. That resulted in nearly 3.25 million new shares being created over the last six months. It was over 11.135 million shares in its last full fiscal year. Smaller amounts were attributed to the DRIP, but that still results in the fund staying larger because that cash is reinvested back into UTG.
UTG Share Transactions (Reaves)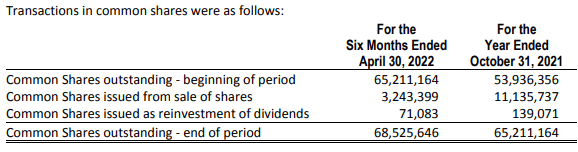
As a reminder, since these shares are created at a premium to the NAV, they can be accretive to the fund. That means new and old investors benefit from creating these new shares. Or, at the very least, they aren’t negatively impacted. With the fund at only a slight premium generally, the accretion isn’t going to be anything significant.
Over the last decade, the fund had averaged a discount of 2.77%. However, over the last several years is where the fund began trading at a premium. Given a shorter time frame, we can see that this is generally where the fund trades.
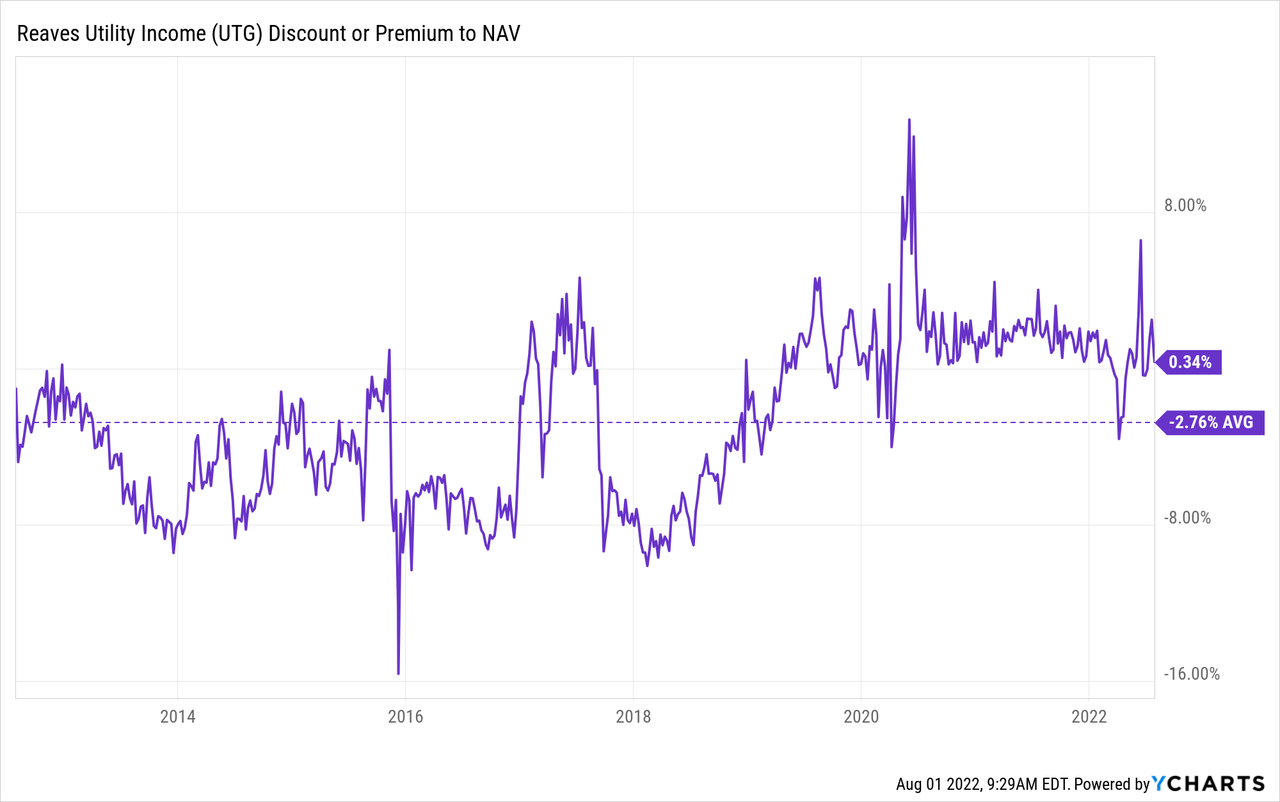
That puts it at a level where it might not be a strong buy, but nor is it a sell either. In my opinion, I think it is still okay to buy shares at this level.
Distribution – Attractive And Growing
UTG is one of only a handful of funds that have an inception pre-GFC (2008/09) without cutting their distribution. In fact, they have been raising their payout to investors over the years. The last raise they put in was in mid-2019.
UTG Distribution History (CEFConnect)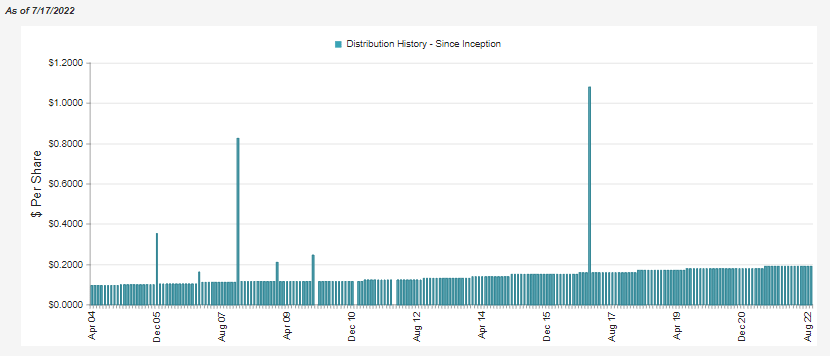
That was even when the fund wasn’t a particularly strong performer. The below are price and NAV returns only. That’s stripping out the performance when including the distributions.
Ycharts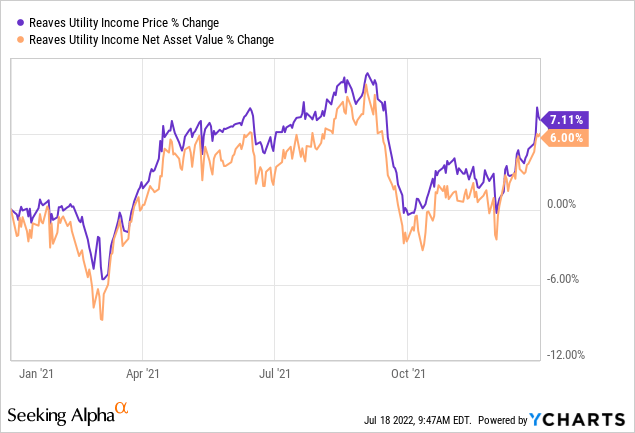
The fund will rely extensively on capital gains to actually fund its distribution. One thing about CEFs, though, is that they don’t have to “fund” anything. They can resort to return of capital to maintain distributions for a period of time. That results in a more regular payout to investors without worrying about a change month to month or quarter to quarter.
There is also a sizeable amount of unrealized capital gains built into the fund that they can draw from. These are obviously subject to change daily as the market changes. At the end of October 31st, 2021, they listed an unrealized appreciation of $410 million.
We also have cash coming in from selling the new shares via the ATM. That resulted in over $107.554 million in cash being raised in this report. In the prior fiscal year, it was over $373.409 million, 2.88x the total distributions paid out to shareholders.
UTG Semi-Annual Report (Reaves)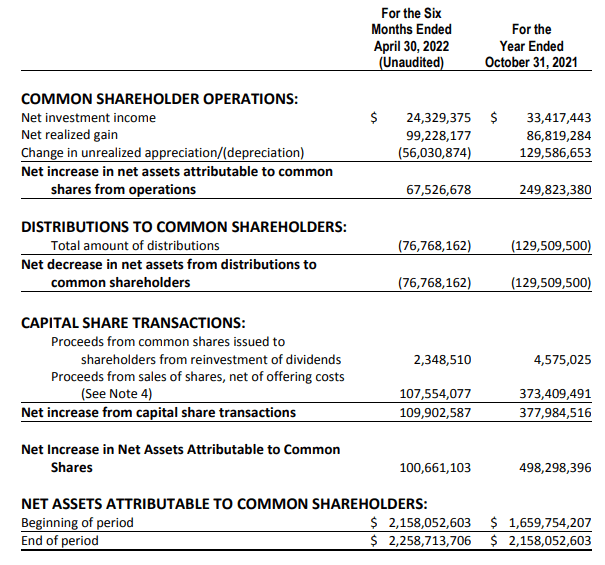
These sources might not be sustainable ways of paying the distribution over many years, but they can be relied upon for a short period to keep the rate steady. We also have to realize that these are actively managed funds. They will be carrying winners and losers in any market environment. It is just that when we are in a down market, those winners become harder to find. They are there, though.
I’d also note the positive development that NII and NII coverage has jumped in the last six months being reported above. If the NII figure here was extrapolated out for the remainder of the fiscal year, we would have seen NII climb 31.3%. NII coverage was 25.8% for the last fiscal year and is now 31.7%. To be certain, that’s still a shortfall that will result in capital gains being required for long-term sustainability, but helpful nonetheless.
This is also an increase from the year-ago six-month period. NII at that time was $18,267,684. That’s a jump of 33.18% from the comparable reporting periods.
For tax purposes, in 2021, the fund’s largest contributor was consistent with what we see in the earnings. That is, most of the distribution is being taxed at longer-term capital gains rates. A meaningful portion of the ordinary income is going to be qualified, which further is tax-advantageous.
UTG Tax Breakdown (Reaves)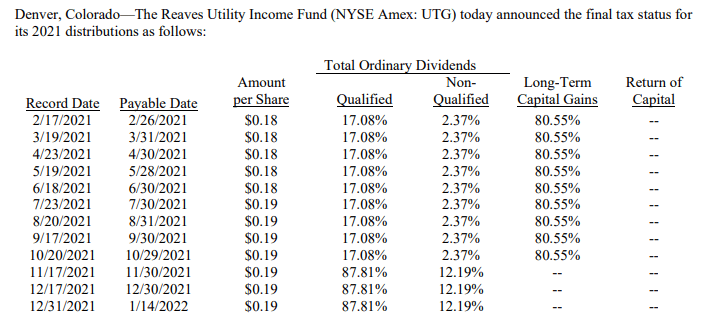
UTG’s Portfolio
The portfolio doesn’t change drastically, but there are some changes from time to time. This is pretty consistent with what we would expect. The turnover rate of the fund came in at 21% in the last six-month period.
The overall industry breakdown places the largest emphasis on utility companies and telecommunication services – which are essentially utilities if you think about it. Then we have a slice of REIT holdings. Following that, we have various other investments in the infrastructure space.
UTG Sector Weighting (Reaves)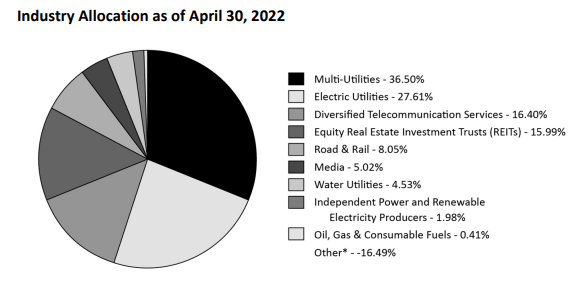
Within that REIT category, we see some of the infrastructure REITs that are consistent with the investment policy of UTG. The tower REITs, American Tower Corp (AMT) and Crown Castle International (CCI), are two of the popular ones. Both are holdings of the fund. We also have SBA Communications (SBAC) in the portfolio.
One name that is a bit surprising to see here is Realty Income (O). While one of the most popular and widely discussed REITs is a bit unusual in the UTG portfolio, this is simply because it doesn’t really fit the utility/infrastructure narrative that the fund leans towards. In my opinion, retail operations aren’t seen in the same category. That being said, the regular and growing dividends it provides the fund is a nice kicker.
Looking at the top ten names in the portfolio, we see a few differences from the previous largest holdings listed. Some of the changes are the positions just gyrating around due to weighting changes. Though, not all positions. Positions such as American Water Works (AWK), TELUS (TU) and Exelon (EXC) have fallen off.
UTG Top Ten (Reaves)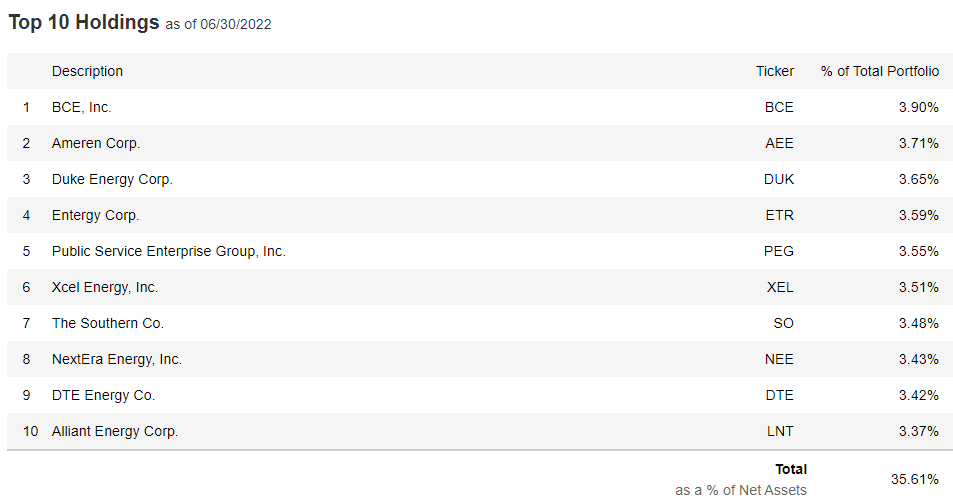
The top position previously was NextEra Energy (NEE). NEE has been having a tough time this year as renewable energy focus takes a backseat. BCE (BCE) has popped up to the largest position in the fund. Here was the performance of the positions within the reporting period. NEE and AWK were the weakest, which reflects why the positions have declined or been removed from the top ten holdings. (The EXC spike in January in the below chart is an error.)
Ycharts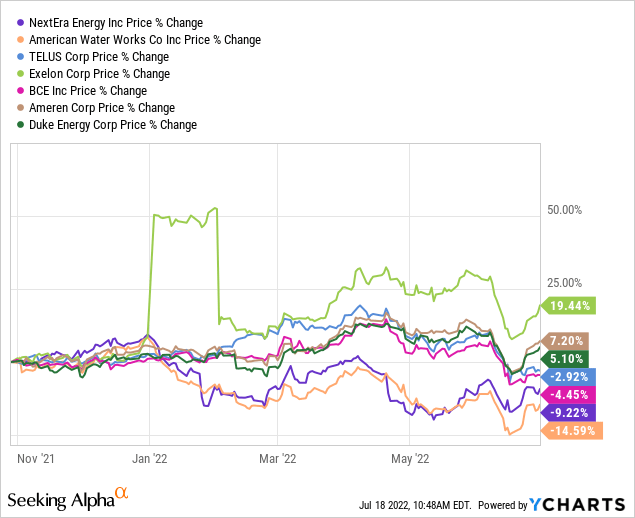
I’d also note the fairly large allocation the top ten represent for the fund. They carry only around 40 positions overall, making it a fairly narrowly held group of investments. The concentration of the top ten is up only an insignificant amount from the prior 34.48% weighting.
Conclusion
UTG continues to be a strong fund to consider for a long-term investor. The slight premium doesn’t appear to be out of character with the fund’s more recent historical level. Longer-term, the fund had traded at a slight discount but would suggest that discount expansion wouldn’t be significant from these levels. Of course, that’s only history, which is subject to changing circumstances. The fund benefits from issuing new shares through its ATM and, to a lesser degree, the DRIP. The utility space is a bit elevated at this time, but the fund is only operating with moderate leverage. If things decline substantially, they appear to be in a position with the capacity to take advantage of whatever comes by.
Be the first to comment