

vm
Utilities are often thought of as a stodgy sector, but in uncertain, volatile years like 2022, this sector can add some defense to your portfolio. After Energy, the Utilities sector remains the 2nd leading sector in 2022, and over the past year, ahead of the Consumer Defensive sector:
Hidden Dividend Stocks Plus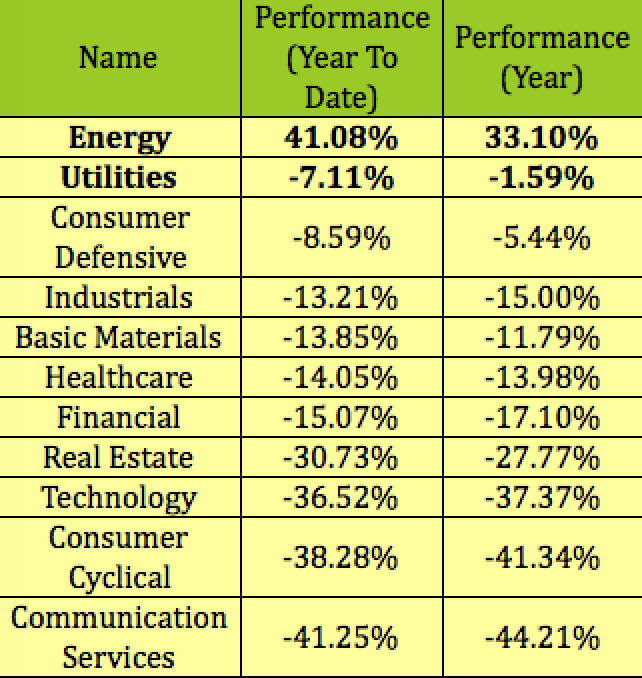
Rather than trying to stock pick, you can get broader Utilities coverage via utility funds, such as the Reaves Utility Income Fund (NYSE:UTG), which is a closed-end fund, a CEF.
Profile:
“The Fund’s objective is to provide a high level of after-tax total return consisting primarily of tax-advantaged dividend income and capital appreciation. It intends to invest at least 80% of its total assets in dividend-paying common and preferred stocks and debt instruments of companies within the utility industry.
The remaining 20% of its assets may be invested in other securities including stocks, money market instruments and debt instruments, as well as certain derivative instruments in the utility industry or other industries.”
(UTG site)
The fund has a long track record, having IPO’d on 2/24/2004. It has $2.36B in Net Assets, with 44 holdings, (up from 41 in July ’22), and a 1.23% expense ratio. Its average daily volume is 245K, (up vs. 240K in July ’22).
Management uses some leverage, which was at 19.03% as of 11/8/22, down a bit vs. 21.24% in early July 2022.
Hidden Dividend Stocks Plus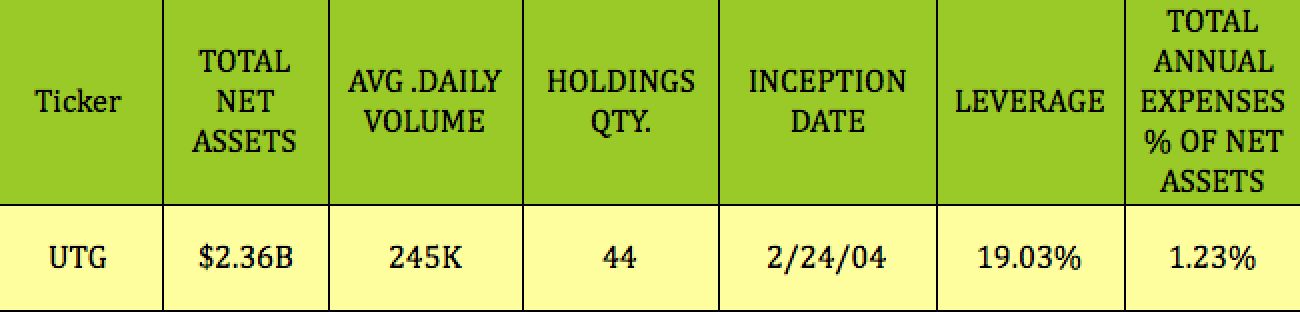
Monthly Distributions:
Management pre-announces each quarter’s distributions – they stuck with $.19/share for October, November and December – it has been at $.19 since July 2021, when they raised it from $.18/share. The 5-year distribution growth rate is 3.81%. UTG should go ex-dividend next on 11/17/22, with an 11/30/22 pay date.
Hidden Dividend Stocks Plus
UTG has paid out $1.1B to shareholders since its 2004 inception. Since 2015, its distributions have mostly come more from long term capital gains:
UTG site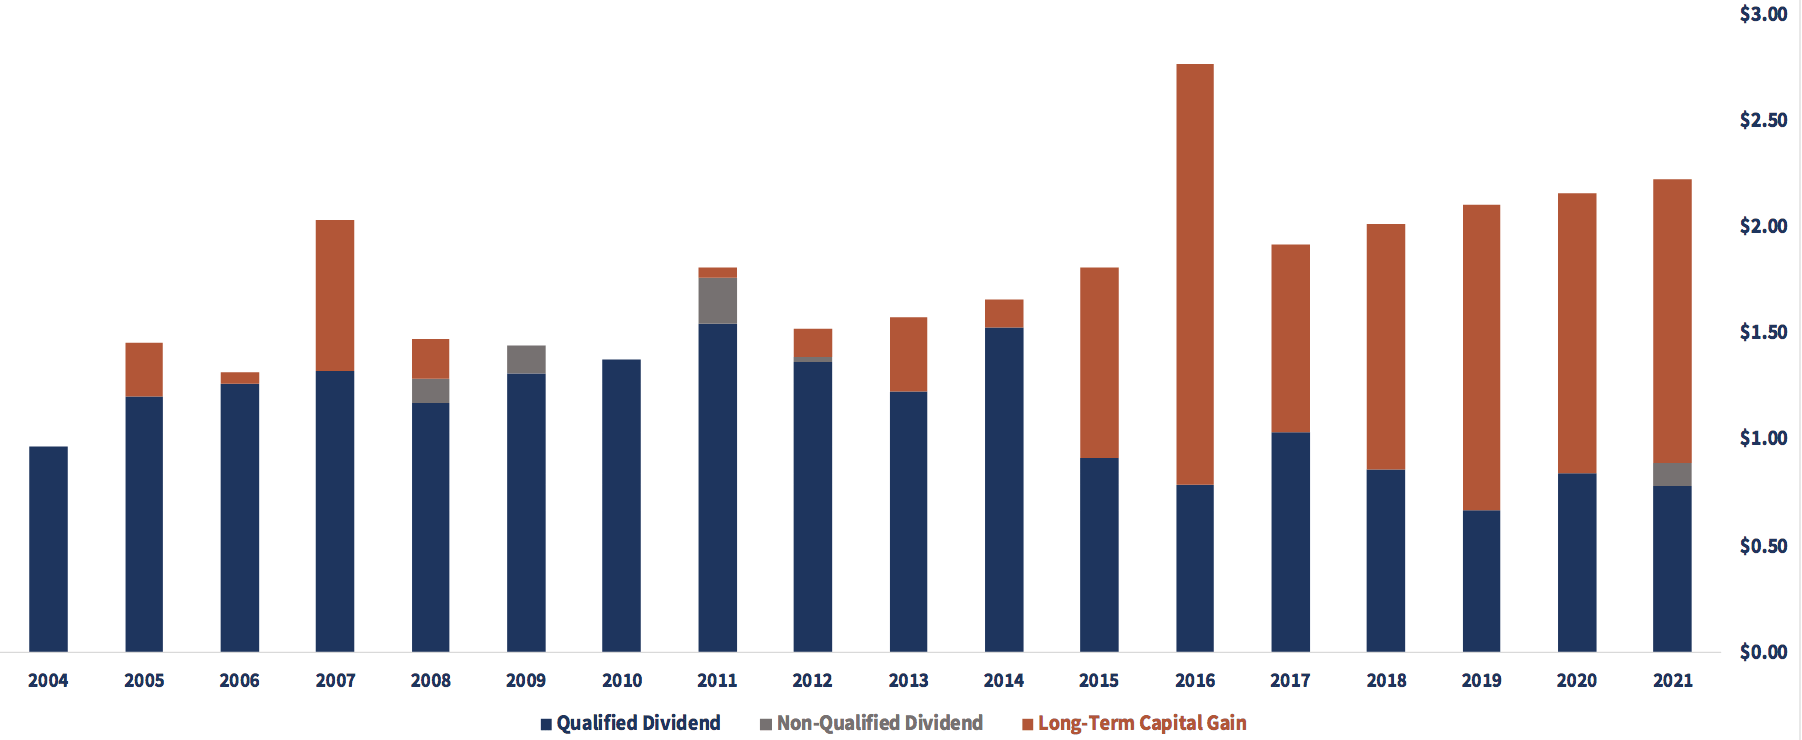
UTG’s distribution coverage for the 6 months ending 4/30/22 was 1.61X:
UTG site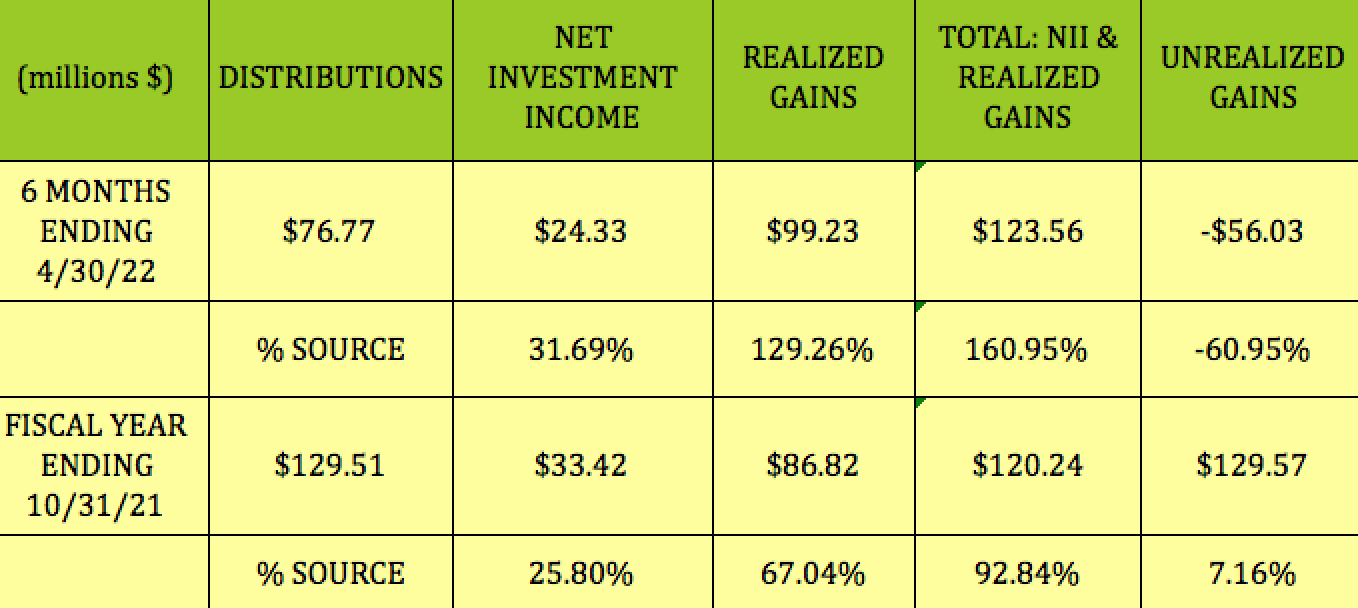
Taxes:
UTG’s fiscal year ended on 10/31/22. Its fiscal year distributions were comprised of ~29% in Net Investment Income (NII) and ~71% in Long Term Capital Gains:
UTG site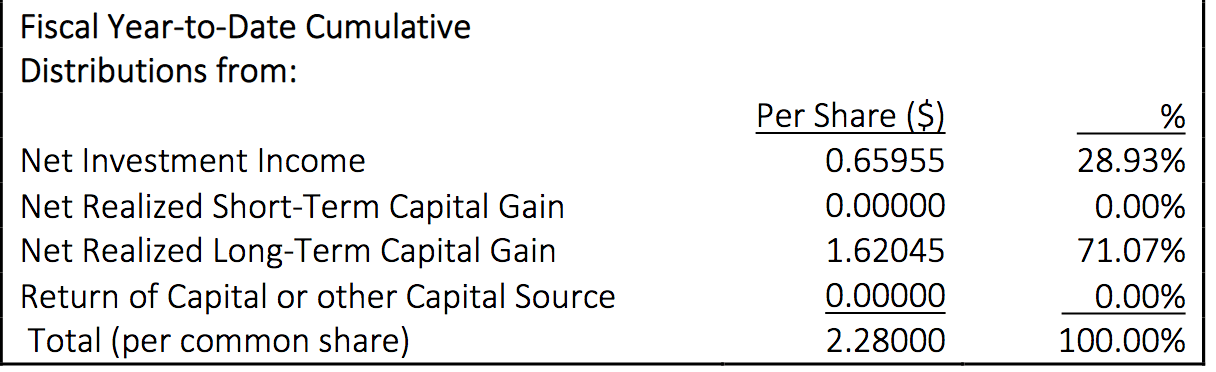
Holdings:
As you’d expect, Utilities are the top sector exposure, at ~65%. Next is Communications Services, at 16.5%, which hasn’t helped UTG’s performance in 2022, as this sector is down ~-41%.
UTG also holds 9% in Real Estate and 6.6% in Industrials, with ~98.5% of its holdings US-based.
UTG site
There were no major changes in UTG’s top 10 holdings since early July ’22, although BCE fell from the top spot, at 4.16%, to #4, at 3.67%, as of 9/30/22. The top 10 makes up ~40% of UTG’s portfolio.
UTG site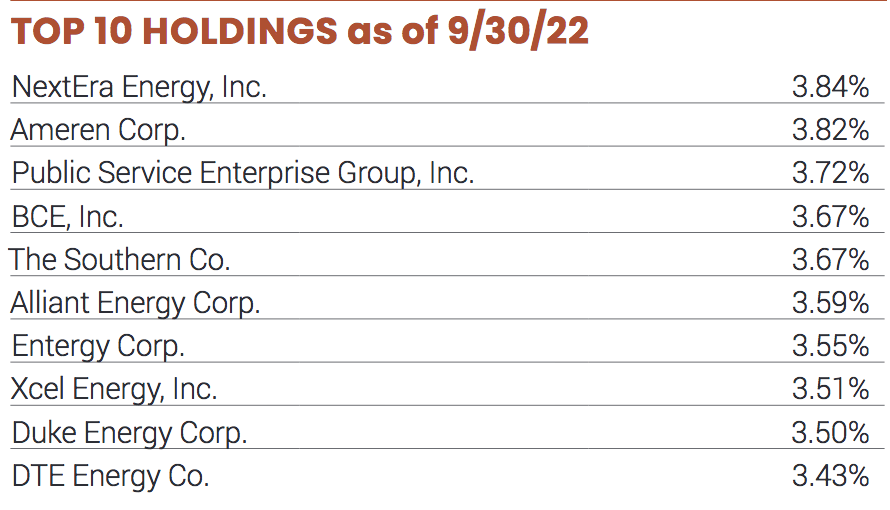
Valuations:
Since NAV/share is calculated at the end of each trading day, you have to look at the most recent closing values to determine the current NAV discount or premium.
Buying CEFs like UTG at a deeper discount than its historical average discounts/premiums can be a useful strategy due to mean reversion.
At its 11/8/22 closing share price of $28.06, UTG was just about even with its NAV/share of $27.95. That’s slightly cheaper than its 1-year average premium of 1.02%, and its 3-year 1.32% average premium, but more expensive than its 5-year -0.76% discount.
Hidden Dividend Stocks Plus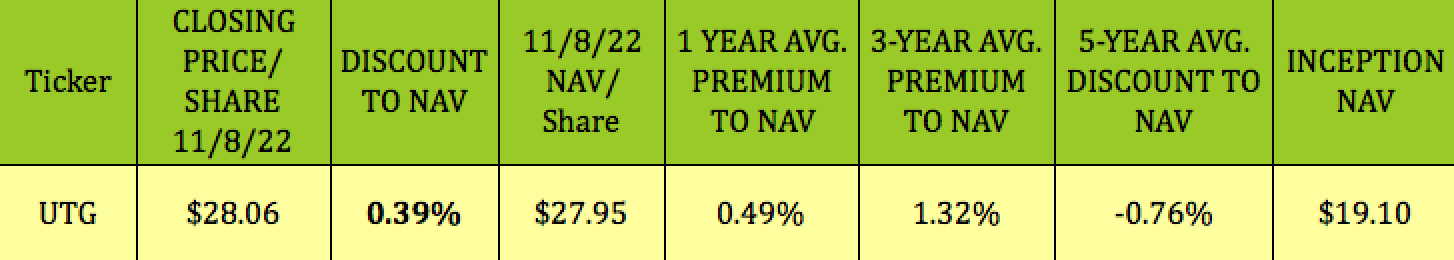
Performance:
UTG has a bit higher of a dividend yield than its sister fund, Cohen & Steers Infrastructure Fund (UTF), and has outperformed UTF over the past month, while lagging it somewhat over the past quarter, year, and year to date.
UTG’s 1-year total return is ~-8.58%, which is much better than the S&P 500’s -16.9% loss, but it trails the broad Utilities sector’s 3.15% 1-year return.
Hidden Dividend Stocks Plus
UTG outperformed the Morningstar US Equity CEF Sector in 2014 – 2016, and in 2018 – 2019, but has lagged it in 2021 and 2022 on a price and NAV basis:
UTG site
Looking back over the past 10 years shows UTG’s total return on $10K very close to that of XLU, until ~2022, when the 2 funds’ returns diverged, with UTG then trailing XLU.
Still, UTG’s much higher distribution yield formed the majority of its average 12%/year 10-year return, which is why it’s favored by income investors:
ycharts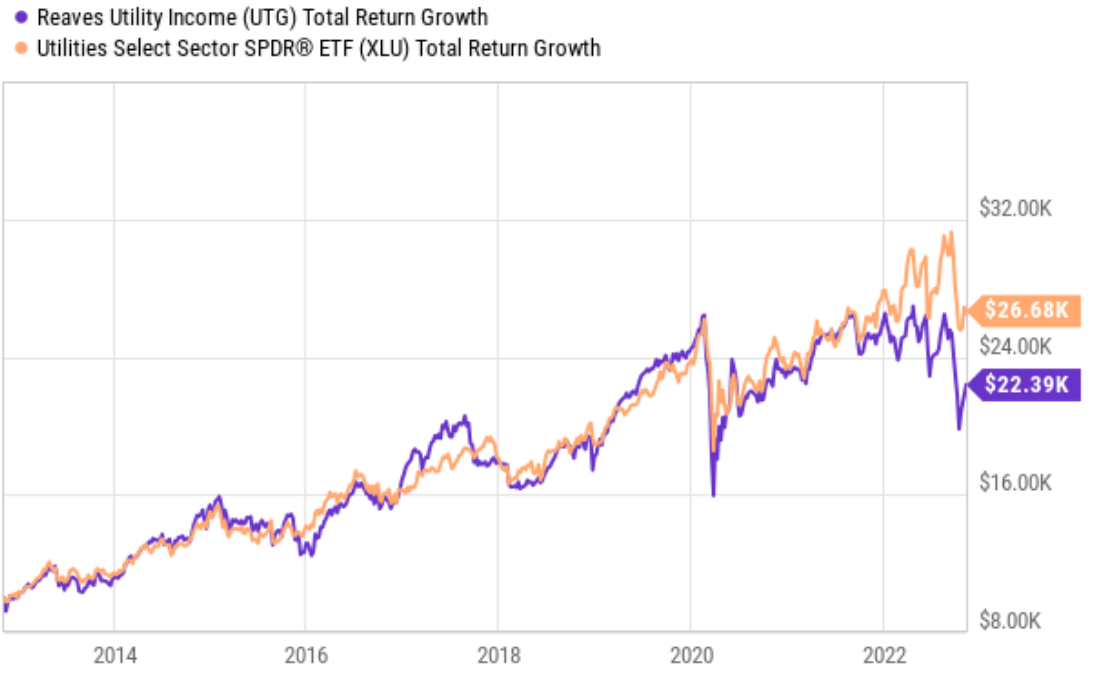
Parting Thoughts:
When you compare it to the broad Utilities sector, UTG’s sector diversification has hampered its performance over the past year – it only has 2% in Energy, and its Communications Services, Real Estate, and Industrials holdings have all lost ground in 2022 and over the past year. Hopefully, management will have better luck with their non-Utilities sector choices in 2023.
We suggest adding UTG to your watch list, and trying to buy it a cheaper Price/NAV when you see a more meaningful discount.
If you’re interested in other high yield vehicles, we cover them every weekend in our articles.
All tables furnished by Hidden Dividend Stocks Plus, unless otherwise noted.
Be the first to comment