

DKosig
Written by Nick Ackerman, co-produced by Stanford Chemist. This article was originally published to members of the CEF/ETF Income Laboratory on October 2nd, 2022.
Despite the fact that there has been a general widening of discounts during the market’s latest volatility, Cohen & Steers Infrastructure Fund (NYSE:UTF) has remained rather resilient. The exposure to utilities and essential infrastructure has helped the fund avoid all of the downward pressure when compared to the broader market.
However, the fund’s premium itself has been holding up. That’s a bit unusual as we have seen the overall closed-end fund space start to experience discount widening once again. A couple of the sister funds of UTF themselves have experienced this. Cohen & Steers Quality Income Realty Fund (RQI), just one example, has now pushed to around an 8.5% discount compared to the ~3% premium of UTF.
Naturally, that seems to reflect the defensive nature of utilities and infrastructure overall. Real estate has been experiencing quite the bloodbath going through 2022. Thus, investors seem more swayed to bail on a REIT-focused fund, more so than a utility/infrastructure play.
With our previous update earlier this year, UTF was at a discount at the time. This expanding valuation since that time has helped to prop up the fund’s share price returns more than it otherwise would. Still, the fund has experienced losses that haven’t been able to be totally avoided. That means that a recovery in the overall market would still likely help push this fund higher. Due to the valuation, though, the fund still looks more like a hold rather than a buy rating.
Additionally, the fund has posted a new semi-annual report since our update, so we can get an updated look at what’s going on under the hood.
The Basics
- 1-Year Z-score: 1.23
- Premium: 3.20%
- Distribution Yield: 8%
- Expense Ratio: 1.32%
- Leverage: 27.54%
- Managed Assets: $3.45 billion
- Structure: Perpetual
UTF’s objective is
“total return, with an emphasis on income through investment in securities issued by infrastructure companies.” They define infrastructure companies as those that; “typically provide the physical framework that society requires to function on a daily basis and are defined as utilities, pipelines, toll roads, airports, railroads, marine ports and telecommunications companies.”
This leaves them fairly free to invest in just about any infrastructure or utilities they would like, anywhere in the globe and in any part of a company’s capital structure. We see this hybrid allocation show up, but the fund does lean towards equity positions regularly.
Similar to the majority of CEFs, this fund utilizes leverage. Despite the drop we’ve seen in the fund’s assets due to the decline in the market, the leverage ratio isn’t too elevated yet. Additionally, a concern can come from the higher expenses as interest rates rise. Since they borrow through a credit facility, the borrowing rates are generally subject to variable rates.
In this case, they are spread above LIBOR. However, Cohen & Steer’s managers have taken positions to keep most of their borrowings based on a fixed rate. This is through fixed-rate borrowings that were negotiated and interest rate swaps. They’ve done this across the suite of their funds that has helped hedge the higher interest rates.
For UTF, around 85% of the fund’s borrowings are fixed-rate financing. The weighted average rate on that portion is 2.7%. At the time of this semi-annual report, the variable rate was still lower at 2.6%. This would have increased since that time as it was for the period ending June 30th, 2022. The Fed has hiked interest rates even further since. At this point, the variable rate should be higher. Thus, the hedges should be benefitting UTF compared to if they didn’t take these actions.
UTF Leverage Facts (Cohen & Steers)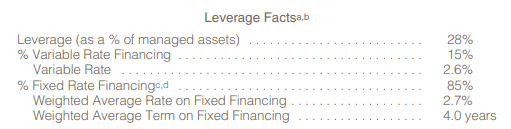
The expense ratio is around average for a CEF. When including leverage expenses, it comes to 2.05%. Which is notably lower than last fiscal year’s reported 2.19% – despite the higher interest rates.
Performance – Elevated Valuation
When looking at the fund’s performance on a YTD basis, we can see that the fund has held up better than the broader market. For that, we are using the S&P 500 SPDR (SPY) for context. I’ve also included the Utilities Select Sector SPDR (XLU) for some context as well. I think that helps illustrate one of the reasons that UTF itself is holding up better, thanks to a pretty heavy weighting in utilities.
YCharts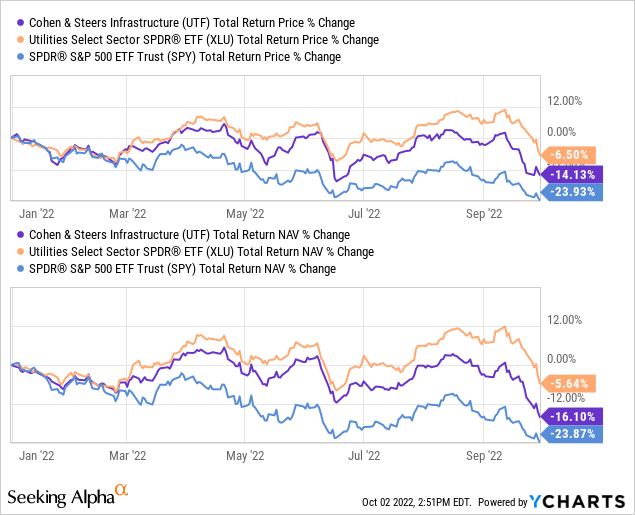
It also gives me a chance to note the underperformance and several reasons why I believe that to be the case. I think there are several obvious reasons for this. The most significant reasons are that UTF isn’t invested similarly to XLU and leverage.
UTF is invested globally, and the portfolio even includes some exposure to preferred and bonds. The global market weakness seems to have played some role in the underperformance this year. Of course, being leveraged means that any lower moves will be exasperated.
If we look at their linked index, we can see better results. We can also see that it has even compared favorably to the broader market over the longer time frames. Of course, UTF is an income investment, though. So comparing it to the S&P 500 seems more appropriate just for context rather than trying to utilize it as a benchmark.
UTF Annualized Returns (Cohen & Steers)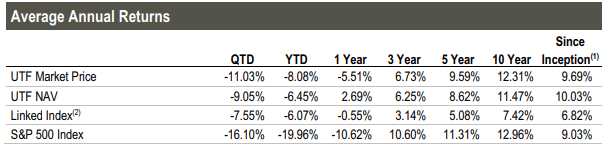
They provide this index, but it seems more relevant to their positioning. It factors in the preferred exposure and the global tilt for the comparison.
Linked Index: Linked UTF Index is represented by 80% S&P 1500 Utilities Index / 20% ICE BofA Fixed Rate Preferred Securities Index through 12/31/09, and by 80% UBS Global Infrastructure & Utilities 50/50 Index Net / 20% ICE BofA Fixed Rate Preferred Index through 03/31/15 and 80% FTSE Global Core Infrastructure 50/50 Net Tax Index / 20% ICE BofA Fixed Rate Preferred Index thereafter.
On a YTD basis, the fund’s total share price returns have exceeded the fund’s total NAV return performance. That has created a situation where the fund has come to a premium. While the fund has been flirting with premium valuations for the last several years, that isn’t where the fund has traded historically.
In fact, the fund has often traded at what would appear to be an almost perpetual discount. Over the last decade, the average discount still comes to around 7%.
YCharts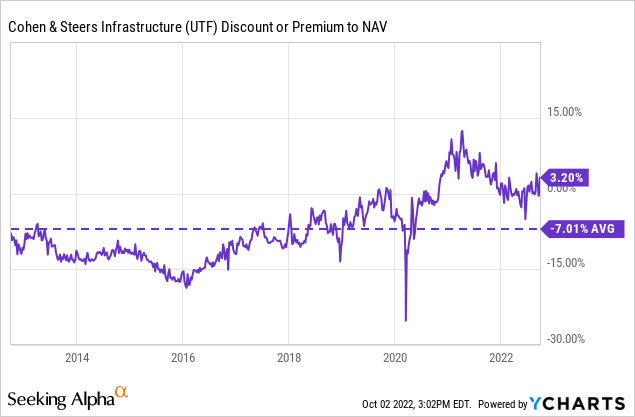
UTF can play a role in an investor’s portfolio as infrastructure and utilities are essential. That includes during soft economic times such as a recession. Therefore, continuing to hold onto a position in this fund still seems appropriate as it provides a diversified pool of these assets.
Distribution – Not Overly Extended
UTF slashed their distribution sometime around 2008/09.
UTF Distribution History (CEFConnect)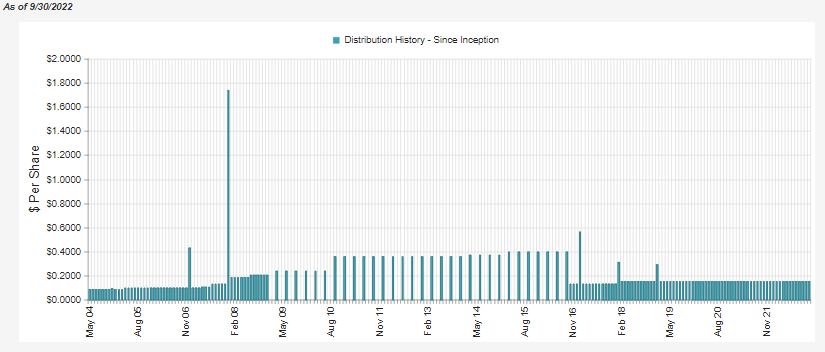
If one is expected as deep of a recession as then, then we could expect the same to happen. At this point, it isn’t anticipated to be. Either way, again, the types of assets they hold should continue to see a future in one shape or another. That means that investors aren’t likely to be completely wiped out if holding UTF.
When looking at the fund’s distribution rate, it comes to 8%. On an NAV basis, it comes to 8.12%. To me, that’s still a reasonable and sustainable level where management isn’t likely to be pushing for a cut. That is, even though the fund will rely on capital gains to fund the distribution. Net investment income coverage came to 29.16%. That was essentially the same as the prior fiscal year when NII coverage finished at 29.92%.
However, the longer a recession, the more likely we could see distribution cuts.
UTF Semi-Annual Report (Cohen & Steers)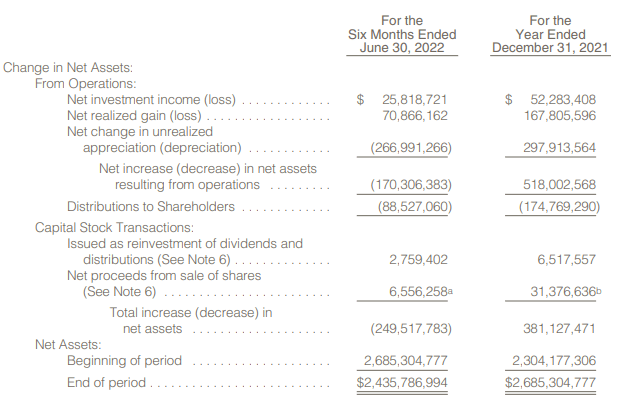
Through the first half of this year, the distribution was largely already covered through realized gains. The NII and realized gains combined were more than enough to cover the ~$88.5 million paid in the first six months. Of course, the second half of the year is turning out to be even sourer than the first, which could put more pressure on coming up with realized gains. Written options contributed nearly $2 million to those gains. Writing options can be done in any market environment.
For tax purposes, this fund comes out to be a fairly strong consideration for a taxable account. The reason for this is because they pay out the majority of their distribution which is classified as long-term capital gains.
UTF Tax Classifications 2021 (Cohen & Steers)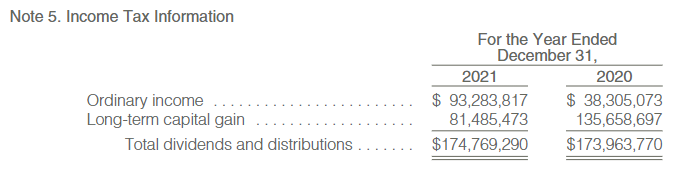
The ordinary income doesn’t generally translate to being tax-friendly, but in 2021, it ended up being all qualified dividends. Meaning that the taxes for that portion of the distribution were also reduced relative to ordinary income rates.
UTF’s Portfolio
The fund had reported a turnover rate of 18% in the first half of the year. That would put it on pace to fall short of the 47% turnover rate reported in 2021. Overall, the fund is relatively active but not overly so. The portfolio breakdown has 89% weighted towards common and preferred stocks, with another 11% in fixed income. Preferred securities make up a fairly meaningful 16.4% of the fund at the end of June. Hence, a fund such as UTF – even if it was entirely U.S.-based – could be facing headwinds more significantly than something like XLU.
Looking deeper into the fund’s portfolio, we can see that they carry 57% of their portfolio in U.S.-based companies. The other largest portion is the nondescriptive “other” category. Then U.S. friends to the north make up another 14%. Australia even makes up a fairly sizeable allocation of assets for the fund. For the most part, that puts the fund in less geographic tense areas (i.e., outside of Europe.)
UTF Geographic Allocation (Cohen & Steers)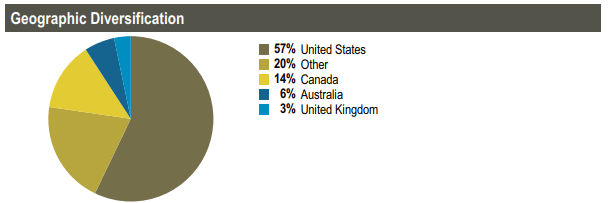
When looking at the fund’s sector diversification, we see that electric utilities are the largest allocation by far. We then have the mysterious “other” category. This is followed by midstream c-corps. Midstreams can be a hot industry, particularly when heading into winter, and gas must be transported around. However, this market area was doing better when natural gas and oil prices were higher. Natural gas prices are still high, but oil prices have slid materially lower.
Perhaps surprisingly since midstreams are regularly fixed-fee contracts. Meaning that they shouldn’t be susceptible to the more volatile fluctuations in energy prices, but that just hasn’t been playing out. When energy prices crash, such as oil, MLPs and midstreams seem to fall just as hard.
UTF Sector Allocation (Cohen & Steers)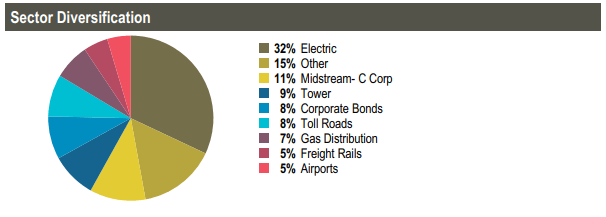
Tower, in this case, is talking about the tower REITs, American Tower Corp (AMT) and Crown Castle Corp (CCI), each taking up a top spot in the fund’s top ten. These have been pretty much permanent fixtures in UTF and the C&S REIT funds. Both AMT and CCI have taken it on the chin in terms of their YTD performance. This is quite similar to what we’ve seen with the real estate space overall.
YCharts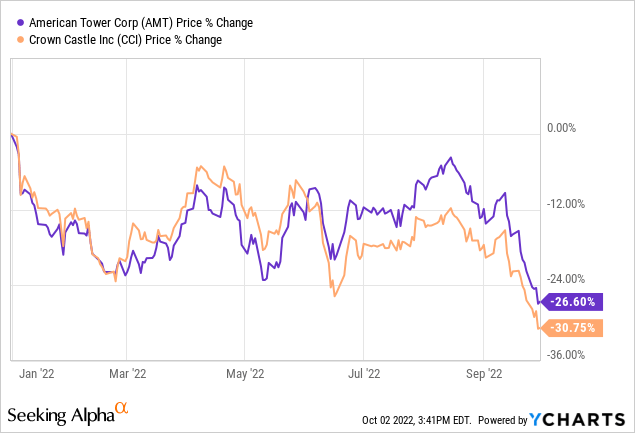
Again, which points out another main point when trying to compare UTF to XLU isn’t necessarily appropriate. XLU does not hold AMT or CCI, which I wouldn’t expect them ever to do so, either.
UTF Top Ten Holdings (Cohen & Steers)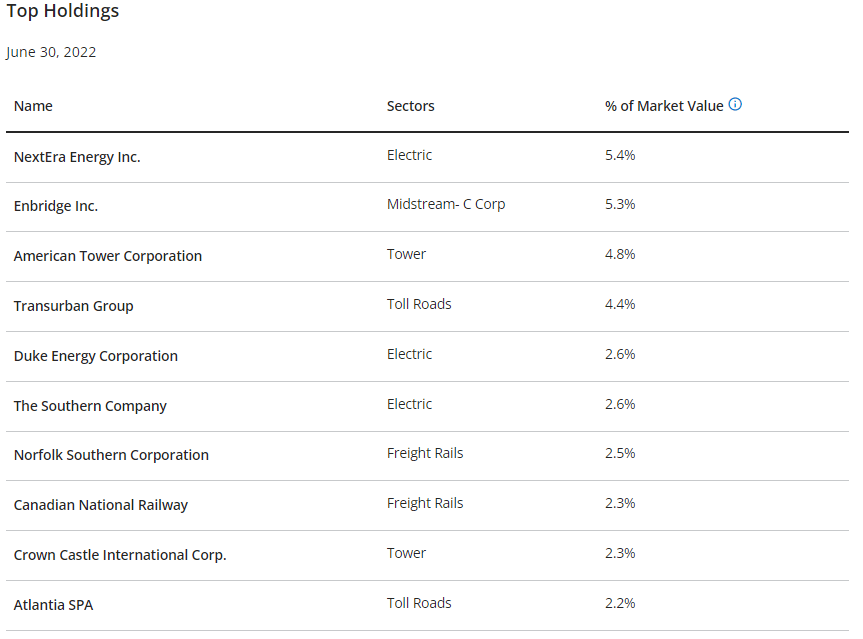
Despite the hundreds of holdings that UTF is comprised of, the top ten make up a relatively larger 34.4% of the portfolio. This tends to be the case with UTF. That can mean just a few holdings can have a fairly outsized impact on the fund.
Atlantia SPA (OTCPK:ATASF) makes an appearance in UTF’s top ten from our previous update. That has replaced FirstEnergy Corp. (FE), which no longer shows up as a top holding but is still a holding in the portfolio. FE is an electric utility company. ATASF is an Italian company that operates as an infrastructure player. They operate toll roads and airports.
Conclusion
UTF’s underlying portfolio is invested across a broad basket of essential infrastructure and utilities. This includes diversification around the globe as well. The share prices might not always reflect that, with the latest market plunge pulling everything down with it. The utility sector has been flirting back and forth this year with positive and negative performance territory. I remain confident that the bulk of these assets will continue to provide cash flow, seeing it through to the other side. That’s what makes me remain confident in continuing to hold my position in UTF.
Be the first to comment