

Marcio Silva/iStock via Getty Images
The iShares MSCI USA Min Vol Factor ETF (BATS:USMV) has a strategy completely opposite to the one of the momentum ETF (MTUM) that we have reviewed just recently.
Unlike MTUM, which makes bold and risky bets on players that have been enjoying investor attention and ballooning valuations that are anticipated to become even richer, USMV and its peers like the Invesco S&P 500 Low Volatility ETF (SPLV) prefer stocks with much calmer price actions. In theory, it means lower risk overall, but, inevitably, lower reward.
So, USMV is supposed to provide what I would cautiously call an equity safe haven (with caveats, of course) during the market turmoil; another way of saying, stocks found in its basket should have lower volatility than the broad U.S. market, thus when valuations crater, their prices should not decline that much.
However, there is a low-volatility anomaly which, in layman’s terms, means a strange tendency when such stocks outperform their racier counterparts over the longer timeframes. And as noted in the 2019 article from S&P Dow Jones Indices, “this phenomenon is observed universally across the globe.”
However, stocks that are not prone to steep price swings can have lackluster days, and frequently, or even lackluster years. For example, for USMV, it was both 2020, a blockbuster year for growth style when low-volatility strategies lagged drastically, and, surprisingly, 2021, despite capital rotation and a value style comeback, when the fund lagged the iShares Core S&P 500 ETF (IVV) terribly.
Their immunity to deep price declines like the one we saw two years ago across the global equity markets is also questionable.
Is USMV a Buy? I doubt that, while also certainly not advocating against holding the ETF for the long term. I am not impressed by its track record, probably because I can tolerate a bit higher risk in exchange for a higher return, or, perhaps, I am focusing too much on the most recent performance instead of taking a decades-long view. Regardless, there is something the fund has clearly achieved, which I appreciate. And we will discuss that in greater depth below in the article.
The investment strategy and the portfolio
According to the prospectus, the fund tracks the MSCI USA Minimum Volatility (USD) Index. The benchmark consists of mostly large-cap players, though also with a marginal footprint in the mid-cap universe (approximately 1% of the current version of the USMV portfolio). MSCI applies a broad range of constraints to arrive at a final version of the index, with liquidity and leverage being among the considerations.
As of April 7, the fund had 173 equity holdings, with the top ten accounting for ~16%. Four members of the $1 trillion club, Apple (AAPL), Alphabet (GOOG), Amazon (AMZN), and Microsoft (MSFT) are present, but with weights grossly different from those they have in the S&P 500 fund; combined, they have just 3.6% of the net assets. Interestingly, Tesla (TSLA) is absent. Barely a surprise since the stock has a 24-month beta of 2.
Close to 78% of the holdings pay a dividend, with those yielding at least 2% accounting for just ~32%; the fund’s LTM yield of only 1.3% is expectable.
It should be noted that the methodology of its index resulted in the portfolio being overweight in tech (~22.2%) and healthcare (~18.5%), in sharp contrast to SPLV which overweighted utilities (~25%) and consumer staples (~22.6%), the sectors deemed defensive. This material difference in sector allocations may help to explain why the Invesco ETF has dramatically underperformed its peer fund since 2011 (discussed below).
Meanwhile, both have either minuscule (in the case of USMV, less than 50 bps; stocks that qualified are Cheniere Energy (LNG) and Coterra Energy (CTRA)) or no exposure to the energy sector, so both have missed the oil price rally this year. Both LNG and CTRA have been soaring since the beginning of 2022, but that certainly has had a close to nothing impact on USMV’s NAV dynamics.
On a side note, speaking of volatility inherent to the oil & gas players and the like, I should quickly remind you that the Global X Super Dividend U.S. ETF (DIV) that I reviewed last year had no exposure to two dividend aristocrats, Exxon Mobil (XOM) and Chevron (CVX). The essential reason was that their beta coefficients were above 1.
Since the index does not pay attention to the value factor, I do not think an 8% share of stocks having a Quant Valuation grade of at least B- is surprising. These players are presented in the table below:
Quant data as of April 12 (Created by the author using data from Seeking Alpha and the fund)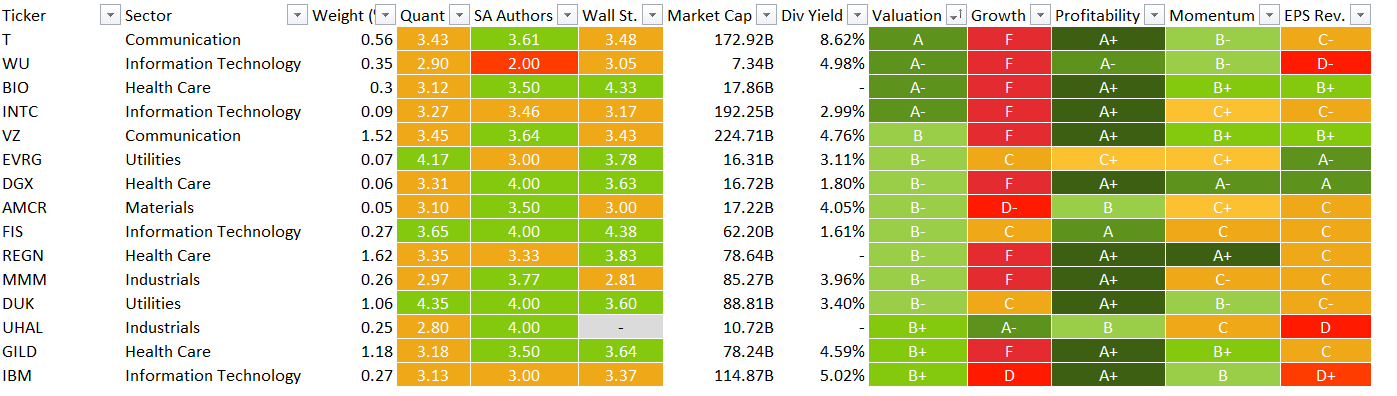
Another way of saying, lower volatility does not immediately translate into lower multiples, especially when we are talking about the upper equity echelon.
Growth is also not particularly strong. 35 companies do stand out compared to their sectors, having no less than a B- Growth grade, but they account for slightly below 20%. No coincidence, stocks with above-average growth characteristics tend to have wild price swings. Tesla is a beautiful example that immediately comes to my mind here.
Does low volatility mean adequate quality?
Quality is, quite frankly, my favorite factor, so I will, of course, not ignore it today.
The scatter plot below is supposed to give a sense of the holdings’ profitability characteristics.
Created by the author using data from Seeking Alpha and the fund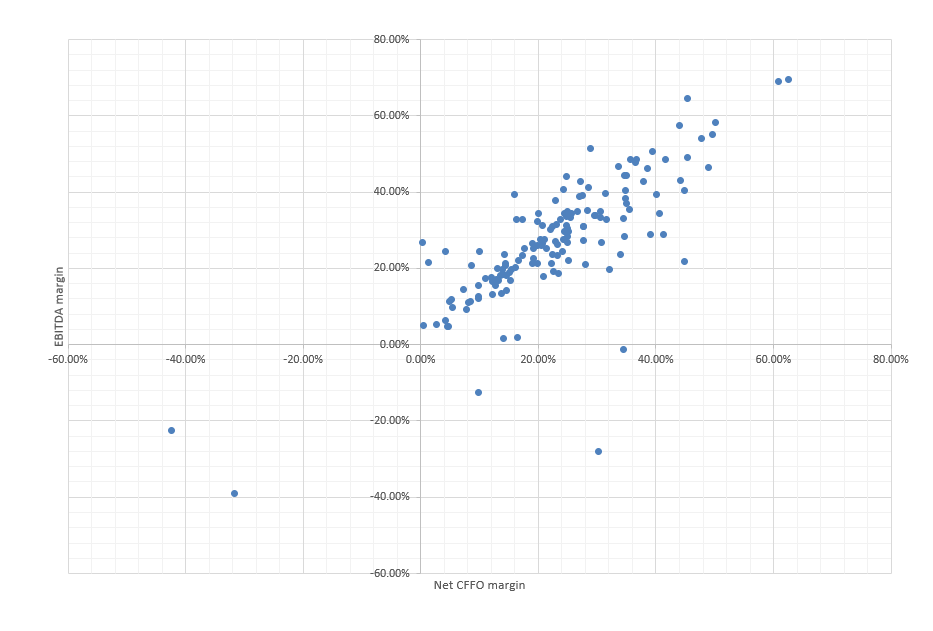
The chart excludes financials and REITs and covers ~90% of the portfolio.
As we can see quite clearly, there are only a few outliers with negative EBITDA or/and CFFO margins, like Seagen (SGEN) or Zscaler (ZS). Overall, EBITDA-negative companies account for only ~1% of the holdings, so they certainly do not pose a major threat to USMV’s returns. And only two, Peloton (PTON) and SGEN are incapable of delivering positive net operating cash flows.
Meanwhile, most names have phenomenal profitability; Visa (V) and VeriSign (VRSN) are the two outliers in the upper right corner, with the cash flow margins above 60%, an impeccable result.
Besides, more than 98% of the holdings have Quant Profitability grades of at least B-, with those with an A (-/+) rating accounting for over 80%. So yes, depending on the combination of other factors, low-volatility stocks, especially mega and large caps can have above-average profitability. However, that does not necessarily mean the combination of LW and quality factors always translates into above-market returns.
Performance: solid track record in the pre-coronavirus era, softer returns thereafter
Incepted on 18 October 2011, the fund delivered a 14.51% CAGR during the October 2011 – January 2020 (a pre-coronavirus stock market era), marginally outperforming IVV, by only 5 bps. It is worth noting it has a 15 bps expense ratio, above the 3 bps ER of IVV, so higher fees are likely to blame.
It also delivered an impressive Sortino ratio of almost 3 (at least 2 is a goal) and Sharpe ratio of 1.58. The standard deviation is the lowest in the group. At the same time, SPLV which was incepted a few months earlier performed a bit softer.
Created by the author using data from Portfolio Visualizer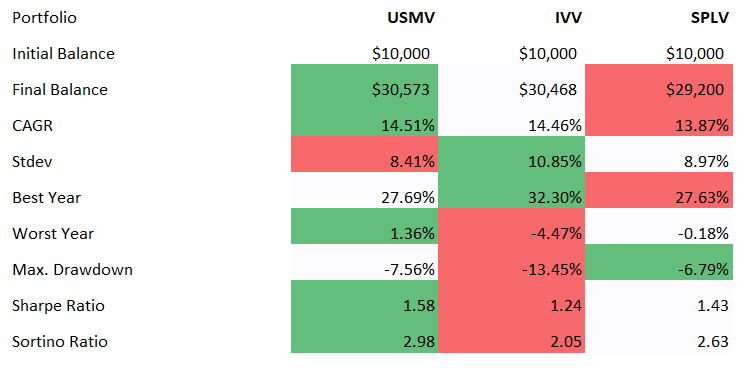
So, yes, these data reinforce the low volatility anomaly thesis.
But what about a timeframe with more recent years included? USMV’s allure wanes.
Created by the author using data from Portfolio Visualizer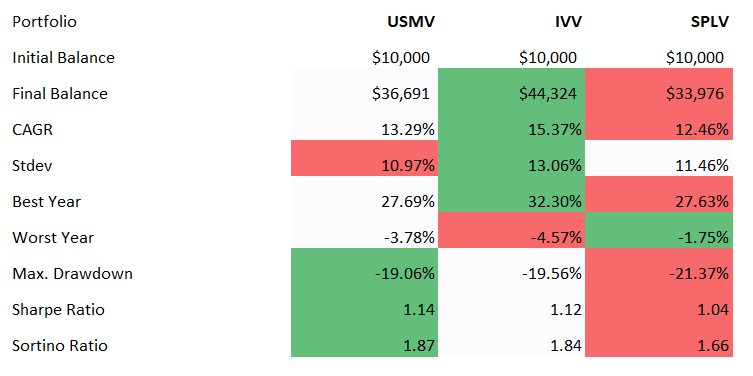
From October 2011 to March 2022, the fund underperformed IVV, though it still has the lowest standard deviation and the highest Sharpe, Sortino ratios.
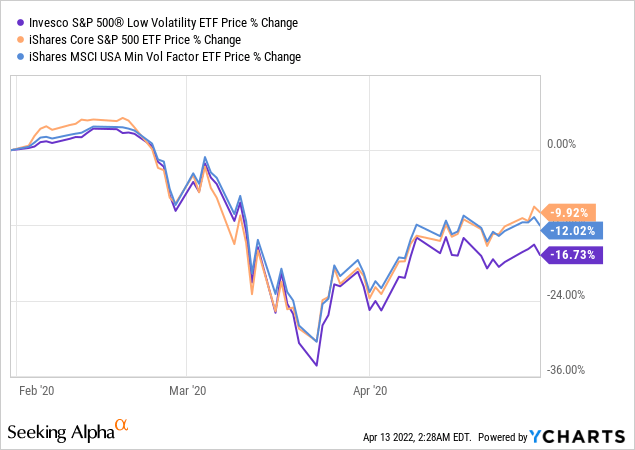
More specifically, what about the coronavirus sell-off? I opted for the February – April 2020 period.
And here is another chart, with 3-year drawdowns, telling a similar story.
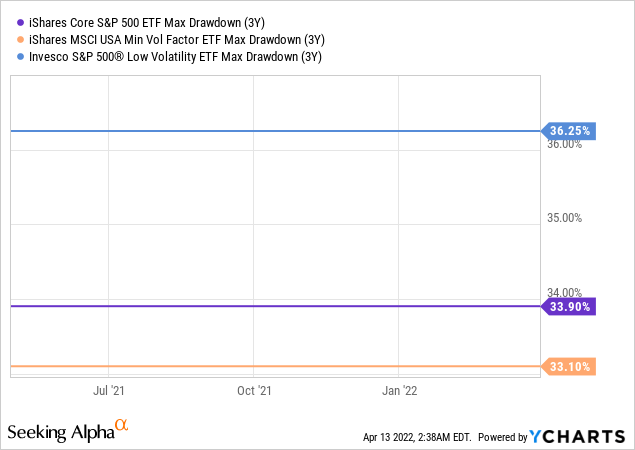
While SPLV surprisingly was more afflicted, USMV’s performance was only on par with IVV; however, after the market began recovering, it failed to keep pace with it. This is the key problem of low-volatility strategies: though they may fare better than the bellwether market-cap-weighted funds, they underperform the market during recoveries.
Final thoughts
Now let us summarize the essential conclusions:
- Yes, the fund has lower volatility than the bellwether ETFs like IVV.
- No, it does not imply all-weather market-beating returns.
- Yes, it can suffer from drawdowns similar to the market. The coronavirus market turmoil proved it.
- Low volatility and large size mean solid quality characteristics in most cases. But a high yield and consistent dividend growth do not necessarily supervene.
- USMV has outperformed its peer from Invesco thanks to better sector allocation. It also has higher Sharpe and Sortino ratios, hence, more reward for more risk. So, it is a better choice, though still only a Hold.
Be the first to comment