

Melpomenem
The Treasury yield curve is widely used as a first approximation of estimating recession risk. This is usually limited to one or two sets of maturities. Does this simple model find traction if we expand the analytics across the full sweep of the yield curve? The short answer, yes.
The standard approach is to model the 10-year rate less the 3-month rate. A popular alternative is the 10-year/2-year maturities. Both spreads have a solid record of inverting (short rate below long rate) ahead of US recessions.
Expanding the analysis across the yield curve also provides useful information about the business cycle. As a test, I crunched the numbers on nine maturities, ranging from the 3-month yield up to the 30-year yield and calculating the spread on every combination of longer vs. shorter rates – 36 spreads in all. The results look encouraging. In particular, the percentage of inverted curves rises ahead of US recessions, as the chart below shows.
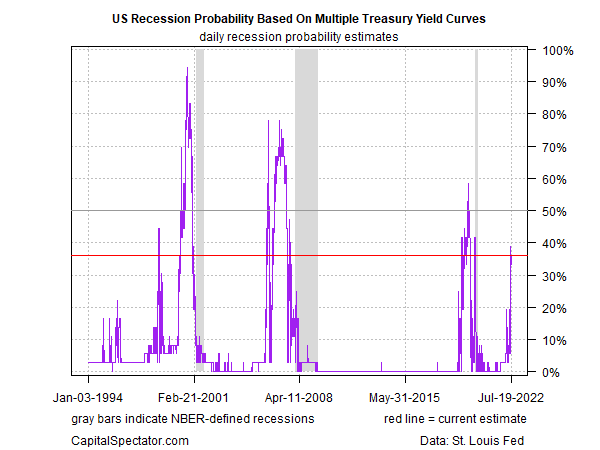
As a rough rule of thumb, we can say that when the number of inversions rises above the 50% mark (more than half of curves inverted), that’s a strong signal that a recession is near. On that basis, the current data (through July 19) indicates that recession risk has increased sharply but has yet to cross above the 50% mark. In other words, there’s still room for debate about the near-term path for the economy, although the outlook is becoming increasingly precarious.
There are caveats, of course, starting with the standard warning that applies to yield curves generally as a recession-forecasting model. Yes, inverted curves have a solid history of anticipating economic contraction, but assuming this approach to recession forecasting is forever flawless is assuming too much. The same applies to any one business cycle model application, which is why I prefer to look at a range of indicators and models on weekly basis in The US Business Cycle Risk Report.
All models and indicators are flawed in some way, but the flaws and merits vary, and so using a variety of indicators and models will provide a more robust system of estimating recession risk.
That said, looking at multiple yield curves is useful for another perspective. On that basis, the main takeaway for this approach at the moment: recession risk is elevated, but it’s not yet at the tipping point that indicates a high-confidence forecast. For now, that view aligns with this week’s profile of the economy in The US Business Cycle Risk Report.
Editor’s Note: The summary bullets for this article were chosen by Seeking Alpha editors.
Be the first to comment