

undefined undefined/iStock via Getty Images
After there has been a major market correction and all your stop losses have been triggered and your sell points have been executed, there is a tendency to look at that pile of cash and try to time the market and buy back in. Your emotions tell you you don’t want to get left behind in the recovery.
I like to sit back and be an observer from the sidelines and instead of trying to predict and time the market, I just follow it closely and let the market tell me when to get back in.
I use two charts of the S&P 500 Index to analyze when the time is right. Reading charts is a little bit art and a little bit science, plus a whole lot of luck and experience.
The first I use is the S&P 500 Index price with the 20, 50, 100 and 200 day moving averages:
S&P DMA Barchart.com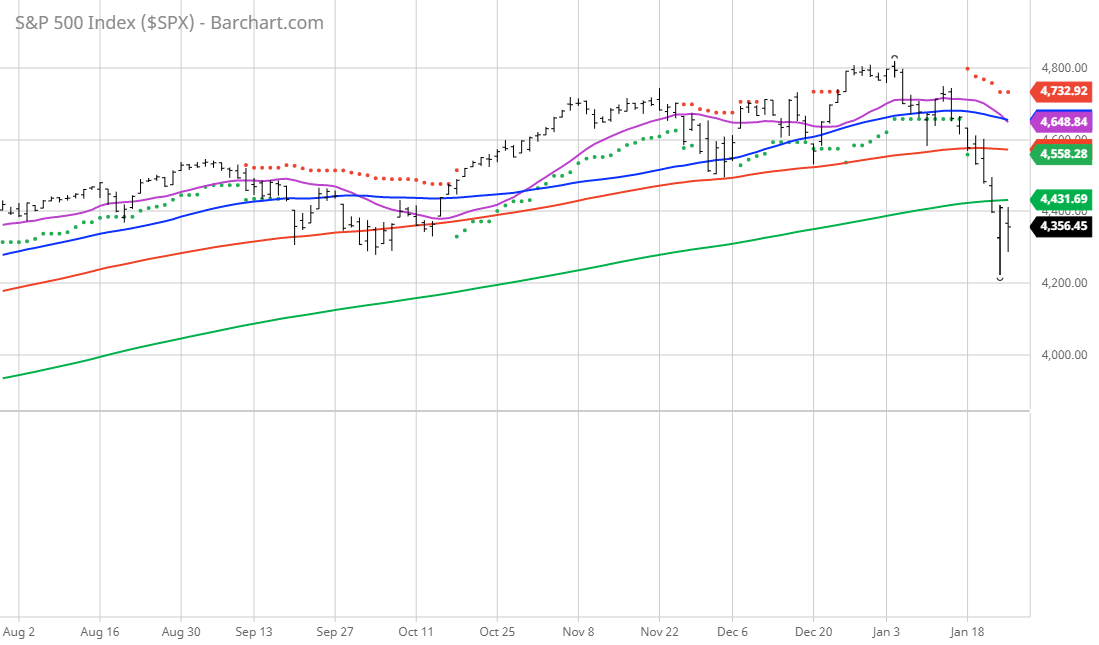
Here you can see that the Index is clearly trading below its 20, 50, 100 and 200 DMAs. Depending on how aggressive you like to be, wait until the Daily Moving Average you have learned to rely on is crossed by the price. My personal choice is to wait and re-enter the market at the 50-day moving average – the choice is yours.
The second chart I like is the 90-day Turtle Channel charting the price, highest high and lowest low in the past 90 days with the 100 and 200 day moving averages included:
90-day turtle Barchart.com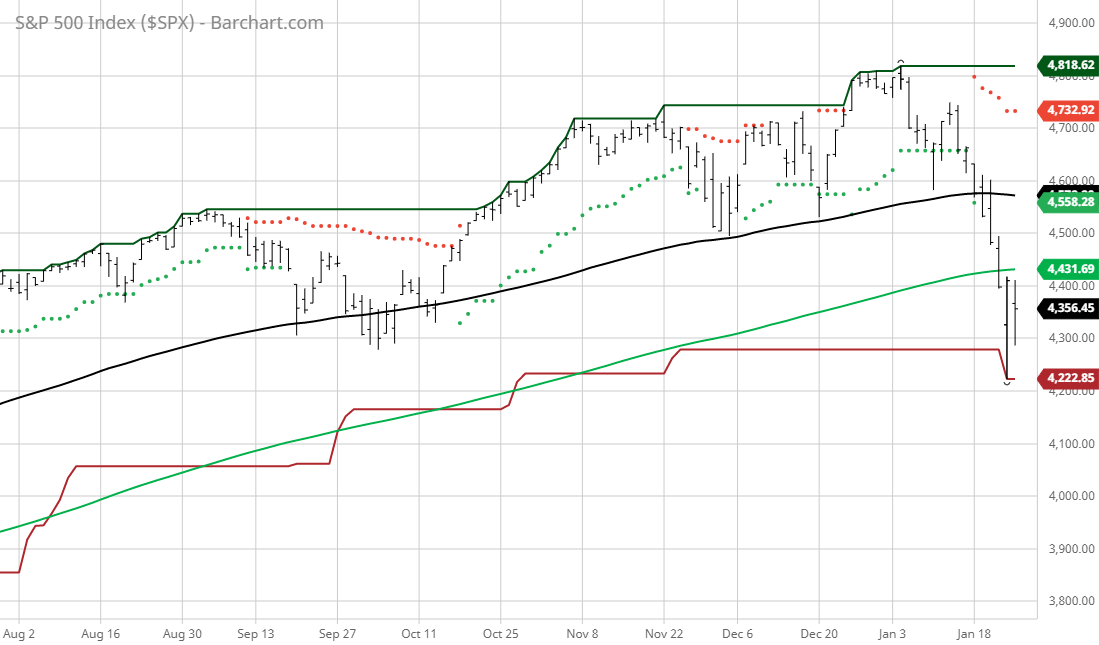
As long as that bottom line keeps coming down, I feel safe sitting on the sidelines.
Please use both charts and it’s like getting 2 opinions.
Three rules:
- Be rational and not emotional.
- Try to be approximately right and not precisely inaccurate.
- Never try to predict what the market will do, find a way to monitor it closely and let the market, not the headlines, tell you when to react.
Be the first to comment