

Japanese Yen Talking Points
USD/JPY approaches pre-pandemic levels as the 10-Year Treasury yield climbs to a fresh yearly high (1.77%) ahead of April, and the exchange rate appears to be on track to test the March 2020 high (111.72) as the Relative Strength Index (RSI) holds above 70 and sits in overbought territory.
USD/JPY Rally Eyes March High as RSI Sits in Overbought Territory
USD/JPY trades to a fresh yearly high (110.97) as a bull flag formation unfolds in March, with a ‘golden cross’ formation taking shake during the same period as the 50-Day SMA (106.70) crossed above the 200-Day SMA (105.60).
The RSI reflects a similar dynamic as it continues to track the upward trend from the start of the year, and the overbought reading in the oscillator is likely to be accompanied by a further appreciation in USD/JPY like the behavior seen earlier this month.
Recent developments surrounding the USD/JPY rally indicates a potential shift in market behavior as the RSI pushes into overbought territory for the first time since February 2020, and the US Dollar may continue to outperform the Japanese Yen even though the Federal Reserve remains on track to “increase our holdings of Treasury securities by at least $80 billion per month and of agency mortgage-backed securities by at least $40 billion per month” amid the ongoing rise in longer-dated US Treasury yields.
It remains to be seen if the update the Non-Farm Payrolls (NFP) report will influence the near-term outlook for USD/JPY as the US economy is expected to add 650K jobs in March, but a further improvement in the labor market may keep the Greenback afloat as it puts pressure on the Federal Open Market Committee (FOMC) to adopt a less dovish forward guidance for monetary policy.
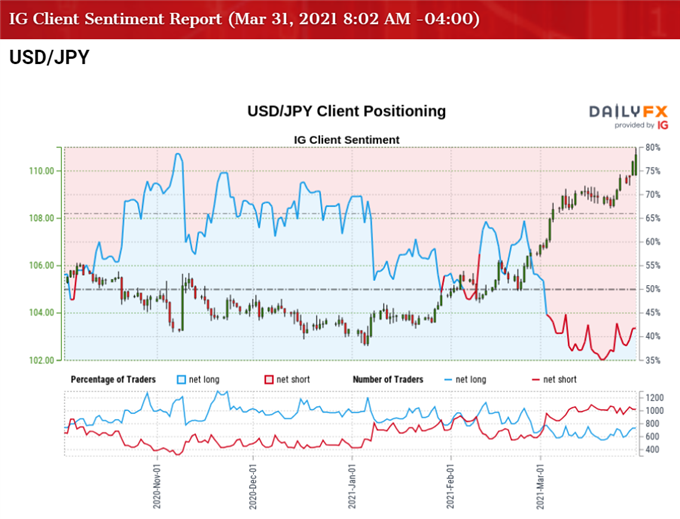
Meanwhile, the appreciation in USD/JPY has spurred a more material shift in retail sentiment as traders flip net-short for the second time this year, with the IG Client Sentiment report showing 40.56% of traders currently net-long the pair as the ratio of traders short to long stands at 1.47 to 1.
The number of traders net-long is 11.70% lower than yesterday and 1.48% lower from last week, while the number of traders net-short is 0.82% lower than yesterday and 7.33% lower from last week. The decline in net-long interest could be a function of profit taking behavior as USD/JPY trades to a fresh yearly high (110.97), while market participation appears to be thinning going into April as open interest stands 7.33% lower from last week.
With that said, the USD/JPY rally indicates a potential shift in market behavior amid the flip in retail sentiment, and the exchange rate appears to be on track to test the March high (111.72) as the Relative Strength Index (RSI) continues to track the upward trend from earlier this year and sits in overbought territory.

Recommended by David Song
Learn More About the IG Client Sentiment Report
USD/JPY Rate Daily Chart
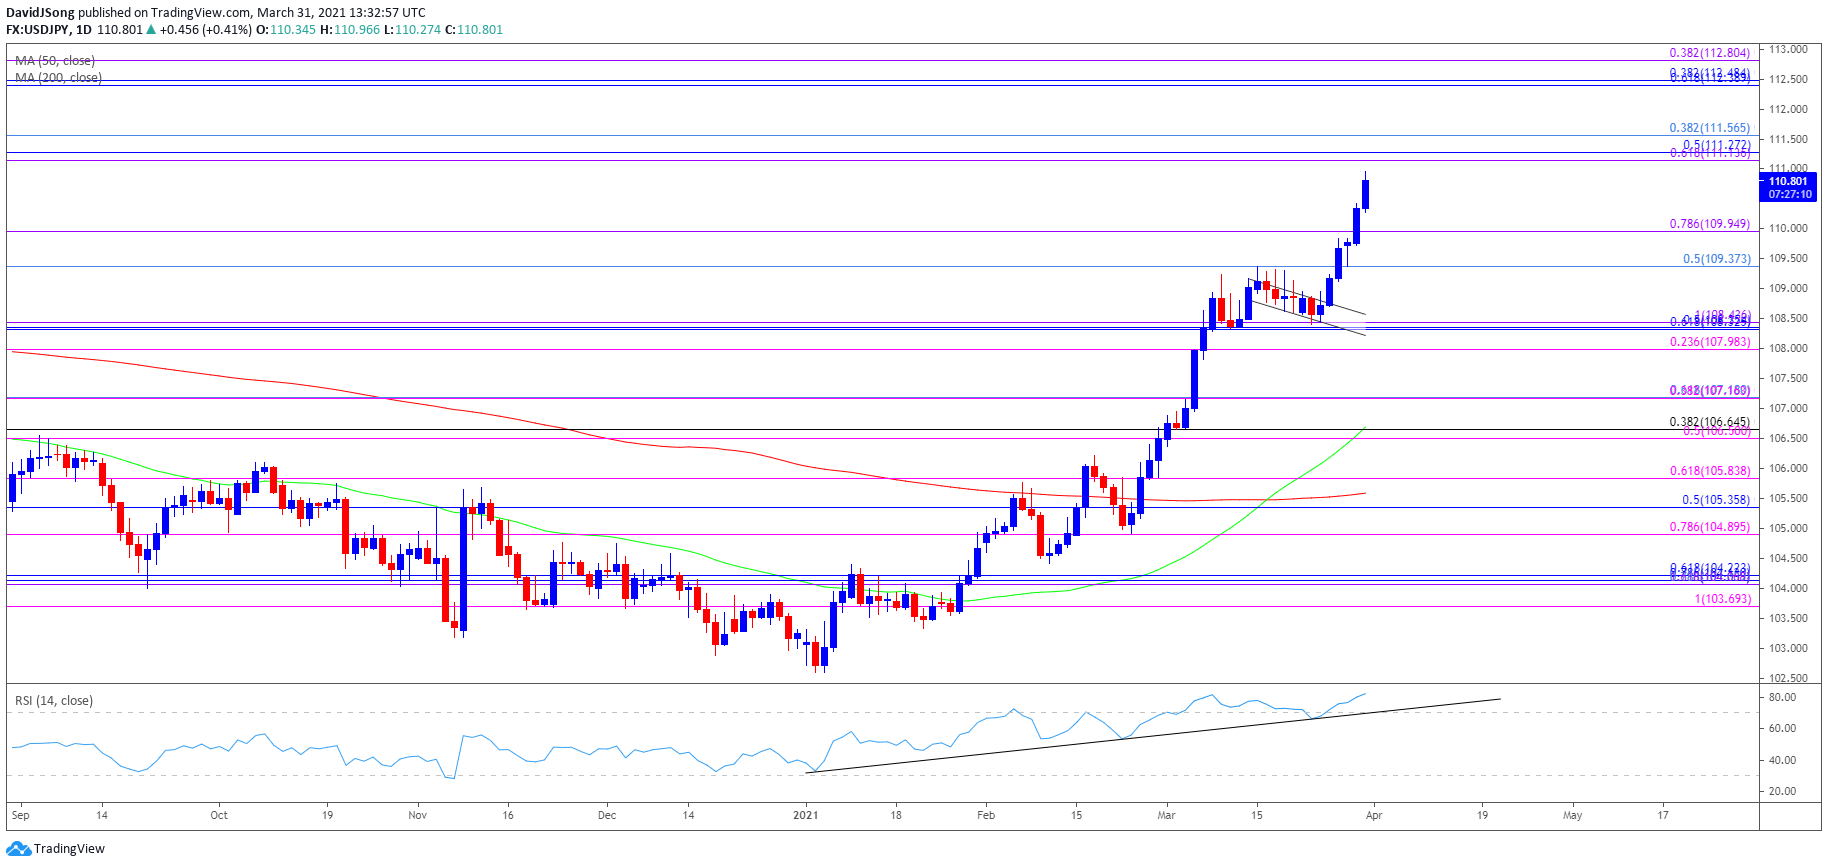
Source: Trading View
- USD/JPY approaches pre-pandemic levels as a ‘golden cross’ materialized in March, with a bull flag formation unfolding during the same period as the exchange rate trades to fresh yearly highs.
- The Relative Strength Index (RSI) highlights a similar dynamic as the indicator climbs above 70 for the first time since February 2020, and the overbought reading in the oscillator is likely to be accompanied by a further appreciation in USD/JPY like the behavior seen earlier this month.
- The string of failed attempts to break/close below the 108.00 (23.6% expansion) to 108.40 (100% expansion) region has pushed USD/JPY above the Fibonacci overlap around 109.40 (50% retracement) to 110.00 (78.6% expansion), with the next area of interest coming in around 111.10 (61.8% expansion) to 111.60 (38.2% retracement) area on the radar,which largely lines up with the March 2020 high (111.72).
- The next area of interest comes in around 112.40 (61.8% retracement) to 112.80 (38.2% expansion), and the RSI may continue to show the bullish momentum gathering pace as long as it tracks the upward trend from earlier this year and holds above 70.

Recommended by David Song
Traits of Successful Traders
— Written by David Song, Currency Strategist
Follow me on Twitter at @DavidJSong
Be the first to comment