

USD/JPY Price and Chart Analysis
- US Treasury yields edge lower, USD/JPY below 150.
- Further Yen intervention is likely and that will spark volatility.
Recommended by Nick Cawley
Get Your Free JPY Forecast
The Japanese Ministry of Finance is said to have spent in excess of JPY5.4 trillion on Friday propping up the ailing Yen against a rampant US dollar, and market talk suggests that the MoF was back in the market again on Monday. After approaching USD/JPY 150, the pair fell sharply to 145.50 before nudging higher again. Today however, the pair has traded in a very, very small range – around 70 pips – as traders ready themselves for the next move.
Bank of Japan (BoJ) – Foreign Exchange Market Intervention
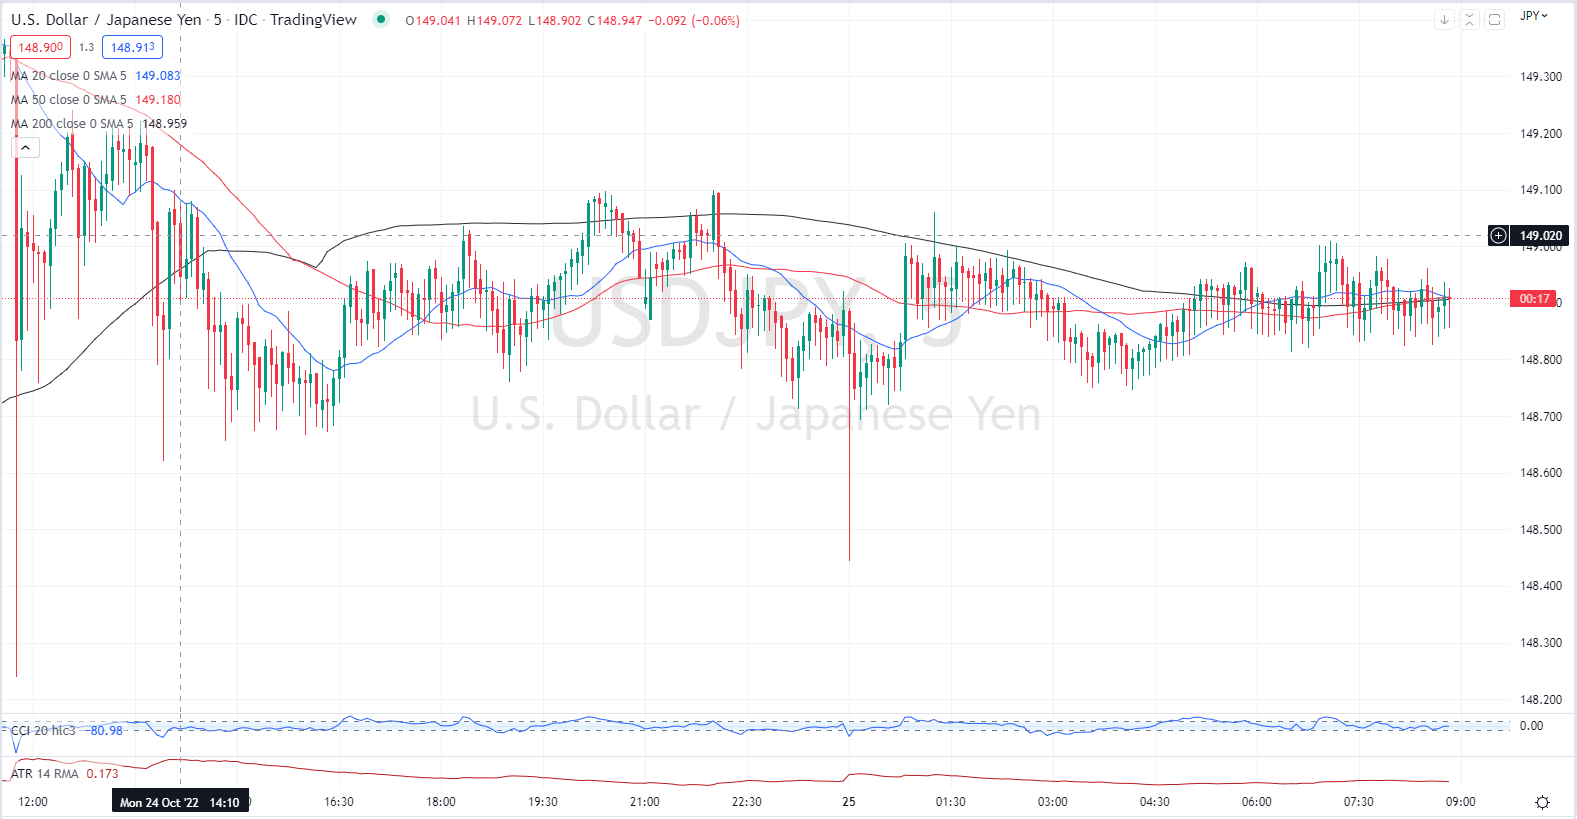
Looking at the 5-minute USD/JPY chart, apart from a brief fall to 148.45 as the session opened, the pair has traded in a very tight range.
Recommended by Nick Cawley
The Fundamentals of Range Trading
USD/JPY 5-Minute Chart October 25, 2022
Chart via TradingView
USD/JPY may stay range bound until Friday when the Bank of Japan (BoJ) announces its latest monetary policy decision. While the Bank Rate is fully expected to be left untouched, the BoJ will also release its Quarterly Outlook Report. This report will give the market further insight into the Bank’s thinking and how they see economic conditions going forward.
For all market-moving economic data and events, see the DailyFX Economic Calendar.
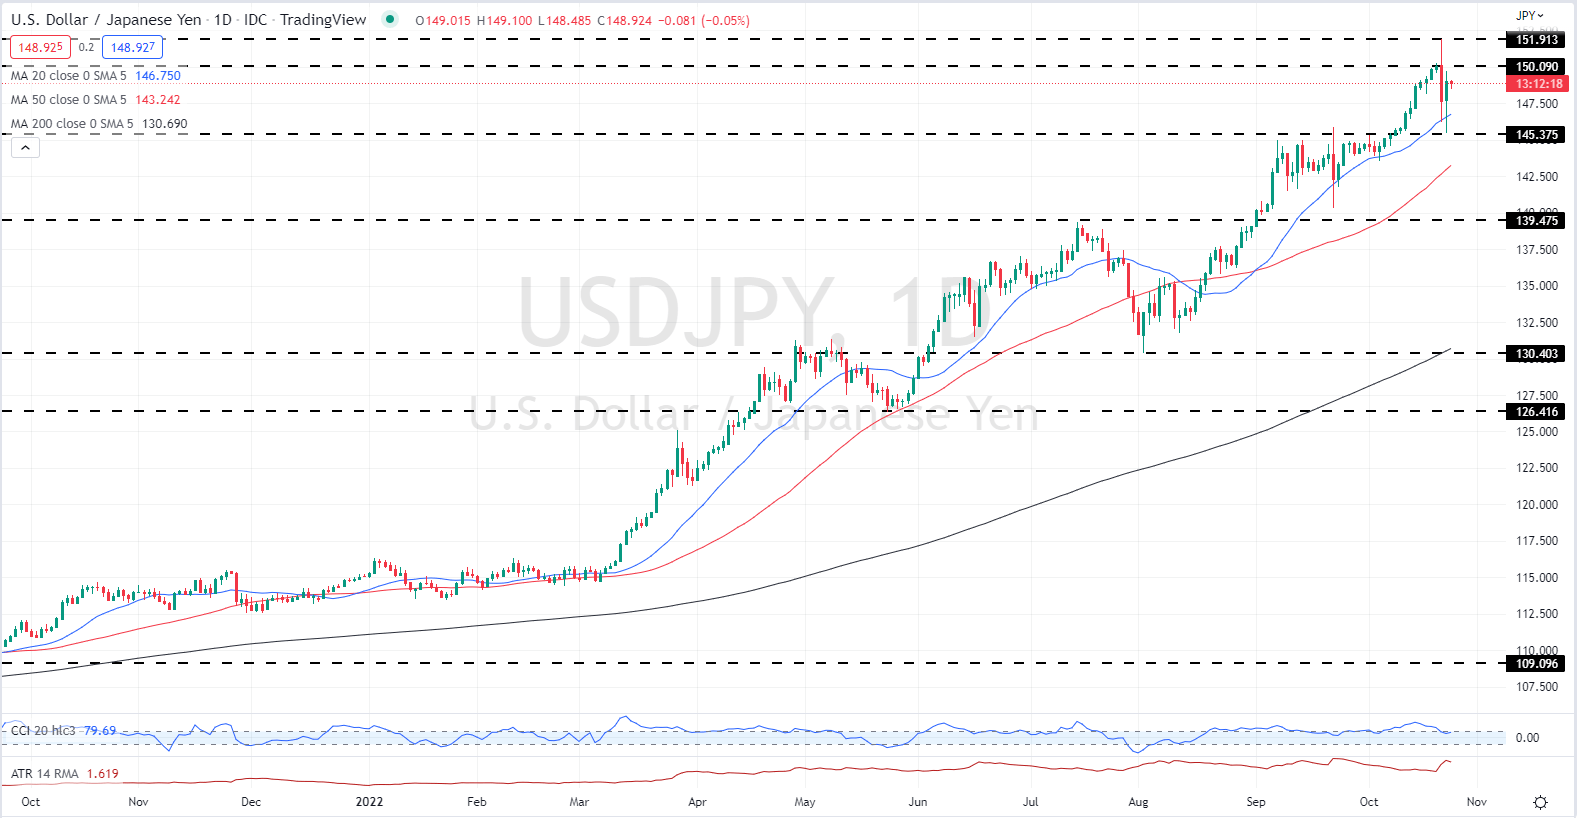
The daily USD/JPY chart paints a slightly different picture from the 5-minute chart. The pair continue to rally, printing higher lows and higher highs, while all three simple moving averages are supportive. First line support is seen off Monday’s low, the 20-day sma, and a prior level of resistance between 145.55 and 146.75. Resistance is seen at 150 and 152. All eyes are on the Ministry of Finance for potential intervention and Friday’s Quarterly Report.
USD/JPY Daily Price Chart – October 25, 2022
Retail trader data show that 21.75% of traders are net-long with the ratio of traders short to long at 3.60 to 1.The number of traders net-long is 4.44% higher than yesterday and 10.53% higher from last week, while the number of traders net-short is 10.50% higher than yesterday and 10.87% lower from last week.
We typically take a contrarian view to crowd sentiment, and the fact traders are net-short suggests that USD/JPY prices may continue to rise. Positioning is more net-short than yesterday but less net-short from last week. The combination of current sentiment and recent changes gives us a further mixed USD/JPY trading bias.
| Change in | Longs | Shorts | OI |
| Daily | -4% | 6% | 3% |
| Weekly | 9% | -13% | -9% |
What is your view on the USD/JPY – bullish or bearish?? You can let us know via the form at the end of this piece or you can contact the author via Twitter @nickcawley1.
Be the first to comment