

tadamichi/iStock via Getty Images
I first wrote about the Schwab U.S. Dividend Equity ETF (NYSEARCA:SCHD) a few months ago, calling it my ‘Income Pick’. In my mind, the SCHD ETF has the best combination of historical returns, current yield, and distribution growth.
Since my article, I have also reviewed a number of peer dividend funds from competing sponsors. How does the SCHD stack up against these competing funds?
Using a composite scoring system, the SCHD ETF ranks best amongst peer high dividend funds, with strong long-term performance and distribution growth. Although I am concerned about a possible recession in 2023, SCHD’s high quality portfolio should outperform the market. In a worst case scenario, investors can consider hedging their SCHD position with shorts on the SPY ETF to ride out the volatility.
Brief Fund Overview
First, a quick refresher for those new to SCHD. The Schwab U.S. Dividend Equity ETF is Schwab’s low-cost entrant in the high dividend ETF category. The SCHD ETF’s strategy focuses on companies that have at least 10 years of consecutive dividend payments. The fund selects investments based on 4 different factors: cash flow to debt, return on equity, dividend yield, and 5-year dividend growth rate.
So in addition to paying a high current dividend yield, the fund also requires investments to have solid balance sheets (high cash flow to debt), high profitability (ROE), and willingness and ability to grow its dividend.
SCHD vs. Competing Funds
Since my initial article, I have developed a composite scoring system to objectively compare between funds. The scoring system ranks the funds by each metric, for example, 1 Yr returns, from best (1) to worst (8). The composite score then averages the score for each fund across the various metrics. This methodology rewards consistency, i.e. the best scoring fund needs to outperform on multiple metrics (Figure ).
Figure 1 – SCHD vs. peer funds (Author created with performance and risk metrics from Portfolio Visualizer and distribution and fund details from Seeking Alpha)
Looking at SCHD’s performance relative to peer funds, we can see that it ranks very high in terms of long-term historical returns. SCHD also has a strong Sharpe Ratio, which measures returns versus volatility. Its max historical drawdown during the COVID crash was also one of the least. Finally, SCHD has a decent current yield of 3.3%, with best in class distribution growth rates.
On the negative side, SCHD’s recent performance has been lagging, with YTD returns of -6.2% and 1Yr returns of -1.4%. Its volatility is also higher than average, although most of the funds are clustered around the 14-15% volatility range.
Overall, SCHD performs well in many categories, which gives the fund the best composite score.
How Do I Think About SCHD Going Forward?
It’s great to look at historical returns and figure out which fund has performed best in the ‘past’. However, it’s another matter to think about how funds will perform in the ‘future’.
Currently, many economists and forecasters are predicting a global recession in 2023. For example, the latest reading from the Conference Board’s recession probability indicator is at 96%, implying a recession is virtually a lock in the next twelve months (6 out of 6 hit rate in the past 40+ years, Figure 2).
Figure 2 – Recession probability at 96% (Conference Board)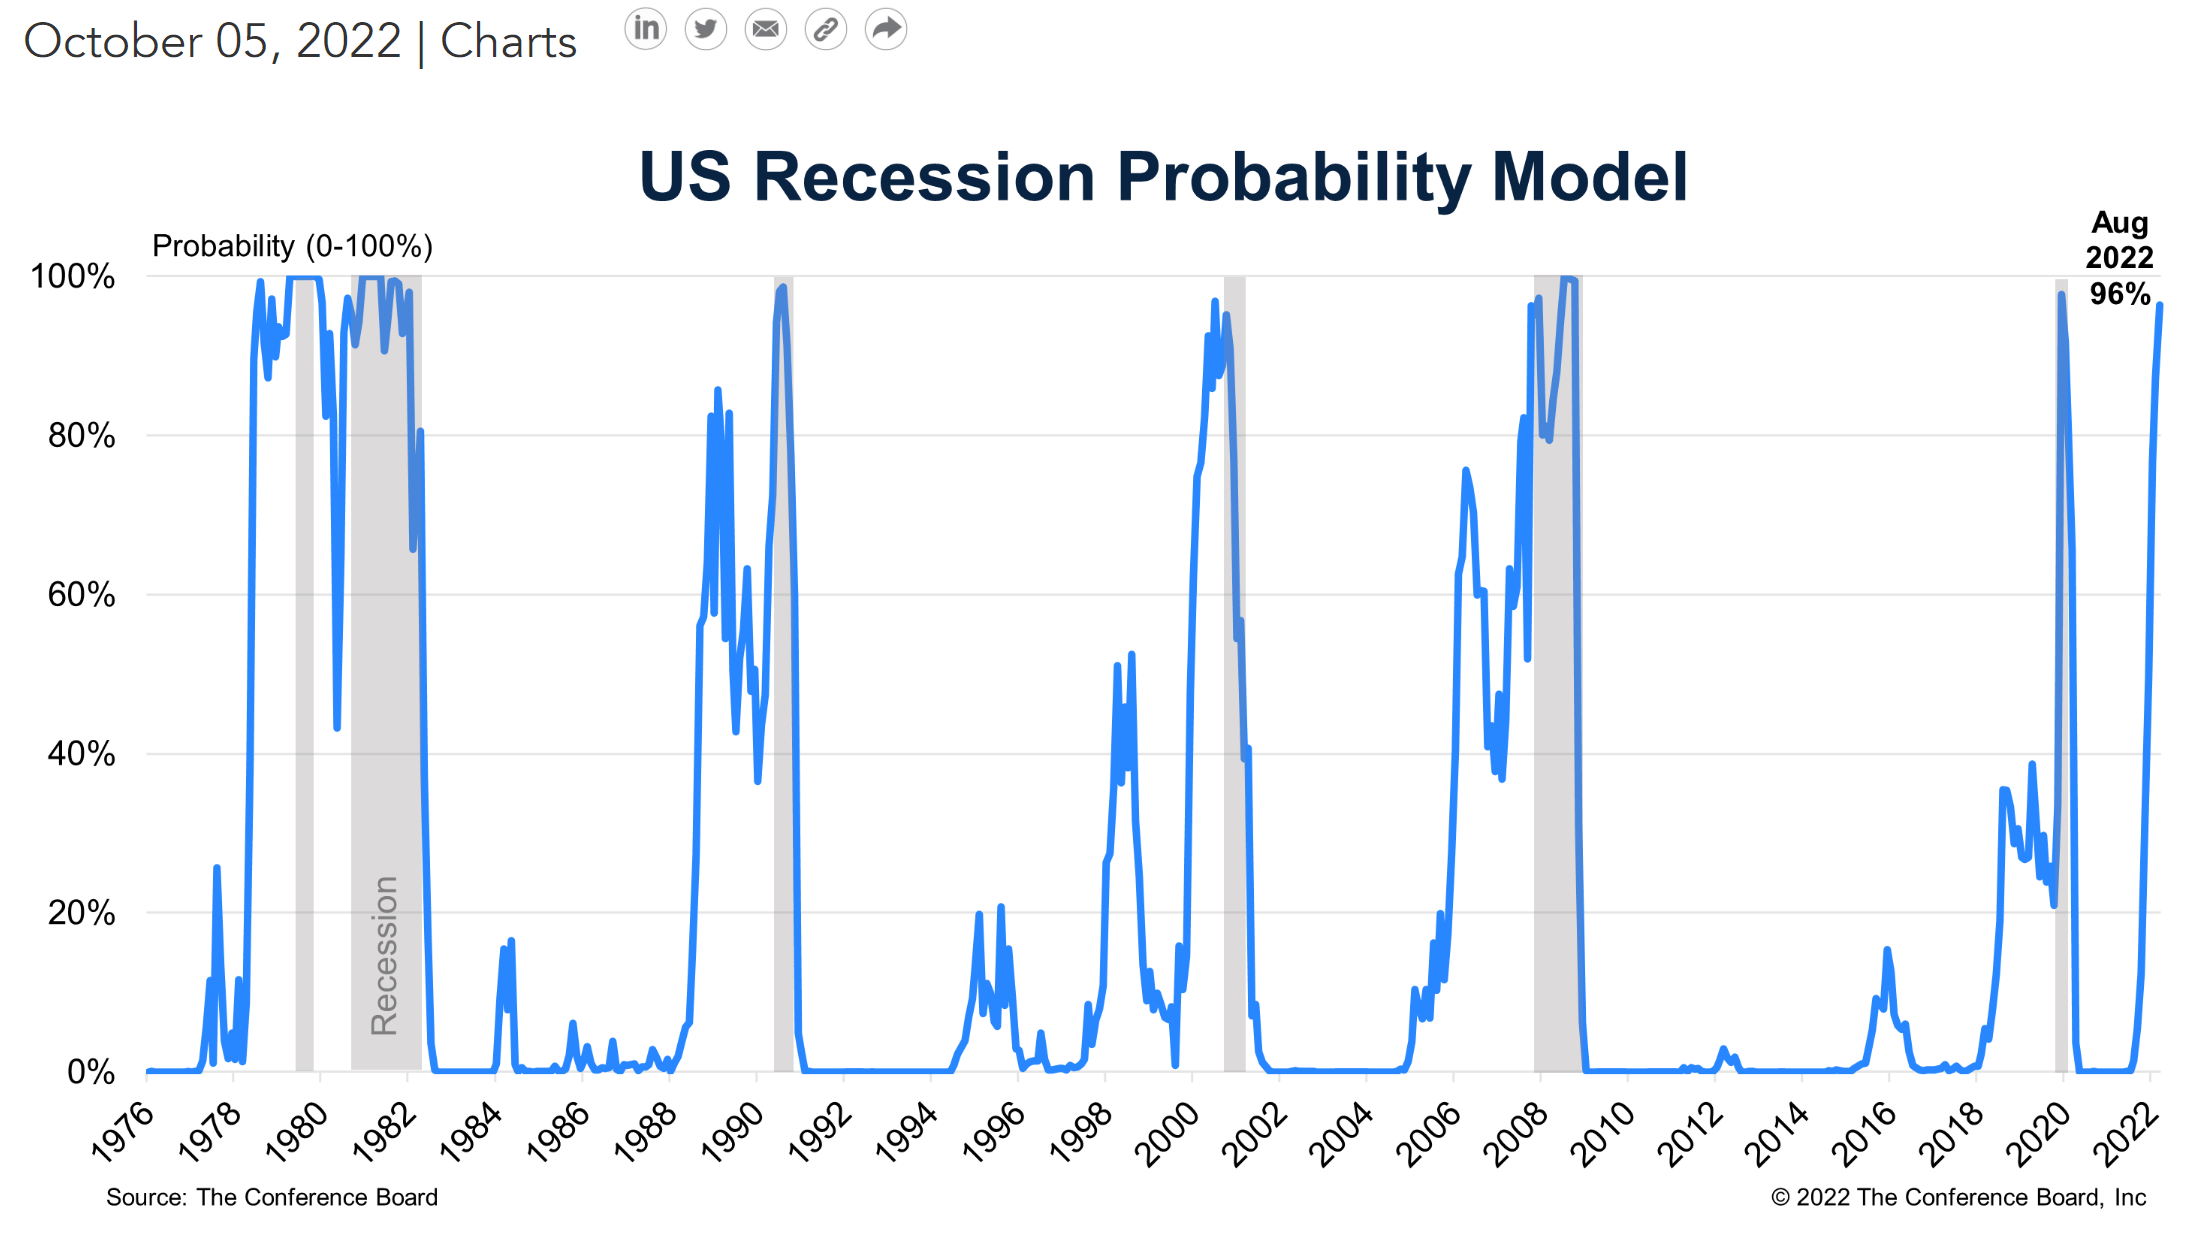
Another indicator that is flashing red is the yield curve, which is the most inverted in years (Figure 3). It appears the Federal Reserve is trying to engineer a recession to cool down soaring price inflation.
Figure 3 – 3M-10Yr yield curve is the most inverted in years (Axios)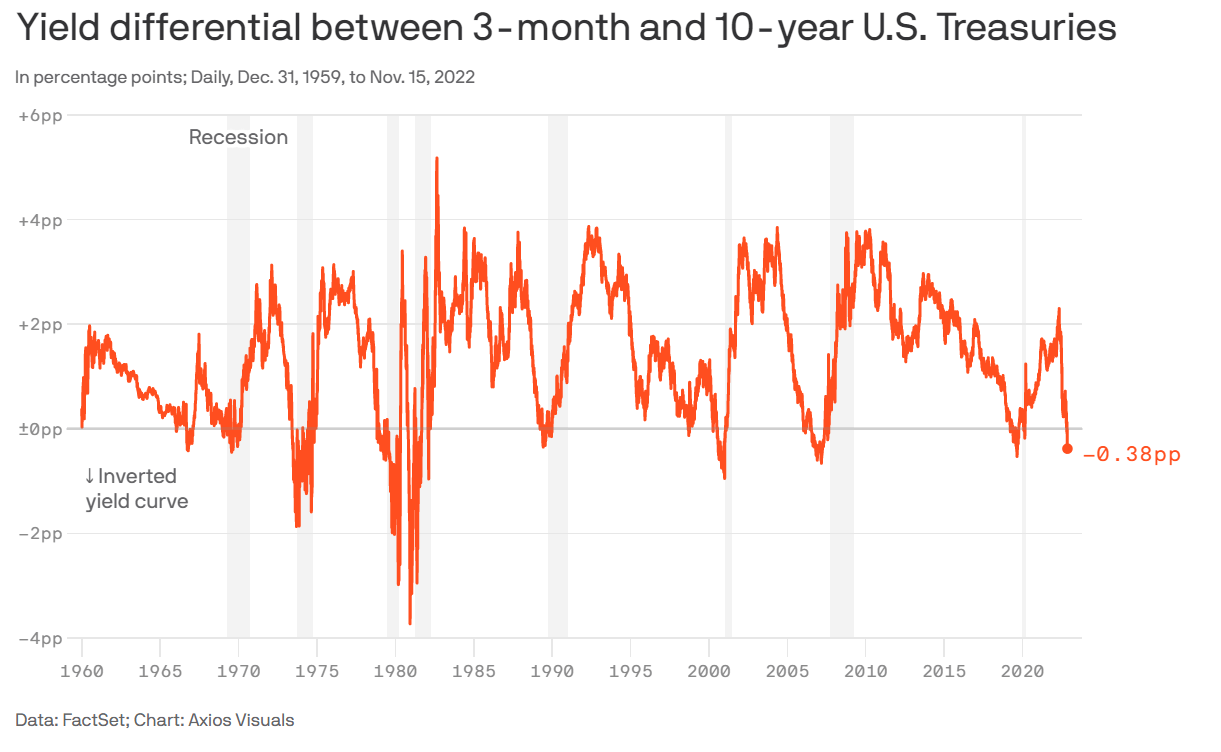
How will SCHD’s portfolio respond in a recessionary environment?
First, from Figure 1 above, we can see that in the brief COVID recession, the SCHD ETF had the 2nd smallest drawdown of the peer funds of 21.5%. So from historical performance, the SCHD ETF has shown an ability to outperform peers
More importantly, if we analyze SCHD’s portfolio composition, we can see that SCHD’s portfolio on average has below market valuation, with 13.4x P/E and 9.5x P/CF vs. 17.3x and 13.4x respectively for the S&P 500 (Figure 4). While cheap stocks may still decline significantly in a recession, in theory they should outperform the market and more expensive stocks.
Figure 4 – SCHD ETF fund characteristic (schwabassetmanagement.com)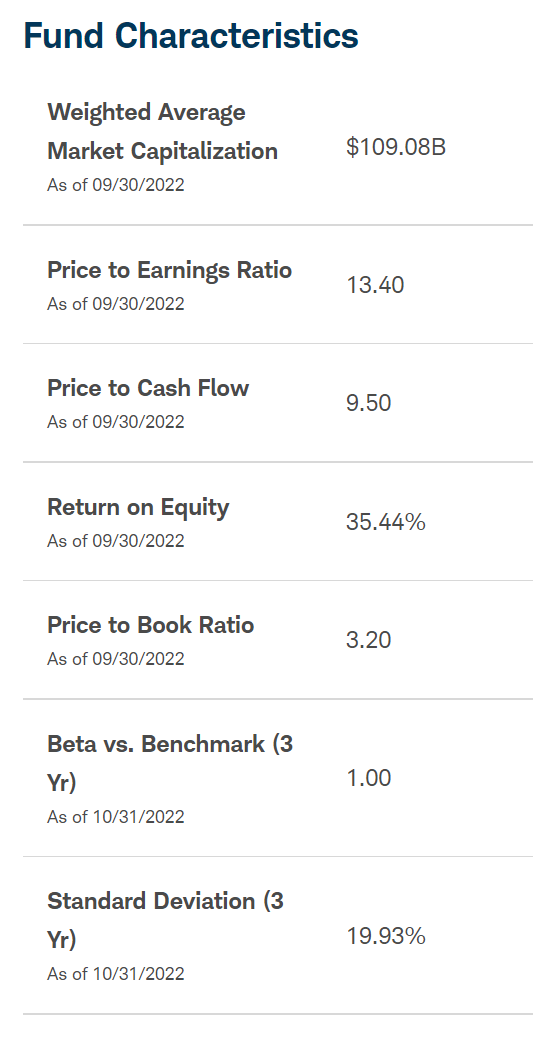
Hedging SCHD In A Worse Case Scenario
In a worst case scenario, investors can consider hedging their SCHD position with a short on the market, for example, using the SPDR S&P 500 ETF (SPY). Since markets peaked in December 2021, the SCHD ETF has outperformed the SPY ETF significantly, with the SCHD/SPY ratio rallying by almost 19%.
Figure 5 – SCHD has outperformed SPY since markets peaked (Author created with price chart from stockcharts.com)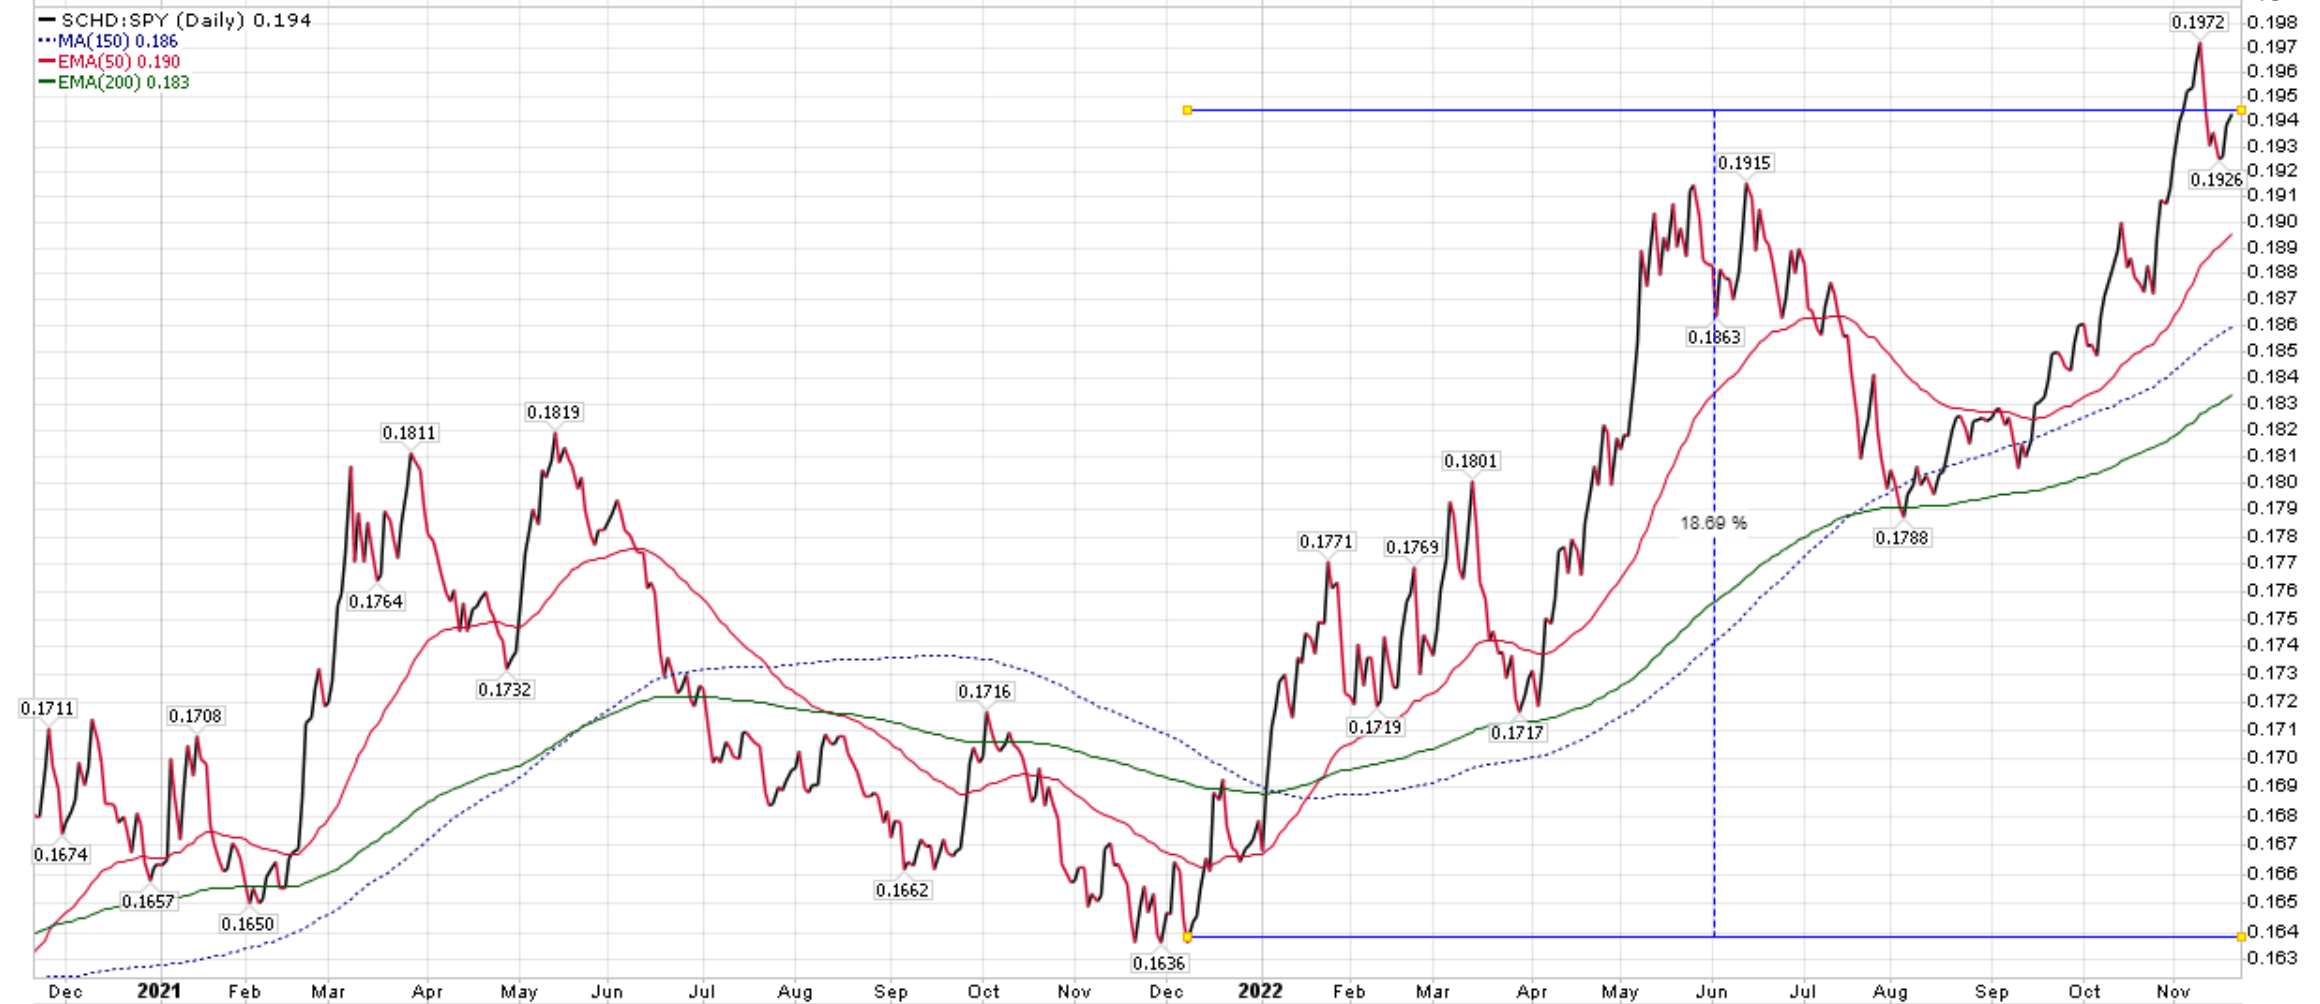
I believe this outperformance will continue, as SCHD’s portfolio is higher quality (high ROE, high cash flows to debt), and cheaper (lower P/E). It also helps to be paid a 3.3% distribution yield vs. 1.6% for the SPY ETF, which means the pair trade has a positive carry.
Conclusion
Using a composite scoring system, the SCHD ETF ranks best amongst peer funds, with strong long-term performance and distribution growth. Although I am concerned about a possible recession in 2023, SCHD’s high quality portfolio should outperform the market. In a worst case scenario, investors can consider hedging their SCHD position with shorts on the SPY ETF to ride out the volatility.
Be the first to comment