

Diego Thomazini
Written by Nick Ackerman, co-produced by Stanford Chemist. This article was originally published to the members of the CEF/ETF Income Laboratory on September 4th, 2022.
Liberty All-Star Equity Fund (NYSE:USA) and Liberty All-Star Growth Fund (NYSE:ASG) are two funds operated by ALPS Advisors. However, they aren’t managed by ALPS, which hires a group of managers to manage these funds. Both USA and ASG have an approach of having several fund managers divide up the assets to invest.
Both funds are also fairly straightforward equity funds. Besides the more unusual split of assets being managed by different managers, they essentially invest in a basket of equity positions that you’d see just about anywhere else. No leverage and no options strategy is being utilized on these funds.
However, another distinctive characteristic is the managed distribution plans. USA targets a 10% annual distribution paid out quarterly. This is broken down to 2.5% each quarter based on the NAV at the close on the Friday prior to each quarterly declaration date. ASG is quite similar, but they have an 8% target broken down to 2% each quarter.
That makes both of these funds stay relatively higher-yielding funds – in good times and bad. When the market is doing well, we expect these distributions would naturally rise higher as the underlying portfolio appreciates and pushes up the NAV. Just the opposite is true when we are in a bear market, such as we are now.
With distributions being “cut” due to the bear market reducing NAV, it might seem an unusual time that one would want to buy. However, one is also getting these funds now at a cheaper price as valuations come down. The fund’s premiums have even come down a bit from where they were elevated lately. They are still running over the longer-term average, but combining with the overall decline could still make either fairly attractive for a long-term investor.
Looking at each of these funds, I don’t think there is a clear winner at this time. While they seem relatively similar on the surface, they are positioned slightly differently. That makes them both viable choices, depending on one’s outlook.
USA Basics
- 1-Year Z-score: -0.34
- Premium: 3.15%
- Distribution Yield: 10.29%
- Expense Ratio: 0.92%
- Leverage: N/A
- Managed Assets: $1.568 billion
- Structure: Perpetual
USA’s investment objective is to “seek total investment return, comprised of long-term capital appreciation and current income. It seeks its investment objective through investment primarily in a diversified portfolio of equity securities.”
For this fund, the assets are split between five different managers. These managers are then categorized as either growth or value. They are targeting an allocation of 40% growth and 60% value.
USA Portfolio Target (ALPS Advisors)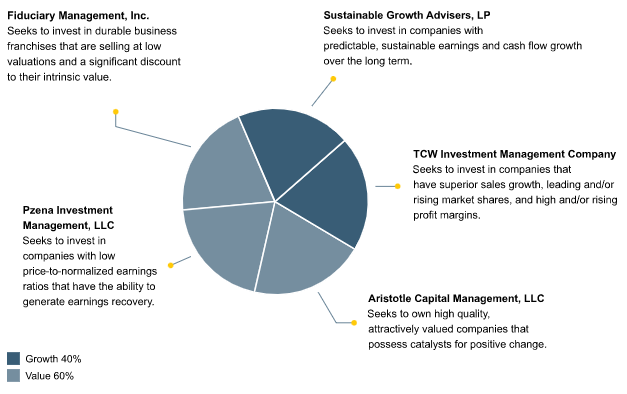
The fund’s significant size generally means liquidity isn’t going to be a problem for most investors. The expense ratio is lower than the 1% mark. For a closed-end fund, that’s fairly positive, as they generally run between 1% and 1.5% without considering leverage expenses.
ASG Basics
- 1-Year Z-score: -0.68
- Premium: 2.21%
- Distribution Yield: 7.93%
- Expense Ratio: 1.13%
- Leverage: N/A
- Managed Assets: $305.75 million
- Structure: Perpetual
ASG’s investment objective is to “seek long-term capital appreciation.” To achieve this, the fund will invest primarily in equity positions. They utilize “a diversified, multi-managed portfolio of small, mid-and large-cap growth stocks.” That provides “exposure to many of the industries that make the U.S. economy one of the world’s most dynamic.”
With that, ASG is split among three different managers. The difference here is that they are split amongst market cap and not investment styles.
ASG Portfolio Target (ALPS Advisors)
The fund is relatively small, but the average daily volume still appears to be more than enough for most retail investors. The fund’s expense ratio is also a bit higher than USA’s.
Portfolio Leads To Divergence In Performance
Both of these funds have offered rights offerings in recent years, so that will always be something to watch out for, as it can create some disruption. The disruption can often lead to better buying opportunities.
Over the longer run, we can see that ASG has come out on top. However, at one point, the gains were materially higher. At this time, they have essentially arrived at the same place.
YCharts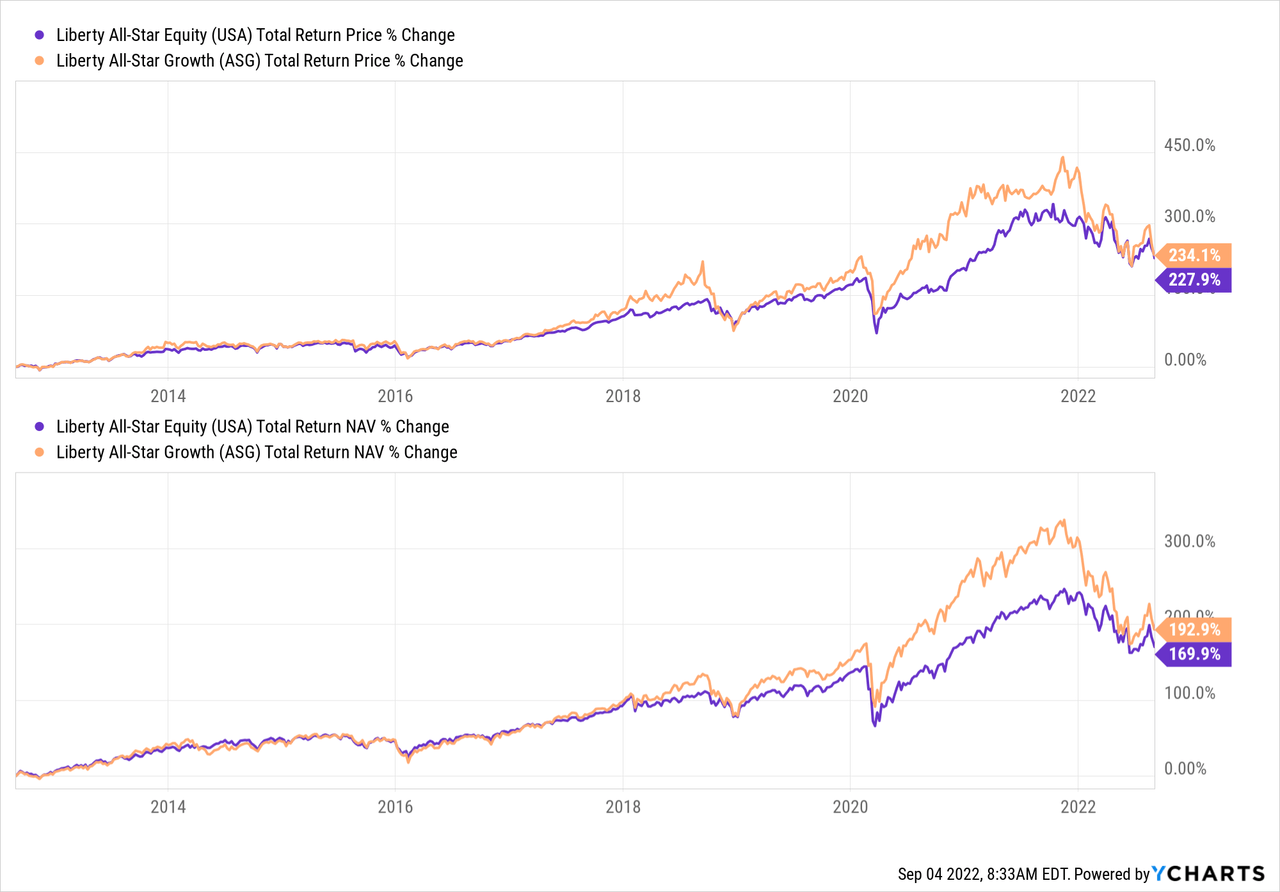
On a YTD basis, we can see more clearly why this is happening. USA is holding up relatively better than ASG.
YCharts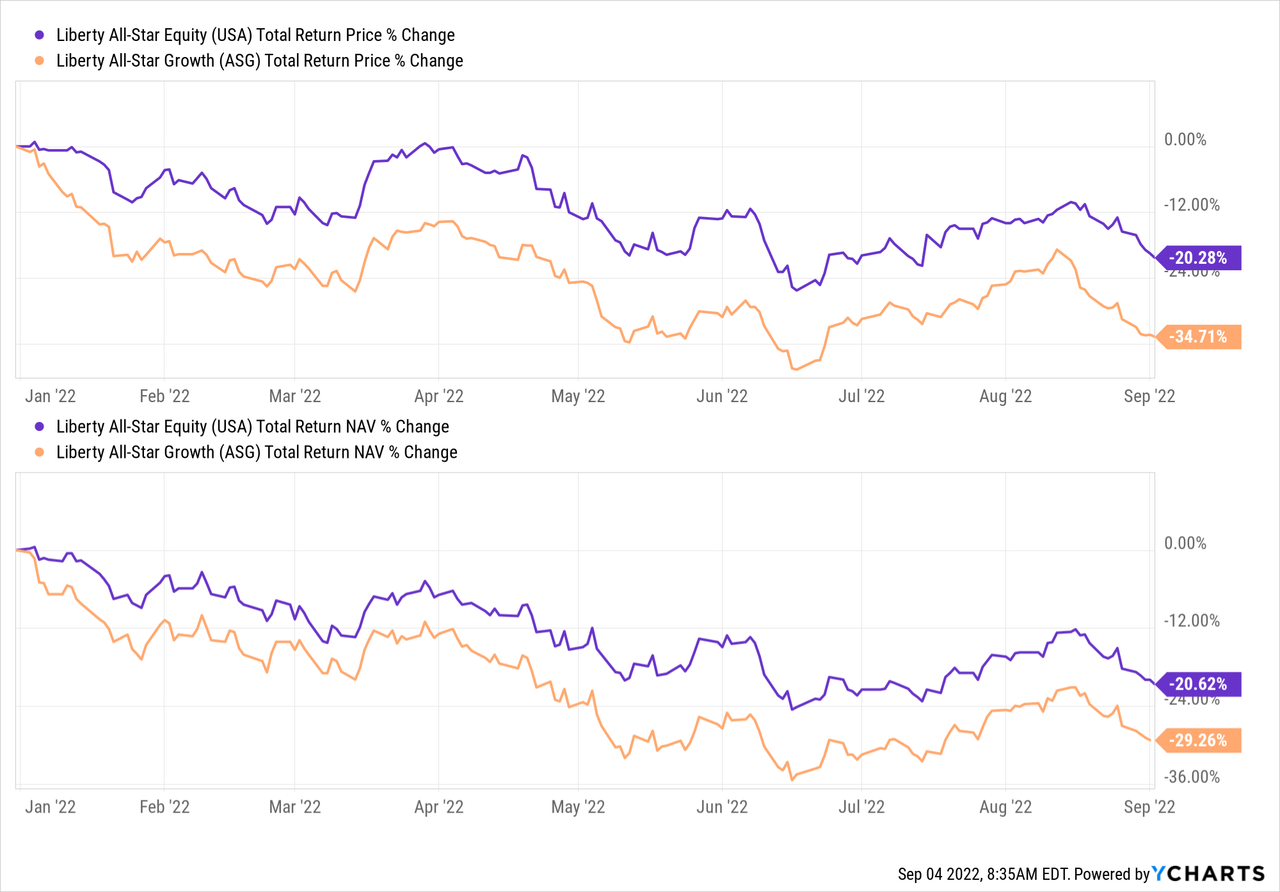
That goes precisely back to how the funds are positioned and why it matters what one’s outlook is. ASG is tilted more in favor of growth, which ends up making the tech allocation of the fund higher. Since they target small and mid-sized companies, they are more economically sensitive. That would be relative to USA’s exposure, which is entirely large-cap with a strong value tilt in the portfolio. That value tilt leads to a greater balance of diversification in the fund.
ASG carries a 28.6% weighting in the tech sector as of June 30th, 2020. This is then followed up by healthcare and industrial, interestingly. Healthcare is a relatively defensive sector, while industrials are also going to be cyclical.
USA carries a weighting of 20.6% in the tech space. This is then followed by the financial and consumer discretionary sectors. While the financial sector is rather cyclical in nature, the increasing interest rates should see some better profits too.
When taking a look at the top ten of each fund, I think it is interesting that it is somewhat apparent which fund is which without actually labeling them. (USA is on the left, and ASG is on the right.)
USA (left) and ASG (right) Top Ten (ALPS Advisors)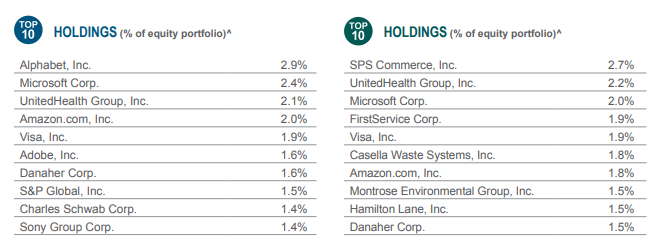
For me, I recognize or have heard of every name in the top ten for USA. ASG offers several names that overlap, that includes some of the common names we see in just about every CEF; names such as Microsoft (MSFT), Amazon (AMZN) and even UnitedHealth Group (UNH) is a quite recurring name.
It is positions such as SPS Commerce (SPSC), FirstService (FSV) and Casella Waste Systems (CWST) that I don’t recognize. These are examples of the mid-cap company exposure with $4.22 billion, $5.33 billion and $4.17 billion market caps, respectively.
Higher Distributions With Predictable Managed Payouts
As mentioned above, each fund has its managed distribution plan. Since these are reset every quarter, and we’ve been depreciating, that has been reflected in the lower distributions.
Unsurprisingly though, in the years leading up to this bear market, the fund’s distributions were generally heading the other way. That reflects the strong bull market of the last decade plus. The COVID crash was so quick that it isn’t even hardly noticeable in the distribution chart.
YCharts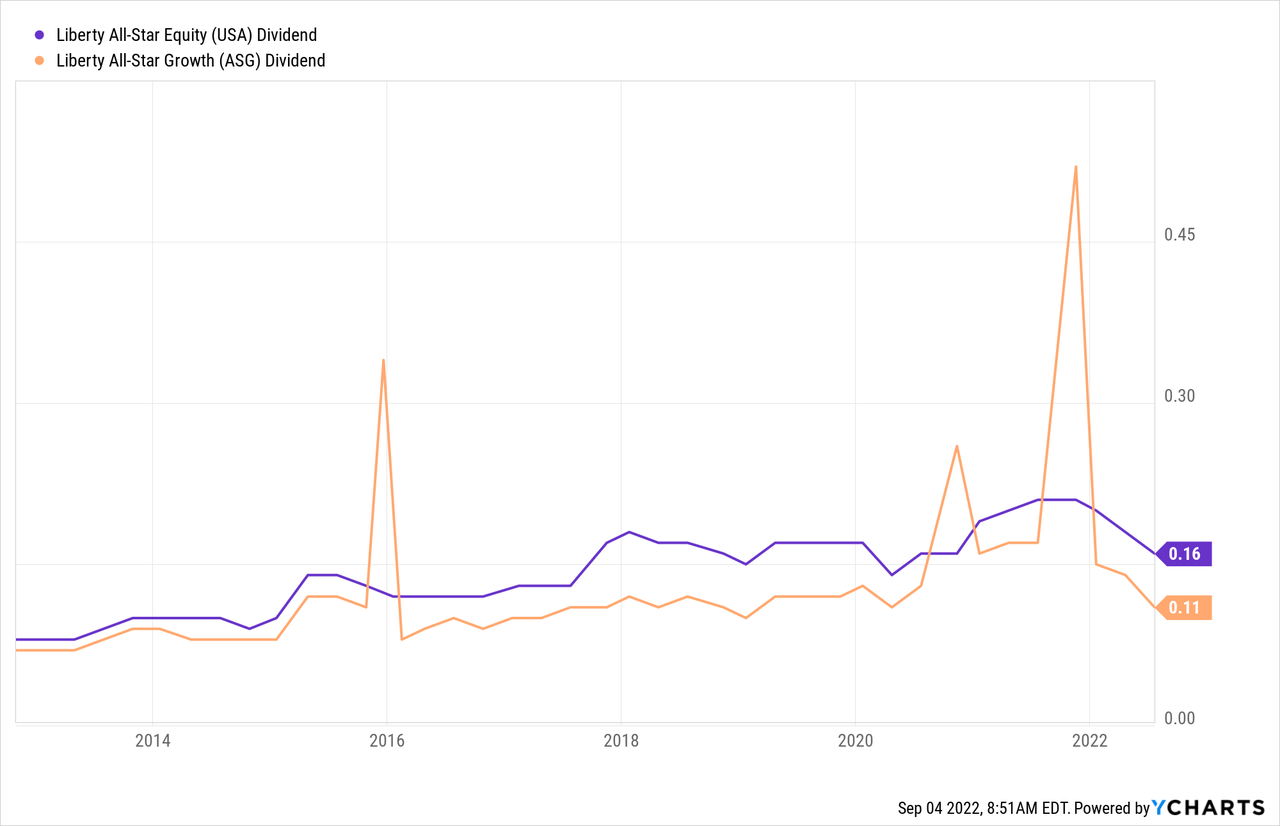
As stocks remain pressured, so do the distributions. Due to the fairly shallow premiums at the time, the funds are paying out right around what they have to earn. For USA, we see the latest distribution workout to a 10.29% yield on the share price and, on a NAV basis, 10.61%. Of course, that will be trimmed with the next payout, given the current level.
ASG, we see that the current distribution rate works out to 7.93%, with a NAV yield of 8.10%. Again, that would be reset with the next payout based on the current NAV.
ASG generally has a net investment loss due to its positioning in more growth-oriented investments. USA has positive income coming in, and so typically provides some net investment income. That would be thanks to its large-cap focus and companies that provide a higher focus on dividends as their highest growth days tend to be behind them.
That being said, capital gains still make up a massive part of its distribution. NII coverage came in at 4.37%, but that’s better than a loss of $1.142 million for ASG. ASG has to provide gains to cover the expenses of the fund plus the distribution.
Premiums But Offset By Declines?
In terms of valuations on the discount/premium basis for both of these CEFs, they are both elevated over their longer-term average. However, it has come down from how elevated they were more recently.
YCharts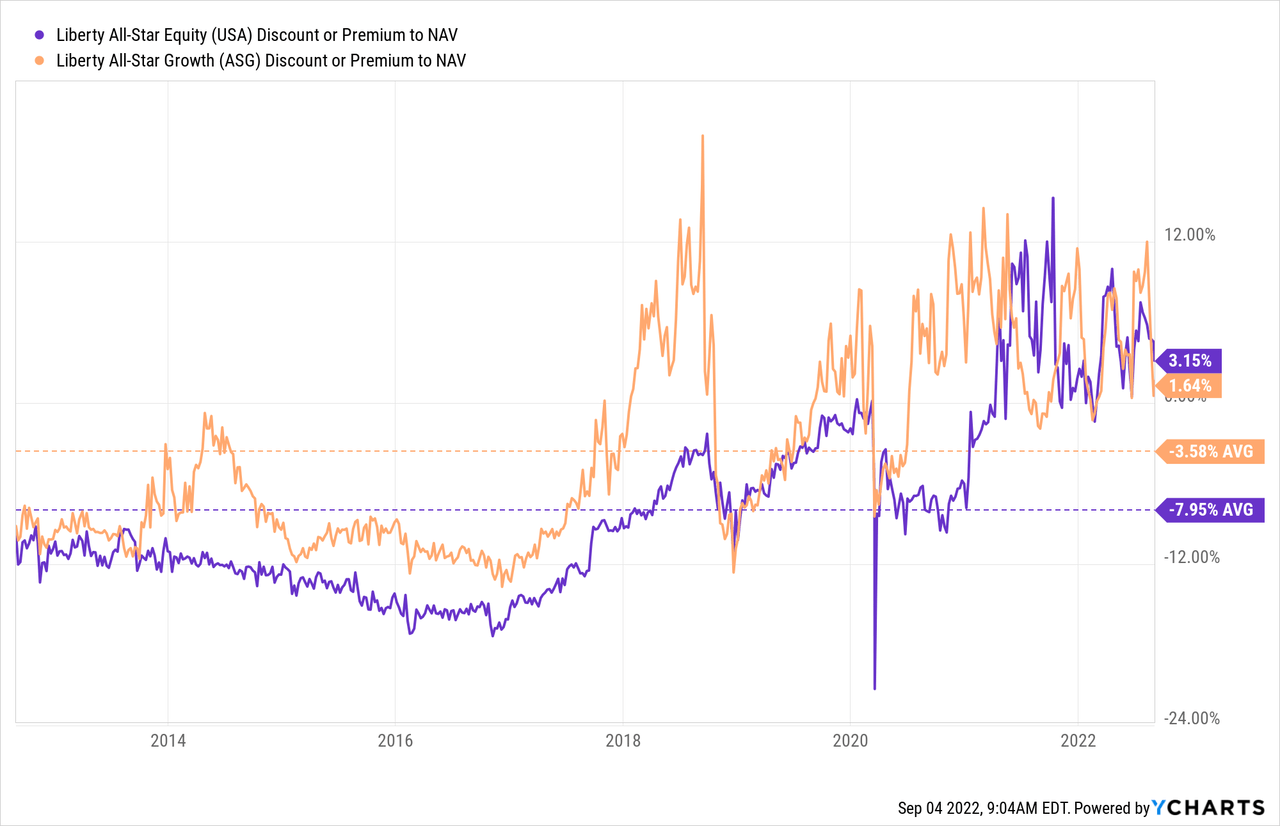
Ideally, I wouldn’t complain if we could get these funds at a 10%+ discount. I’m not so sure we will see those levels again. These funds have seemed to find a lot of support from investors in more recent years. We typically see during volatile bear markets that CEFs are some of the first to sell off hard. Generally, widening out the discounts significantly. Instead, these funds have still been hanging onto these heightened premiums.
It also goes back to just how far these funds have fallen more recently; with equity declines across the board, valuations have come down. If we look at it from that angle, the current premiums aren’t as high as one might think.
This, again, is where an investor’s personal outlook can come into play. If one believes we are set to head even lower from here, then holding off, for now, could make a lot of sense. If one is a longer-term investor, we are taking advantage of these more depressed prices for what could reward us handsomely years later.
Conclusion
Both USA and ASG offer an interesting choice in today’s market. If one wanted either, the more appropriate fund would come down to one’s outlook. If you believe we head significantly lower from here, just waiting to invest any capital could be prudent.
If you believe in going relatively more defensive, then USA’s broader and value-oriented exposure could hold up better. If you want to get more aggressive and believe that growth will rebound and lead the way higher, then ASG could be your solid bet.
Either way, you’ll receive higher than usual distribution yields from these funds. The distributions are based on appreciation or depreciation of the fund. So if we keep falling, the “cuts” could keep coming. Conversely, should we rebound, we will also likely see these payouts increase.
Be the first to comment