

Vertigo3d
Introduction
Despite the tragic loss of life following the Russian invasion of Ukraine, USA Compression Partners (NYSE:USAC) saw a stronger outlook as Europe rushes to find gas outside of Russia that as my previous article discussed, stood to help improve the sustainability of their very high distribution yield of 11.81%. Fast-forward several months and it now seems the worst is over with their recovery gaining momentum, as discussed within this follow-up analysis that also reviews their subsequently released results for the second quarter of 2022.
Executive Summary & Ratings
Since many readers are likely short on time, the table below provides a very brief executive summary and ratings for the primary criteria that were assessed. This Google Document provides a list of all my equivalent ratings as well as more information regarding my rating system. The following section provides a detailed analysis for those readers who are wishing to dig deeper into their situation.
Author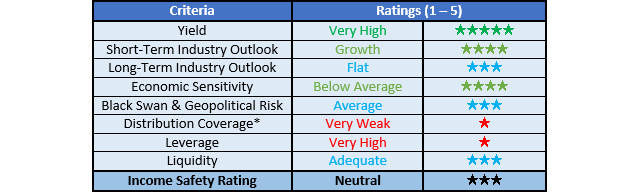
*Instead of simply assessing distribution coverage through distributable cash flow, I prefer to utilize free cash flow since it provides the toughest criteria and also best captures the true impact upon their financial position.
Detailed Analysis
Author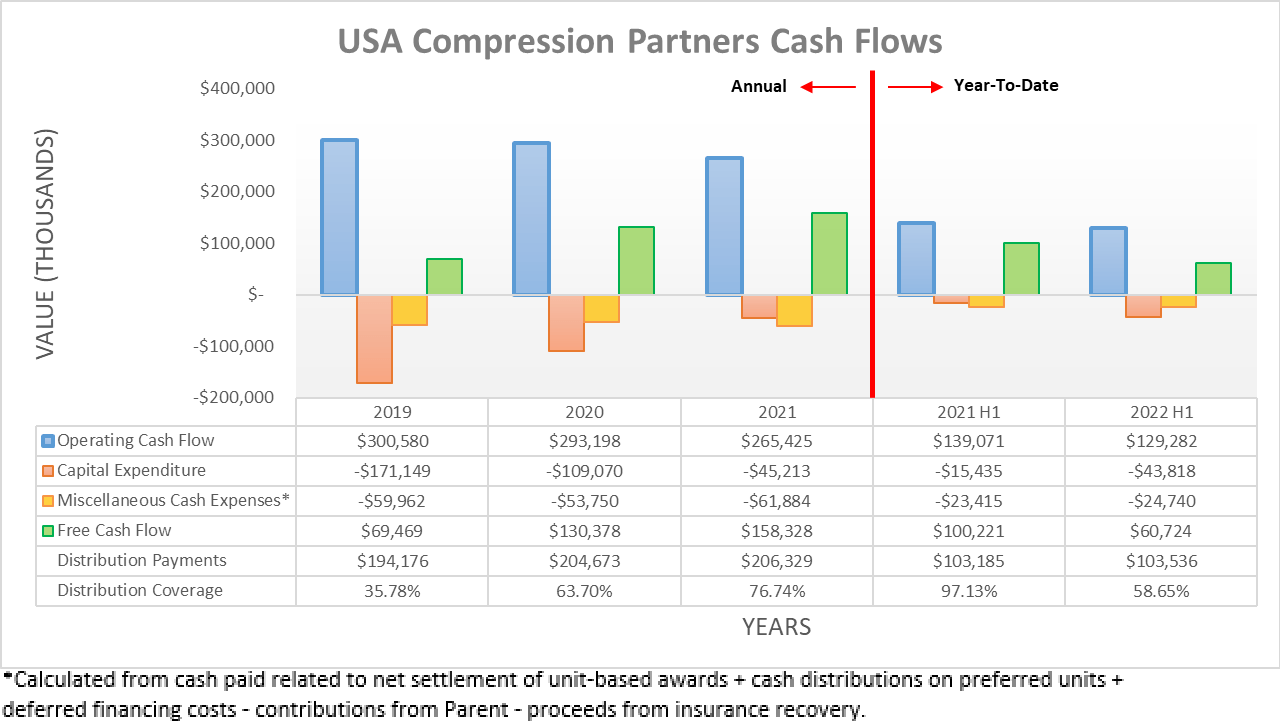
The first quarter of 2022 saw its operating cash flow weighed down by a relatively large working capital build, which mostly reversed during the second quarter with their result landing at $129.3m for the first half, up from only a mere $35.1m during the first quarter. This means the second quarter saw a result of $94.2m, thereby providing a welcomed cash infusion that lifted their free cash flow to $60.7m for the first half, up from only a mere $2.2m during the first quarter.
If removing the temporary working capital movements from their results, it sees their underlying operating cash flow at $73.7m during the second quarter of 2022, which is still ahead of their previous equivalent result of $67.4m during the first quarter. Upon looking back one year prior, their respective equivalent results during the first and second quarters of 2021 were $67.8m and $69.7m, which means that the first quarter of 2022 was essentially flat year-on-year on an underlying basis. When conducting the previous analysis, it was hoped this would mark an inflection point. Thankfully this was proven apt with the second quarter seeing a modest improvement of 5.74% year-on-year, thereby putting an end to their deteriorating cash flow performance.
Regardless of whether viewed sequentially or year-on-year, their latest result indicates that the worst is over. Despite this stronger financial performance, their distribution coverage for the first half was still only a very weak 58.65% as their cash outflows outpace their cash inflows but thankfully, there is a brighter outlook ahead as gas drilling in the United States powers ahead, as the graphs included below display.
YCharts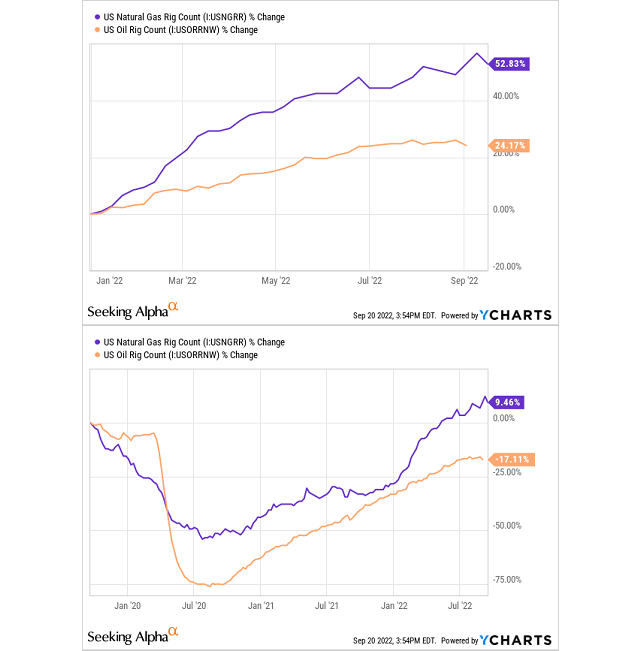
Whilst the oil rig count in the United States saw a solid increase thus far into 2022 with a 24.17% increase, the gas rig count saw a far larger increase of 52.83%. In fact, if zooming out to view the last three years, not long before the Covid-19 pandemic struck, it can be seen that the gas rig count is actually 9.46% higher, whereas the oil rig count is 17.11% lower. This makes it abundantly clear that gas production in the United States is enjoying a stronger recovery from the severe downturn of 2020 than oil production, which is not surprising given the events in Eastern Europe that are reshaping the global energy market and lifting demand for United States gas, as discussed within my previously linked article.
Since their compression equipment is utilized to help transport gas, higher associated drilling should translate into increased demand for their services as a result of higher gas production. As demand for their compression equipment increases, so should their financial performance as their fleet utilization increases and facilitates higher rates. Apart from hopefully lifting their distribution coverage above an adequate 100%+, it should also help reduce their subsequently discussed leverage.
There is an inherent lag between higher drilling and higher production and thus some of the benefits may not be forthcoming until 2023. Regardless, this still shows tangible proof of a strong recovery in their market that further indicates the worst is over with their recovery gaining momentum, which is a view they recently echoed themselves, as per the commentary from management included below.
A lot of people looked at us and frankly, don’t understand our business. They look at it and go, wow, your yield is low double-digits, depending on the day, it’s 11% to 13% or 14% distribution yield people go, why is this so high? This must be a risky business to which we respond just like you did, Salmon, “Hey, we’ve been through worse. Things are going from the bottom left of the page to the top right of the page, if we could power through like we did a couple of years ago and we powered through multiple down cycles, why would you be concerned today?”
-USA Compression Partners Q2 2022 Conference Call.
Author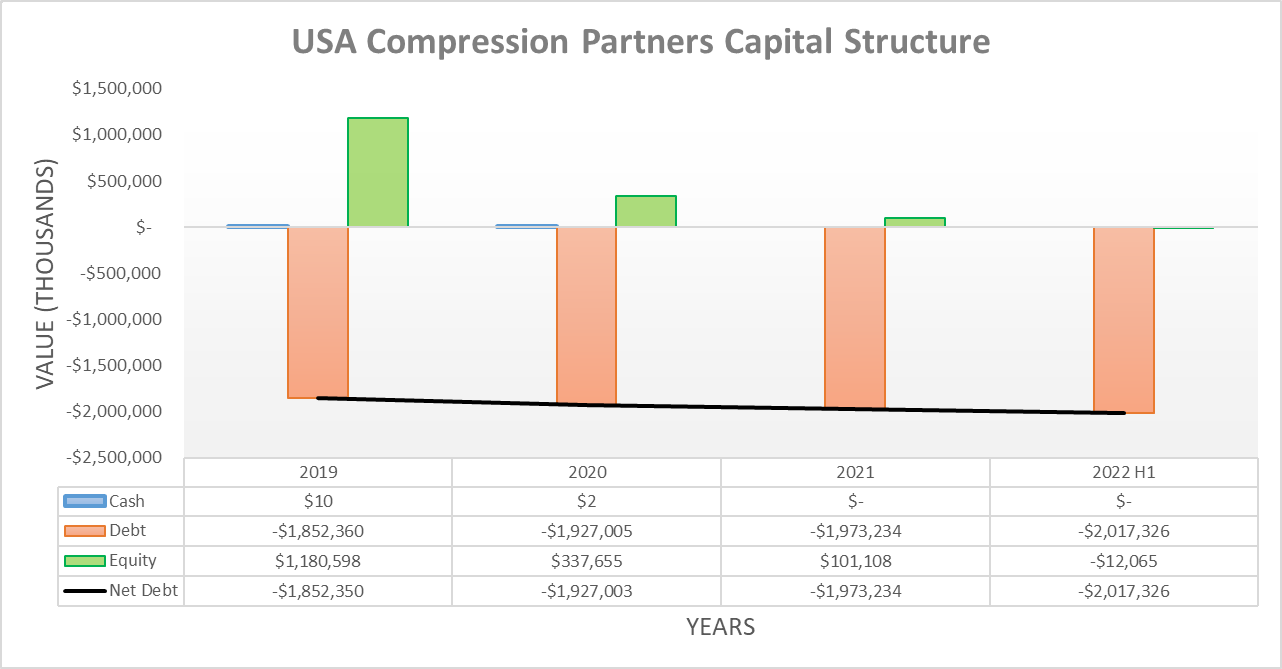
Thanks to their working capital build reversing during the second quarter of 2022, their net debt edged ever-so-slightly lower to $2.017b versus its level of $2.023b when conducting the previous analysis following the first quarter. Whilst positive, their net debt may edge higher during the second half as their cash outflows outpace their cash inflows, although higher gas drilling points favorably for this to cease or at minimum, slow down further during 2023.
Author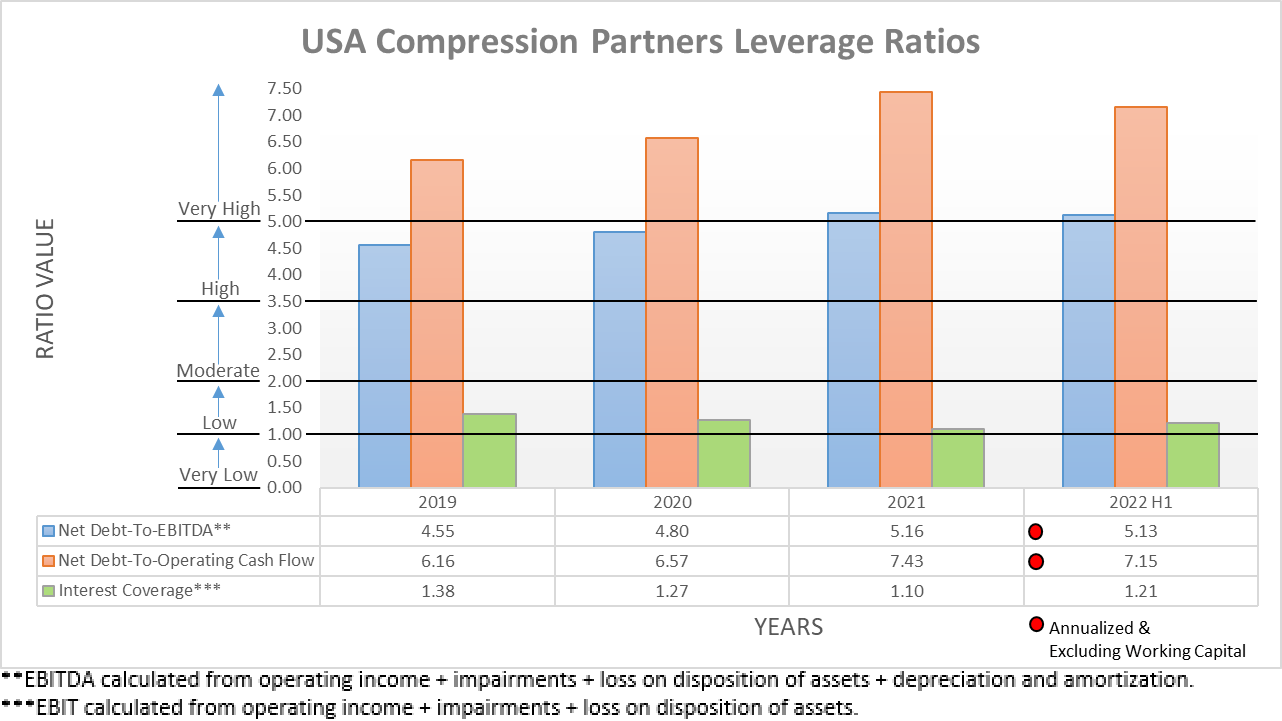
After seeing their leverage increase following the first quarter of 2022 when conducting the previous analysis, their stronger financial performance and lower net debt following the second quarter now sees their leverage slightly below where it ended 2021. This is evident with their respective net debt-to-EBITDA and net debt-to-operating cash flow now at 5.13 and 7.15 versus their respective results of 5.36 and 7.50 following the first quarter of 2022 and 5.16 and 7.43 following the end of 2021. Whilst this improvement is only small and thus leaves more required to restore their financial health as they remain above the threshold of 5.01 for the very high territory, at least their direction is positive.
As for the second half of 2022, whether their leverage increases slightly along with their net debt will depend if their earnings and cash flow performance increase to a comparable extent and given the positive outlook, this seems realistic. Even if their leverage edges higher, thankfully this should change during 2023 as the benefits of higher gas drilling flow through to their financial performance.
Author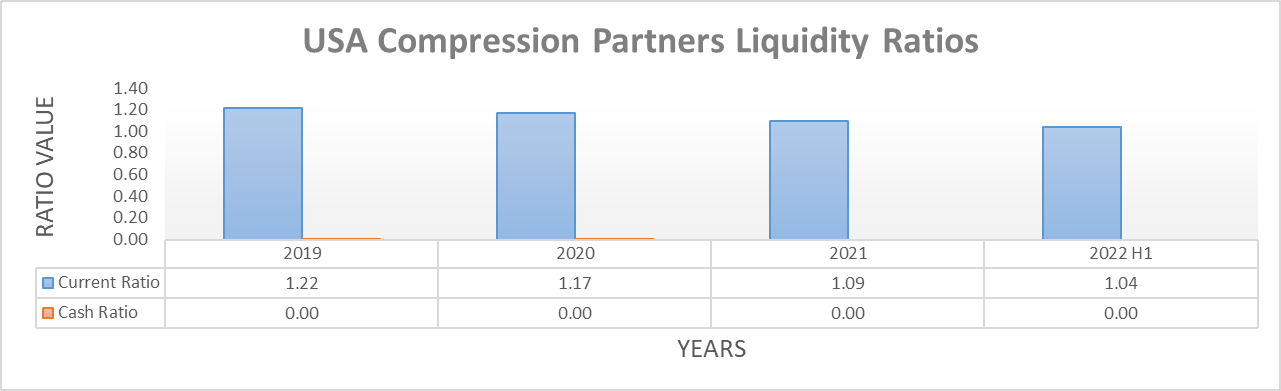
On the surface, their adequate liquidity appears to have only seen a routine fluctuation following the second quarter of 2022 with their current ratio now at 1.04 versus its result of 1.27 when conducting the previous analysis following the first quarter. Although beneath the surface, the more important consideration is the covenant leverage ratio limit imposed by their credit facility, which they almost breached heading towards the end of 2021. This was averted thanks to their lenders increasing its limit and thus providing more time for a recovery, which appears to be bearing fruit with their latest result showing a solid improvement, as per the quote included below.
Our bank covenant leverage ratio was 4.9 times, a healthy reduction of over 5% from last quarter.
-USA Compression Partners Q2 2022 Conference Call (previously linked).
Their latest covenant leverage ratio of 4.90 marks a sizeable improvement for only one quarter versus its result of 5.18 when conducting the previous analysis following the first quarter of 2022. This now sits comfortably beneath their upcoming limit of 5.25 that comes into effect once the third quarter ends, thereby providing a margin of safety to sustain their distributions throughout the second half in case their debt edges higher and thus pushes their covenant leverage slightly higher, similar to their previously discussed net debt-to-EBITDA and net debt-to-operating cash flow. At least when looking ahead into 2023, their covenant leverage ratio should also continue seeing further improvements as their financial performance continues improving on the back of higher gas drilling. If interested in further details regarding their credit facility covenant leverage ratio, please refer to my earlier article that covered this aspect in detail.
Conclusion
After seeing an inflection point during the first quarter of 2022, thankfully the second quarter swiftly followed with their recovery gaining momentum from higher gas drilling in the United States and thus signals higher demand for their services on the horizon. Whilst their very high leverage still poses risks, it should improve during 2023 and thus see their units rerate to a higher valuation as risks subside. Since their distribution yield is still at double-digit levels even though the worst is over, it should not be surprising that I still believe my strong buy rating is appropriate.
Notes: Unless specified otherwise, all figures in this article were taken from USA Compression Partners’ SEC Filings, all calculated figures were performed by the author.
Be the first to comment