

US Dollar Talking Points:
- The US Dollar is bouncing after completing a double-top formation last week, finding support at the projected target from the formation on Wednesday and then rallying into the end of the week.
- This week brings the FOMC and 75 basis points seems to be baked into the cake. The bigger question is what’s next, and this is not a quarterly meeting so there will not be updated forecasts, and we’re likely going to have to rely on hints from Chair Powell during the presser.
- The analysis contained in article relies on price action and chart formations. To learn more about price action or chart patterns, check out our DailyFX Education section.
Recommended by James Stanley
Download our US Dollar Forecast
The US Dollar broke down aggressively in the early-portion of last week. The prior Friday saw price action fail to breakout upon a test of resistance at 113.92, which set up a possible double top formation. Amazingly, that formation started to trigger later on the same day that the high was hit on Friday the 21st as a fast reversal showed in both currencies and stocks. At the source was a series of reports that came out that morning, first from the Wall Street Journal, indicating that the Fed may be nearing a point where they look at slowing rate hikes. And then a BoJ intervention and some comments from Mary Daly helped to further tilt the tide until we had a strong bullish move in equities matched with an aggressively bearish move in the USD.
The neckline for the double top was at a familiar spot, as the area around 111.73 had helped to set resistance for an ascending triangle formation earlier in October. It was broken-through last Monday and bears continued to punch prices lower for the next two days until support finally showed at 109.62, which was the projected target from the formation. I wrote about that on Wednesday morning and prices have been clawing higher ever since.
US Dollar Four-Hour Price Chart
Chart prepared by James Stanley; USD, DXY on Tradingview
USD Bigger Picture
As I had shared last Monday before the double top started to fill-in, the formation could complete with USD remaining in a bullish state longer-term. And this is largely due to just how quickly the advance hit in the first place.
But, taking a step back on the daily chart and we can see what a contentious area that 111.74 spot is, as it was prior support and until bulls can force a breach, it’s possible lower-high resistance.
If bulls can push price action beyond that spot, the next area of resistance comes in at 112.58, after which 113.05 and 113.50 comes into play. For near-term support, I’m tracking 110.79 before the 110-110.25 zone comes back into the picture.
US Dollar Daily Chart

Chart prepared by James Stanley; USD, DXY on Tradingview
EUR/USD
A large component of that breakdown in the USD was a breakout in EUR/USD. This was a big focal point of that Monday article, looking at the possibility of a short squeeze after a series of higher-lows had priced-in to the pair. And there was an ECB rate decision on Thursday that was expected to bring another 75 basis point hike, which happened; but what’s happened after is likely less enthusiastic for Euro bulls as prices have continued to reverse after topping-out at 1.0095.
This morning brought another elevated inflation print out of Europe with flash inflation coming in at 10.7% against at 10.2% expectation. The flash reading means early which also means the possibility of revisions; but given the pair’s performance after the ECB rate decision last week, it doesn’t appear as though there’s much optimism around the single currency at the moment.
Nonetheless, like the USD daily chart above, a hold at higher-low support could keep the door open for an extension in the bullish move. If bears can breach that, there may be a return of the bearish trend to work with but I’m tracking that zone from .9862-.9900, and looking to that as somewhat of a decision-point in the matter.
EUR/USD Daily Price Chart
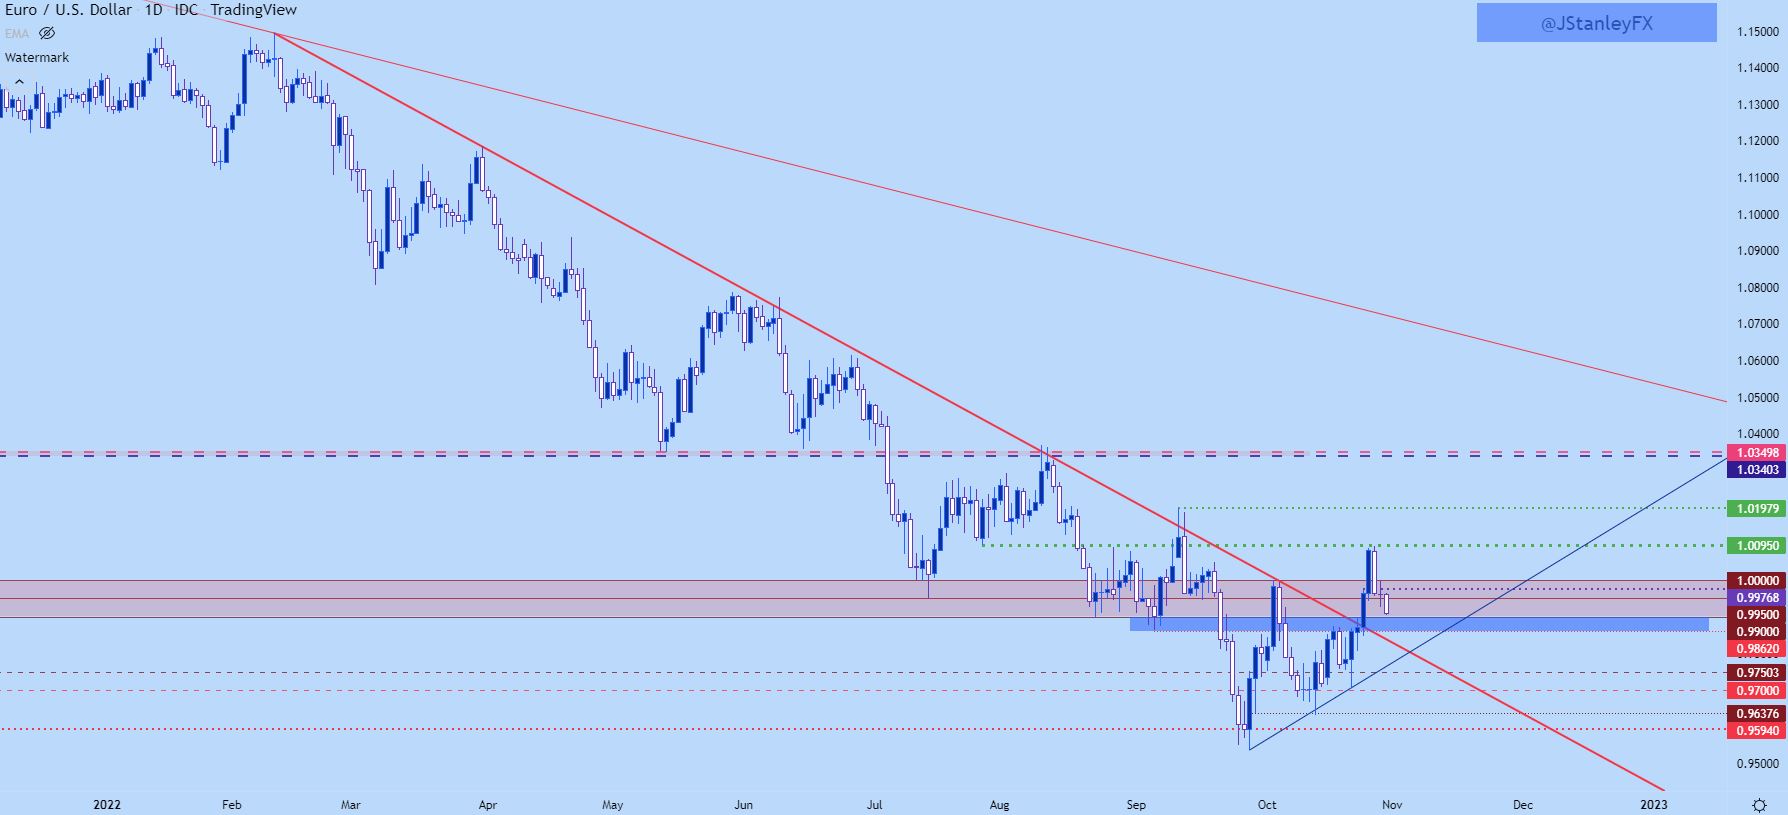
Chart prepared by James Stanley; EURUSD on Tradingview
GBP/USD
GBP/USD is working on a descending triangle formation with support holding around prior resistance, taken from the psychological level at 1.1500. That resistance inflection was earlier in October and showed just after the collapse-like move in the pair.
As USD was sinking last week, Cable put in a large and fast jump until finally setting a fresh monthly high at 1.1646. That led to a pullback to 1.1500, which led to another bounce, but this time price put in a lower-high which leads to a descending trendline that makes up the topside of the formation.
If sellers can push through 1.1500, I’m tracking next support at 1.1459, after which 1.1411 comes into play. Below that, 1.1350 is followed by 1.1282, and then another key zone appears around 1.1180-1.1210.
For invalidation of the formation, a push above the lower-high would be an early indication, but if bulls can break 1.1646 the door quickly re-opens for a resistance test in another key area, the same that was in-play twice in late-August and early-September from 1.1711-1.1750.
GBP/USD Four-Hour Price Chart
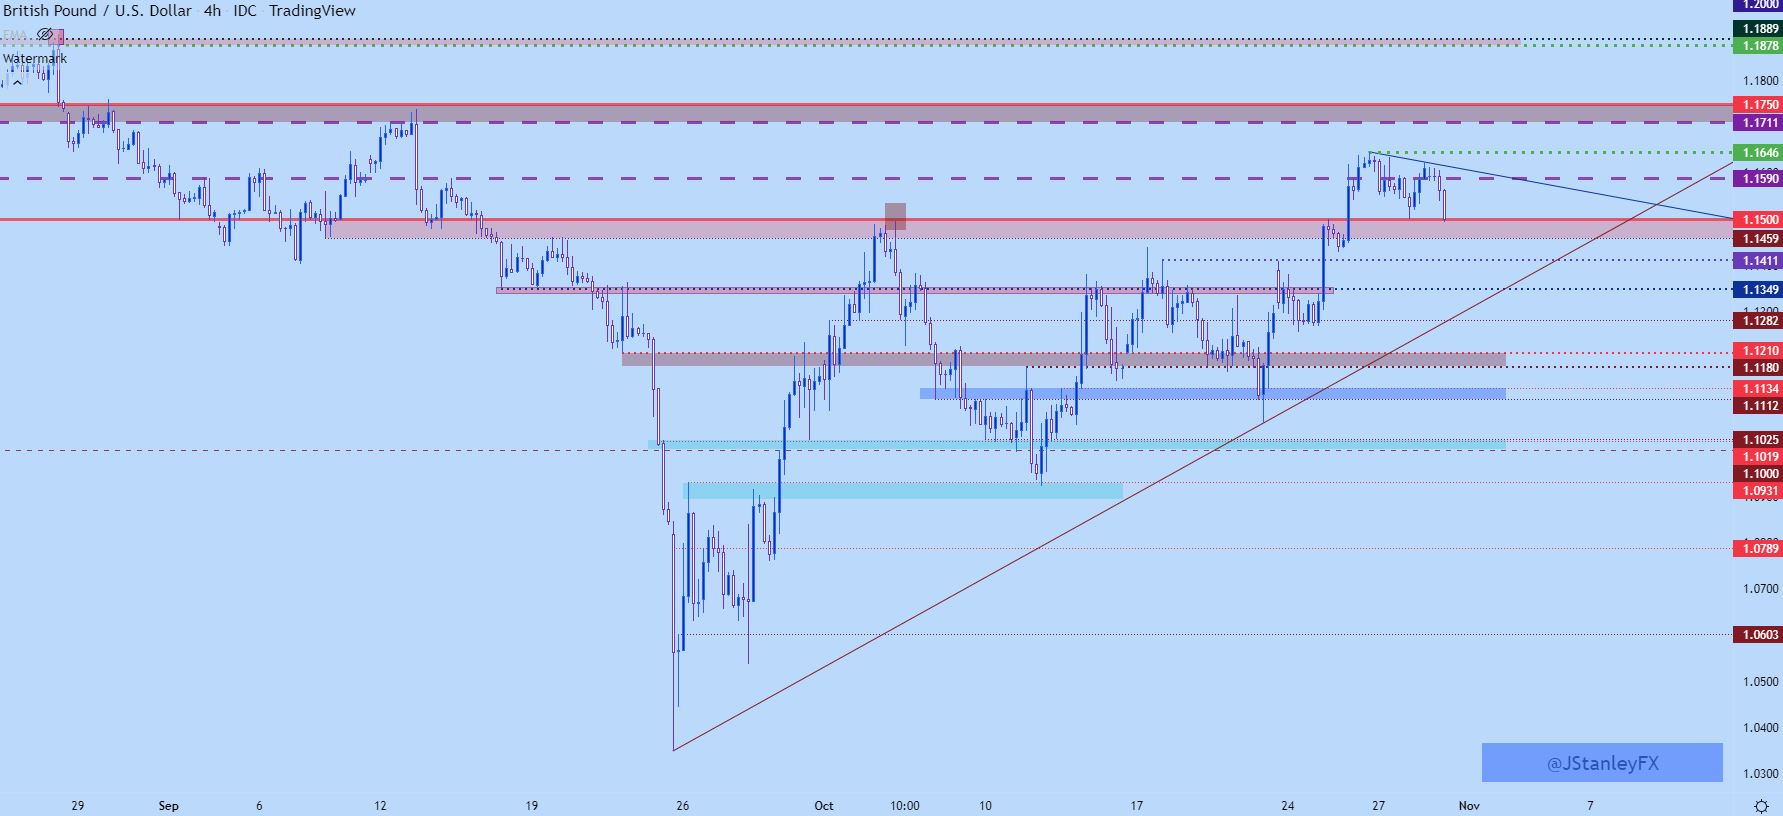
Chart prepared by James Stanley; GBPUSD on Tradingview
USD/CAD
Last week brought a hike from the Bank of Canada with a softer touch, as the bank pushed rates by 50 basis points as opposed to the 75 that many were expecting. Nonetheless, the currency showed strength on the back of that rate decision against the US Dollar as USD/CAD pushed down for another test of the 1.3500 psychological level.
And, as USD has lifted again, so has USD/CAD, with price now back in a zone of prior support that spans from 1.3652-1.3700.
At this point, there are range tendencies longer-term given the mean reversion that’s built over the past month and change but there also may be tonality of an inverse head-and-shoulders pattern here. And given the level of stretch in DXY looked at above, which isn’t showing as strongly in USD/CAD, this could keep the pair as an attractive venue for bearish USD themes until something shifts.
As for levels – if bulls can push through 1.3700, there’s a bearish trendline to contend with. Above that, the resistance zone that was in-play multiple times in October comes into view and that runs from around 1.3833 up to 1.3850.
USD/CAD Four-Hour Chart
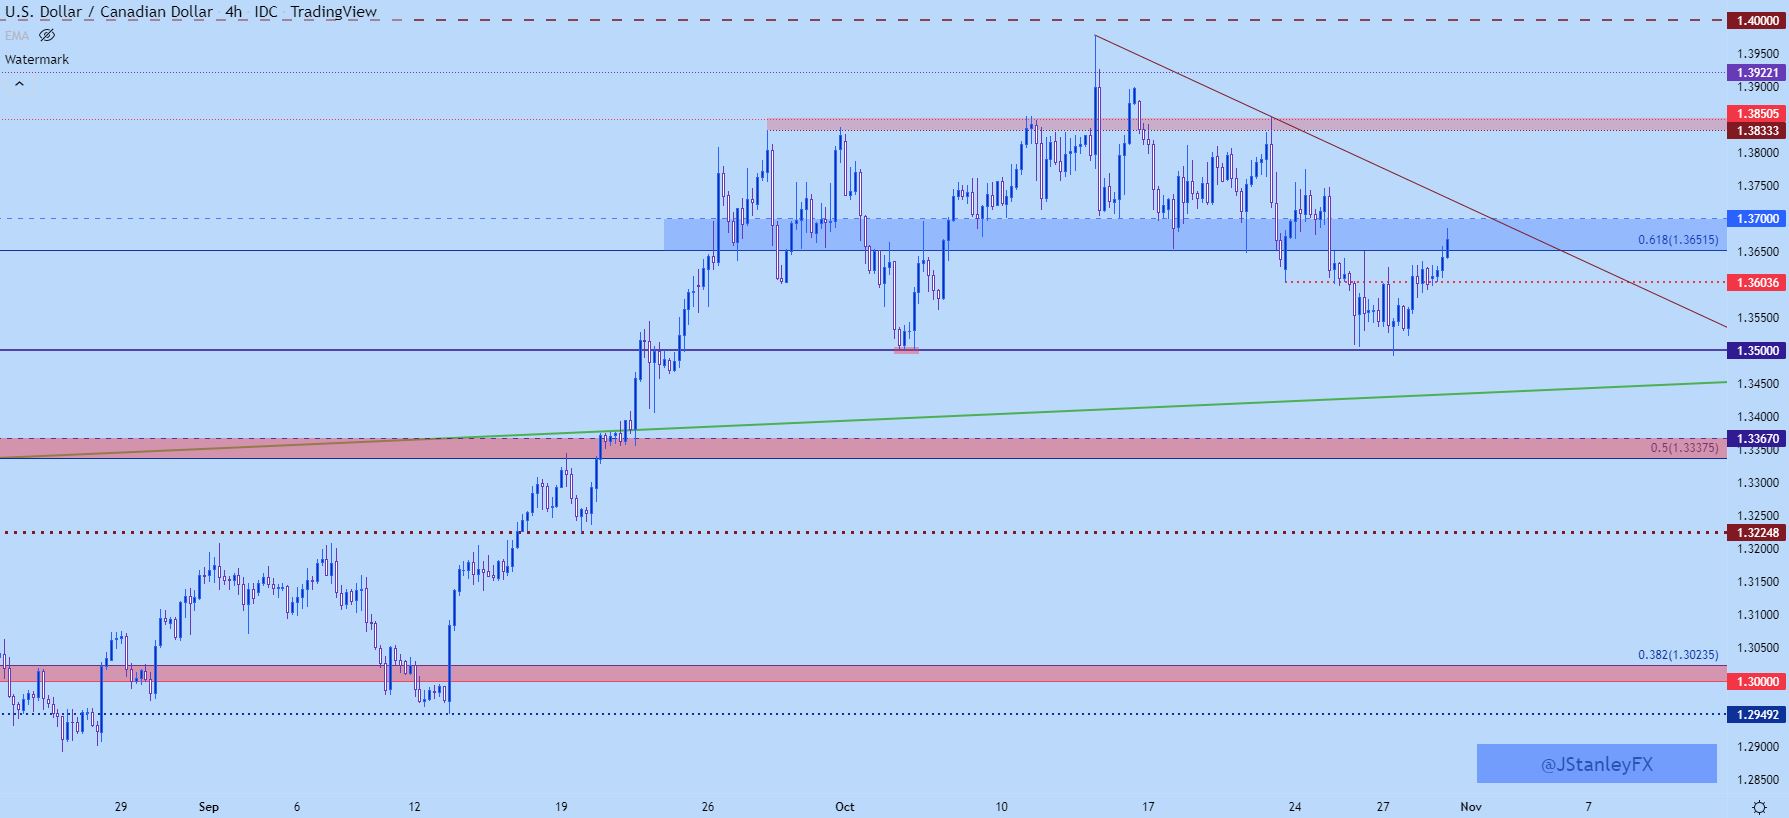
Chart prepared by James Stanley; USDCAD on Tradingview
USD/JPY Return to Sender
Bank of Japan intervention remained a force last week following a show on the prior Friday. But, as I had warned in last week’s forecast, until the BoJ actually shifted policy, there was motive on the long side of the pair given interest rate differentials.
At this point, the Bank of Japan has spent more than $40 billion to intervene and there’s not much left to show for it, as prices have simply ramped from support on their way back towards the 150.00 handle.
The obvious question is whether or not the BoJ is done, but it does seem as though they’ve picked a line-in-the-sand at the 150.00 level, but as we saw last week, that doesn’t mean that they’ll wait until 150.00 to intervene again. They want speculators on their toes and this is precisely what that type of policy can do. If their goal is to unsettle speculators, the prospect of 400 pip excursions could nullify the attractiveness of the carry trade. But, it could also keep the door open for working with pullbacks to support as Japan’s monetary policy still provides motive through the carry trade, and until rate policy changes, in either Japan or the US, that can remain the case.
USD/JPY Daily Price Chart
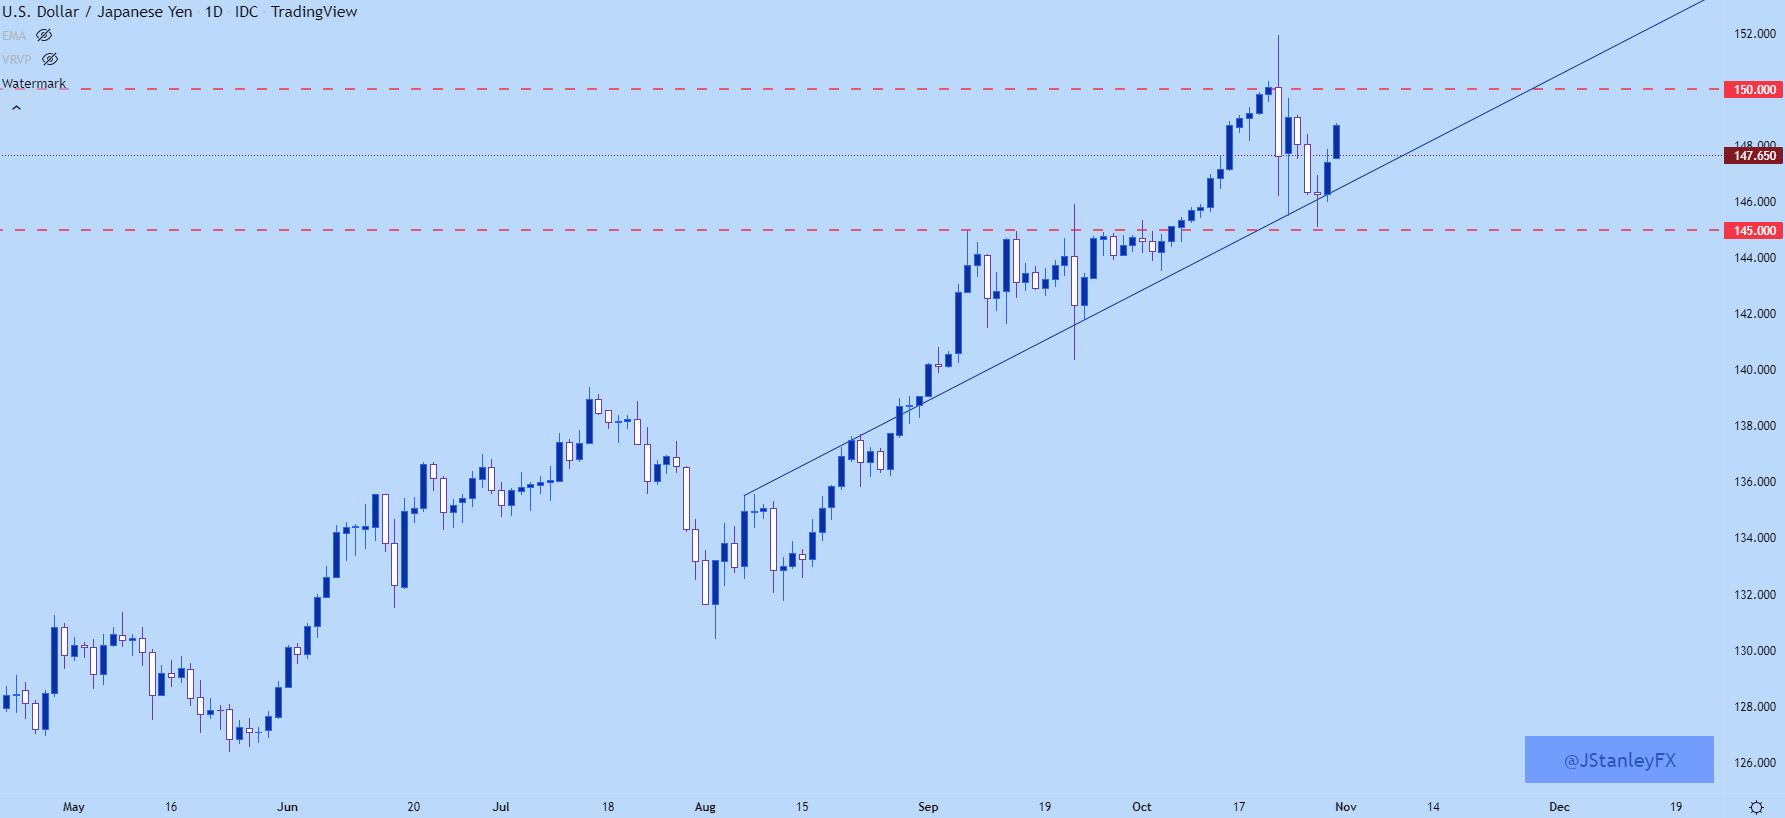
Chart prepared by James Stanley; USDJPY on Tradingview
— Written by James Stanley, Senior Strategist, DailyFX.com & Head of DailyFX Education
Contact and follow James on Twitter: @JStanleyFX
Be the first to comment