

US Dollar Talking Point:
- The US Dollar is holding near highs after last week’s breakout. Tomorrow’s release of CPI data is the big US driver for this week.
- This morning’s PPI report came in hot, printing at 0.4% v/s 0.2% expected. This highlights continued inflationary pressure in the US economy and we’ll get another piece of data on the matter tomorrow morning with the release of CPI data for the month of September.
- GBP/USD put in another dramatic fall after reversing in-front of the 1.1500 level last week, and USD/JPY is at a fresh 24-year-high. EUR/USD is roughly unchanged on the day at this point, even despite the reports around the ECB that the bank is preparing for larger rate hikes in the not-too-distant future.
- The analysis contained in article relies on price action and chart formations. To learn more about price action or chart patterns, check out our DailyFX Education section.
Recommended by James Stanley
Download our US Dollar Forecast
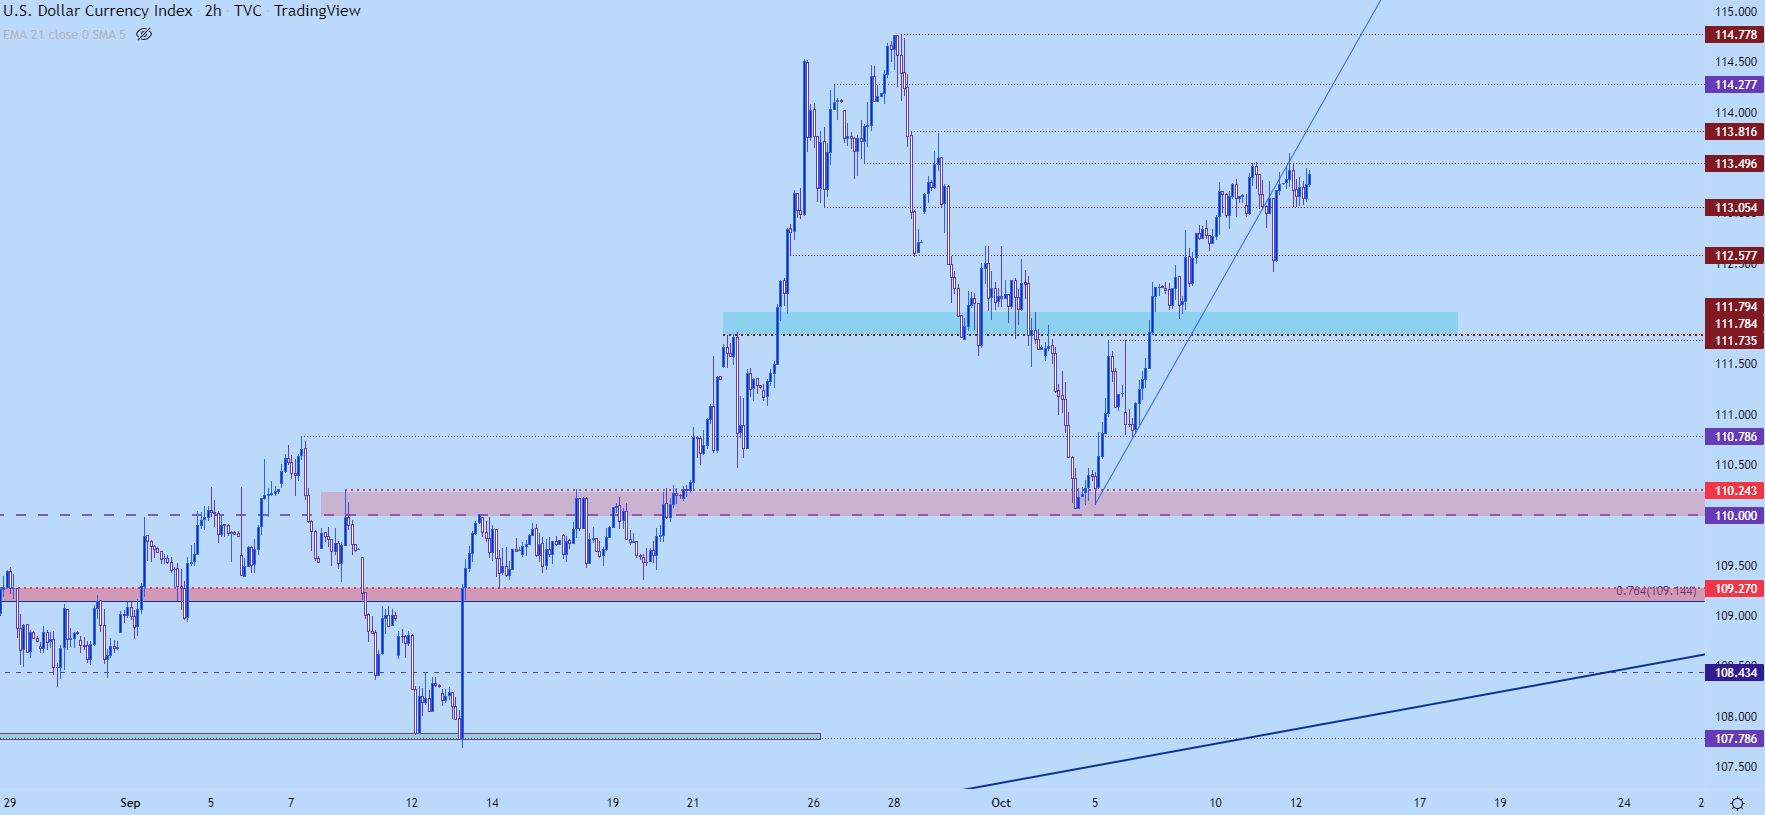
When I last looked at the US Dollar on Thursday, the currency was setting up for yet another bullish breakout, showing an ascending triangle pattern with resistance at a familiar spot. That breakout has continued to run and we even saw a fresh high print yesterday, with DXY finding resistance at another familiar level of 113.50.
Short-term price action in the USD retains a bullish lean at this point, but, notably, there has been underside resistance from the bullish trendline that guided the ascending breakout last week. Prices tried to pose a deeper pullback yesterday but quickly pushed back-up to resistance after Andrew Bailey sent a stern warning to UK pensions. Current resistance at 113.50 has already been tested, and there’s another level above that at 113.82. Beyond that, I’m tracking another prior swing at 114.28 after which the current 20-year-high comes into play, plotted at 114.78.
Short-term, there’s a possible inverse head and shoulders pattern in here that keeps the door open for breakouts from the neckline, which shows around current resistance.
On the support side of the matter, current support is showing at another prior price action swing around 113.05, after which support at 112.58 comes into the picture. If that’s broken-below, the same zone of resistance from last week’s ascending triangle comes into the picture and that’s plotted around 111.75.
US Dollar Two-Hour Price Chart
Chart prepared by James Stanley; USD, DXY on Tradingview
EUR/USD
I think the weekly chart is notable here as it highlights an aggressively bearish trend that’s shown no signs yet of letting up. Last week’s early trade saw a glimmer of hope as prices pushed up to the parity level for a resistance test. But that was quickly squashed as sellers returned and push prices right back down into the .9700’s.
EUR/USD Weekly Chart
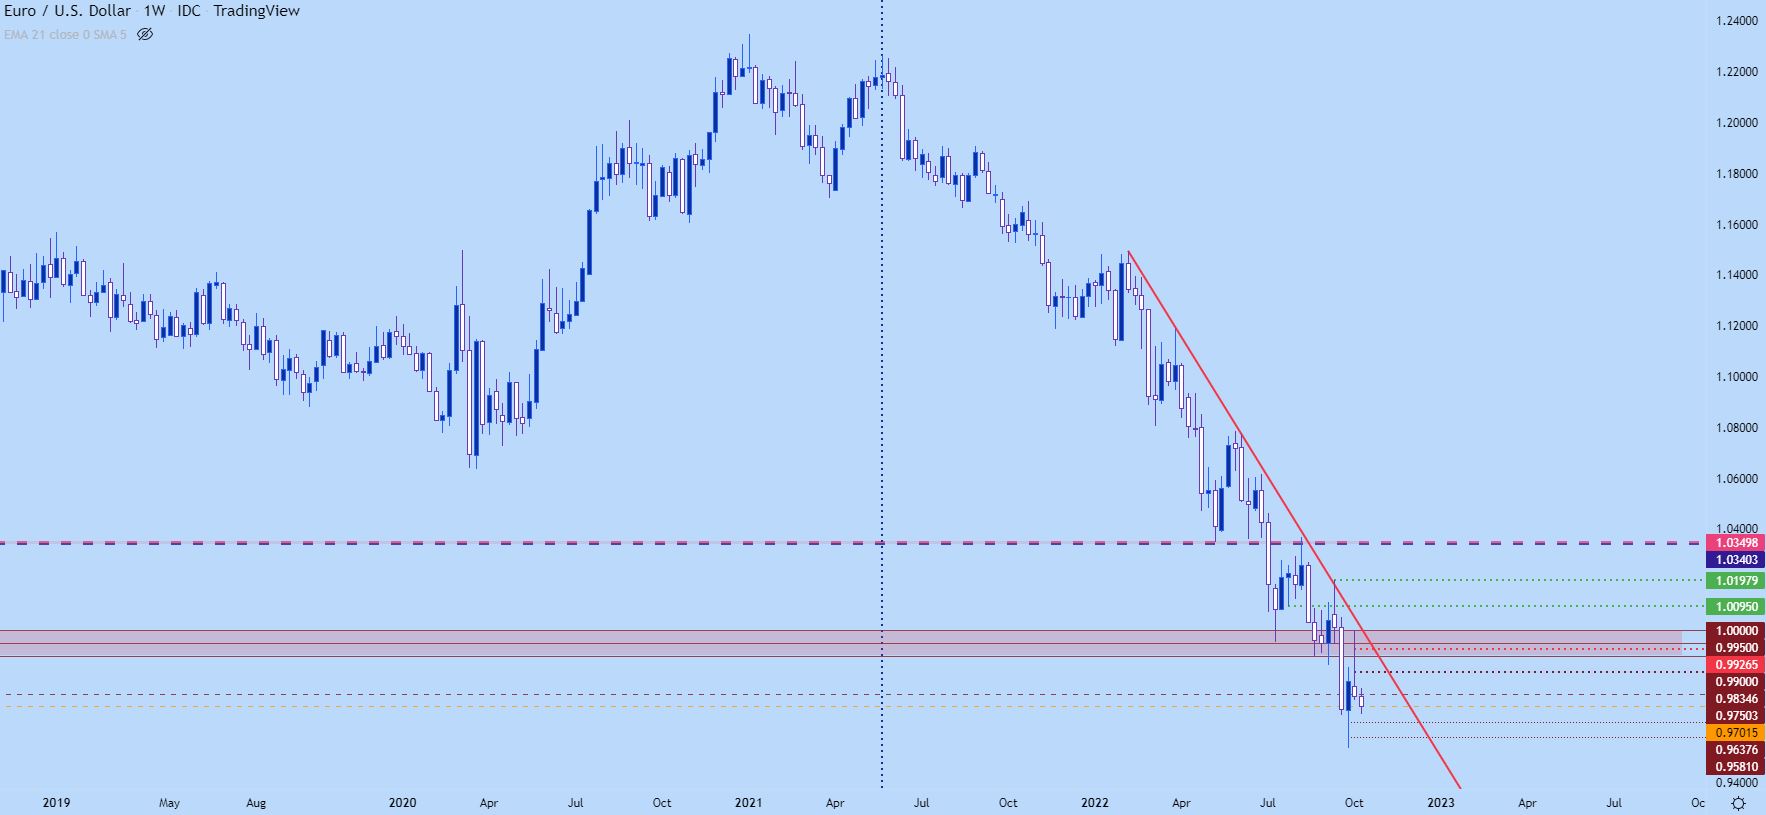
Chart prepared by James Stanley; EURUSD on Tradingview
EUR/USD Shorter-Term
Short-term, EUR/USD is trying to hold that support around the .9700 psychological level after the 300 pip move off of the parity handle. An attempted recovery yesterday was quickly faded with prices returning right back to the .9700 handle. This gives the appearance of a short-term head and shoulders pattern which is the inverse of what I looked at above in the USD/DXY.
This keeps the door open for bearish breakout scenarios on pushes below support, which I’m tracking at the bearish trendline connecting this week’s swing-lows. A break-above yesterday’s high invalidates the bearish theme and re-opens the door for short-term bullish breakout potential, tracking into next resistance-turned-support-turned resistance at .9835.
EUR/USD Two-Hour Chart
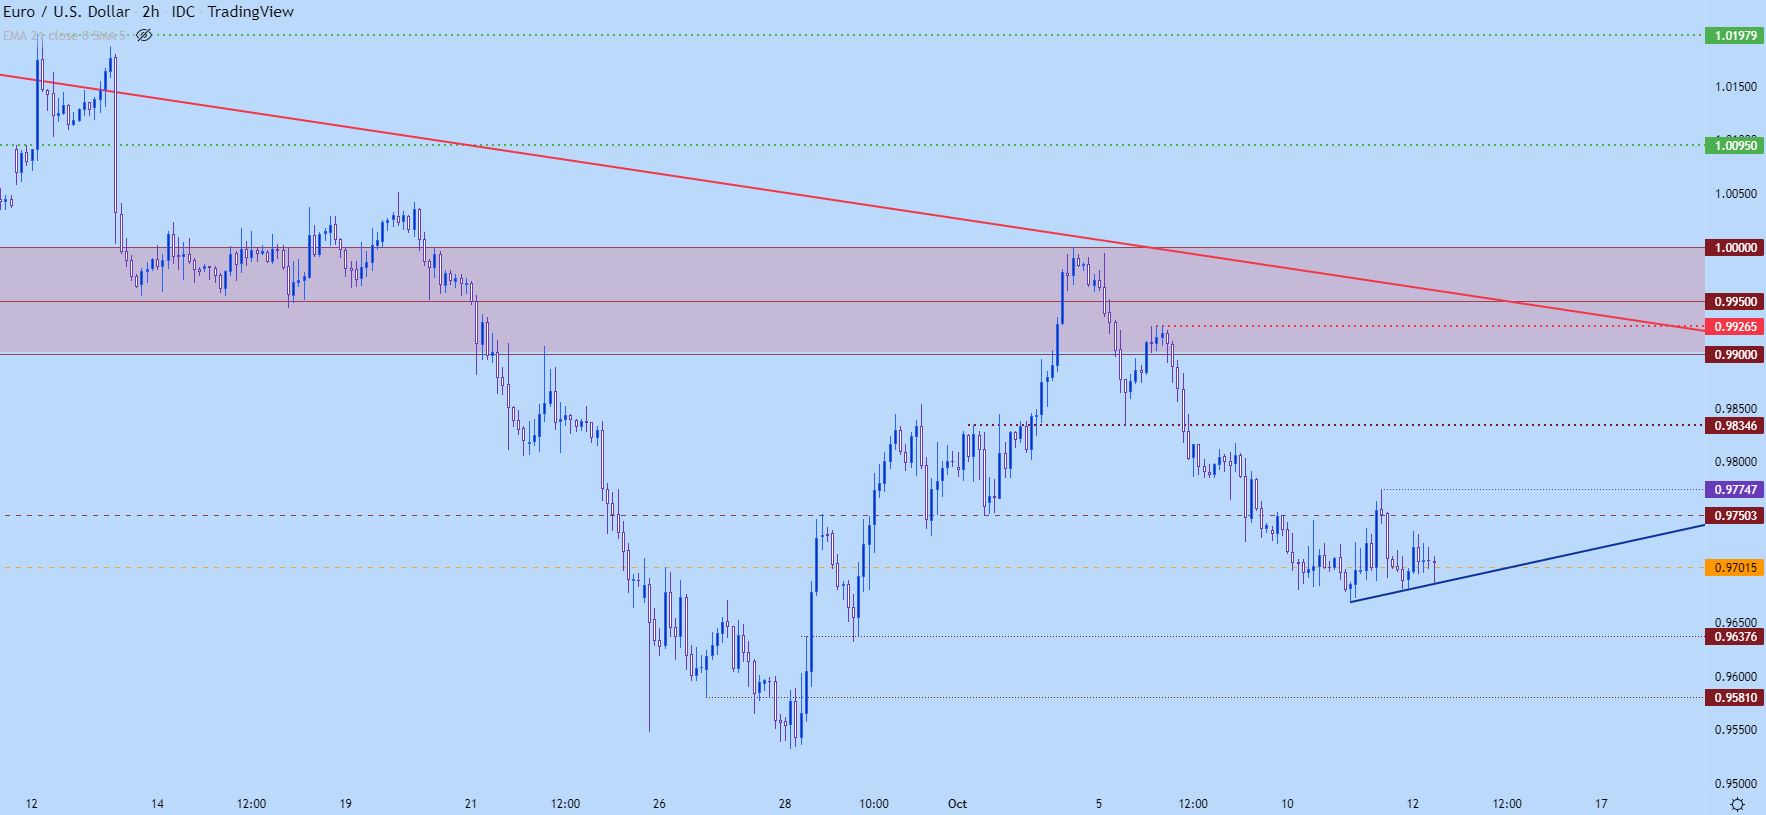
Chart prepared by James Stanley; EURUSD on Tradingview
GBP/USD
This is a tough one given the headlines …
When in these situations I’ll usually default to techs for workable strategy as, at the very least, that can be incorporated into risk management. And techs have remained fairly clean from my point of view.
I had warned of such a move on September 23rd, saying ‘Cable is in Collapse Territory.’
The currency collapsed a few days later… I then looked at it the article ‘British Pound Technical Analysis,’ sharing levels of note for recovery plays. As the recovery continued to work, it was the resistance zone around the 1.1500 level that loomed large and that’s eventually what came in to help mark the recent top.
Bears began hitting the pair in earnest again mid-week, and by Thursday GBP/USD had already turned. The pair pushed all the way down to the 1.1000 psychological level, which was holding as support early in yesterday’s session until Andrew Bailey sent a series of remarks regarding the Bank of England’s Monetary Policy that seemed to do little to instill confidence around the situation, which led to another downside break in Sterling.
At this point, prices have attempted to start a recovery after that fresh low yesterday and the prior support zone, spanning from 1.1000-1.1023 is helping to hold short-term lows. A hold above 1.1000 keeps the door open for another push up to resistance around the 1.1112 level, but if bulls can’t hold the psychological level we could see another quick and hastened downside move.
At this point, the bullish side of the pair does feel a bit as though it’s playing in-between the cracks of a larger macro theme.
GBP/USD Two-Hour Price Chart
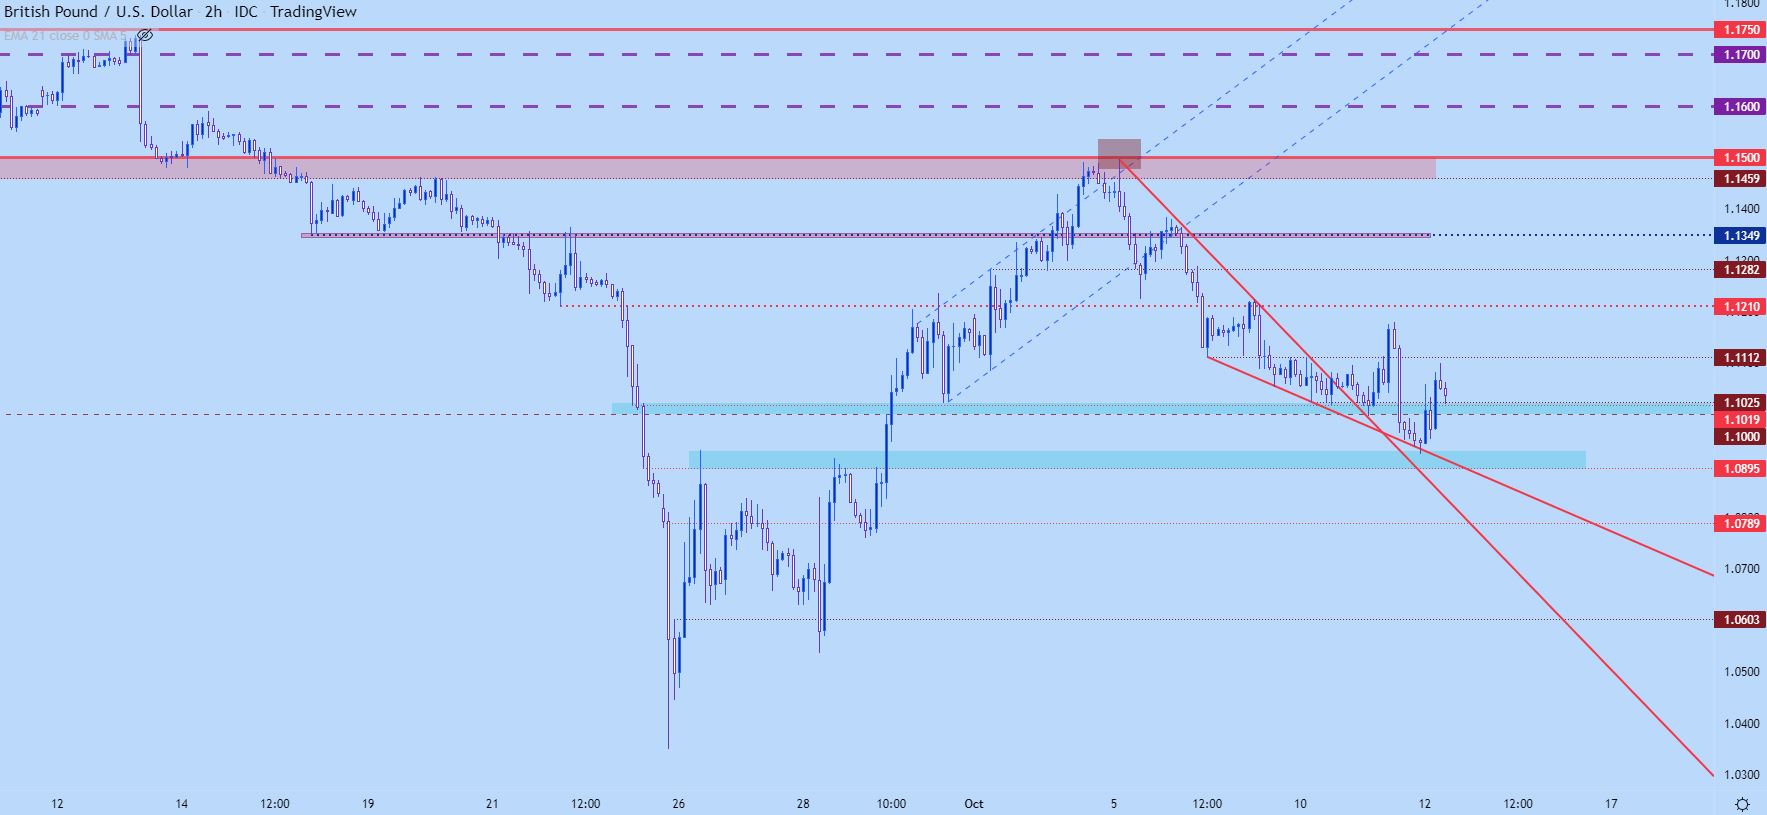
Chart prepared by James Stanley; GBPUSD on Tradingview
USD/CAD
I’ll keep this one short as the tech backdrop speaks for itself. I’ve looked at this one from a few different vantage points of late, with a key resistance level coming into play last week at 1.3833.
A week later, that resistance remains, and price action is showing an ascending triangle formation and could likely even be argued as an inverse head-and-shoulders pattern, which keeps the door open for continued bullish breakout potential.
USD/CAD Four-Hour Price Chart
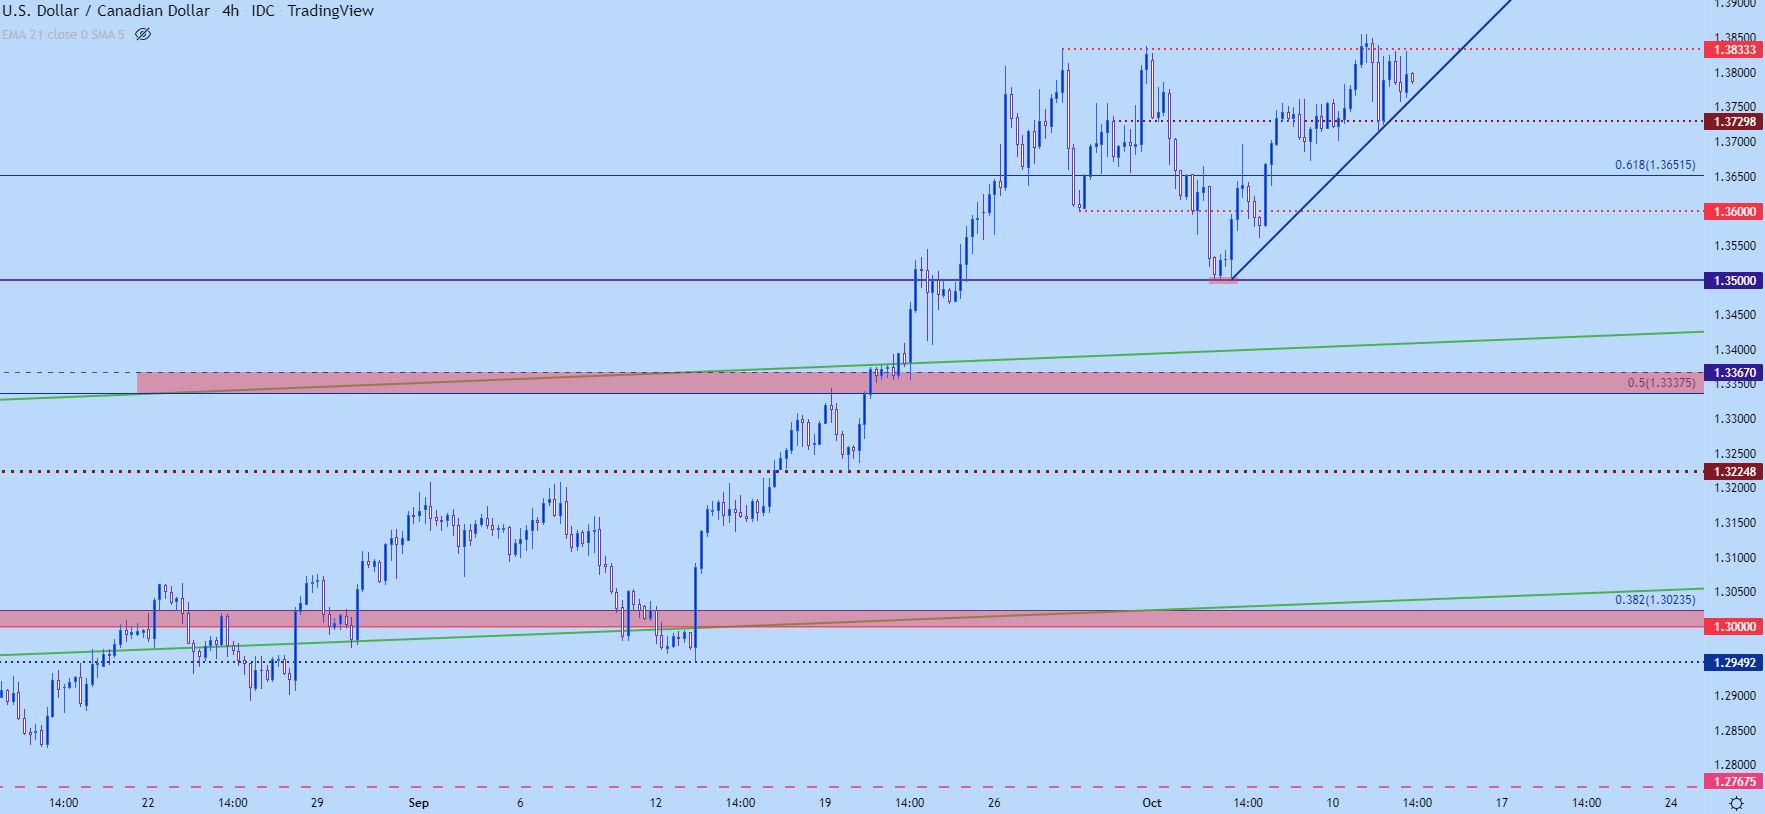
Chart prepared by James Stanley; USDCAD on Tradingview
USD/JPY
While the above situation in USD/CAD seems rather simple from a technical perspective, USD/JPY is anything but and this is largely due to the fundamentals behind the matter.
The carry in USD/JPY remains strong on the long side, which I highlighted a couple of weeks ago after the intervention-fueled dip. But, the theoretical line-in-the-sand from the Ministry of Finance is being tested through at the moment as that was thought to be around the 145.00 level. USD/JPY closed above that price last week and the move on Monday was tepid, in what appeared to be caution in case there was another intervention announcement.
But, as the week has worn on and as no announcements have come out, traders have continued to push the envelope and price is now at fresh 24-year-highs. The next major area of resistance is at 147.65, which was the high in 1998 when the BoJ was last actively-engaged in an intervention campaign. Above that level, USD/JPY is trading at fresh 32-year-highs and that swing is all the way up at the 160.00 psychological level.
USD/JPY Daily Chart
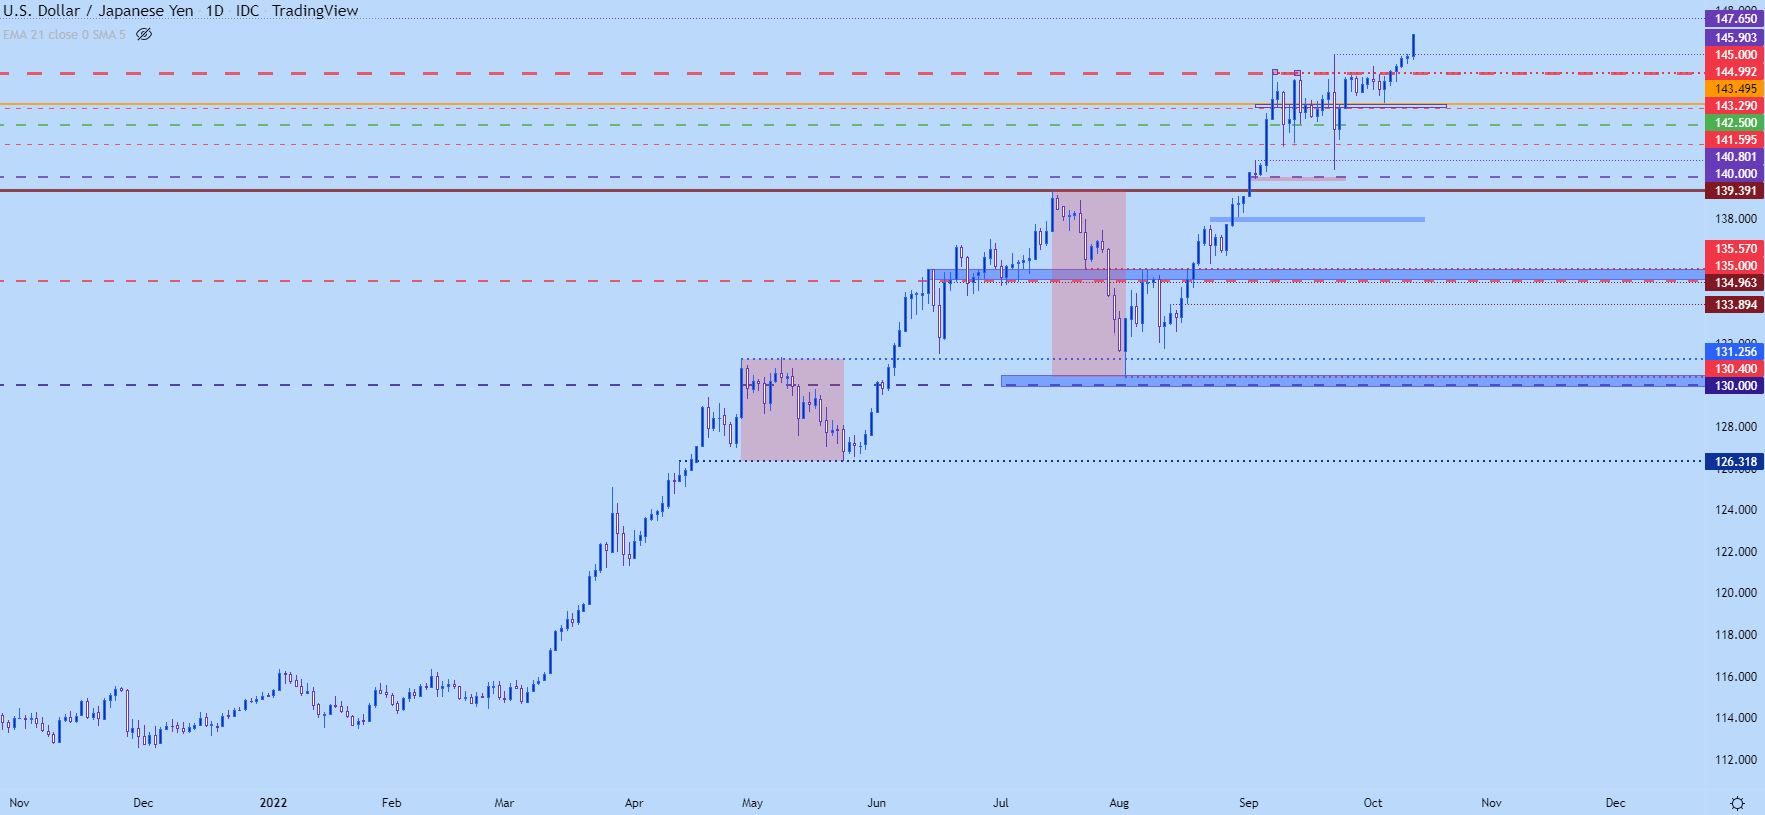
Chart prepared by James Stanley; USDJPY on Tradingview
— Written by James Stanley, Senior Strategist, DailyFX.com & Head of DailyFX Education
Contact and follow James on Twitter: @JStanleyFX
Be the first to comment